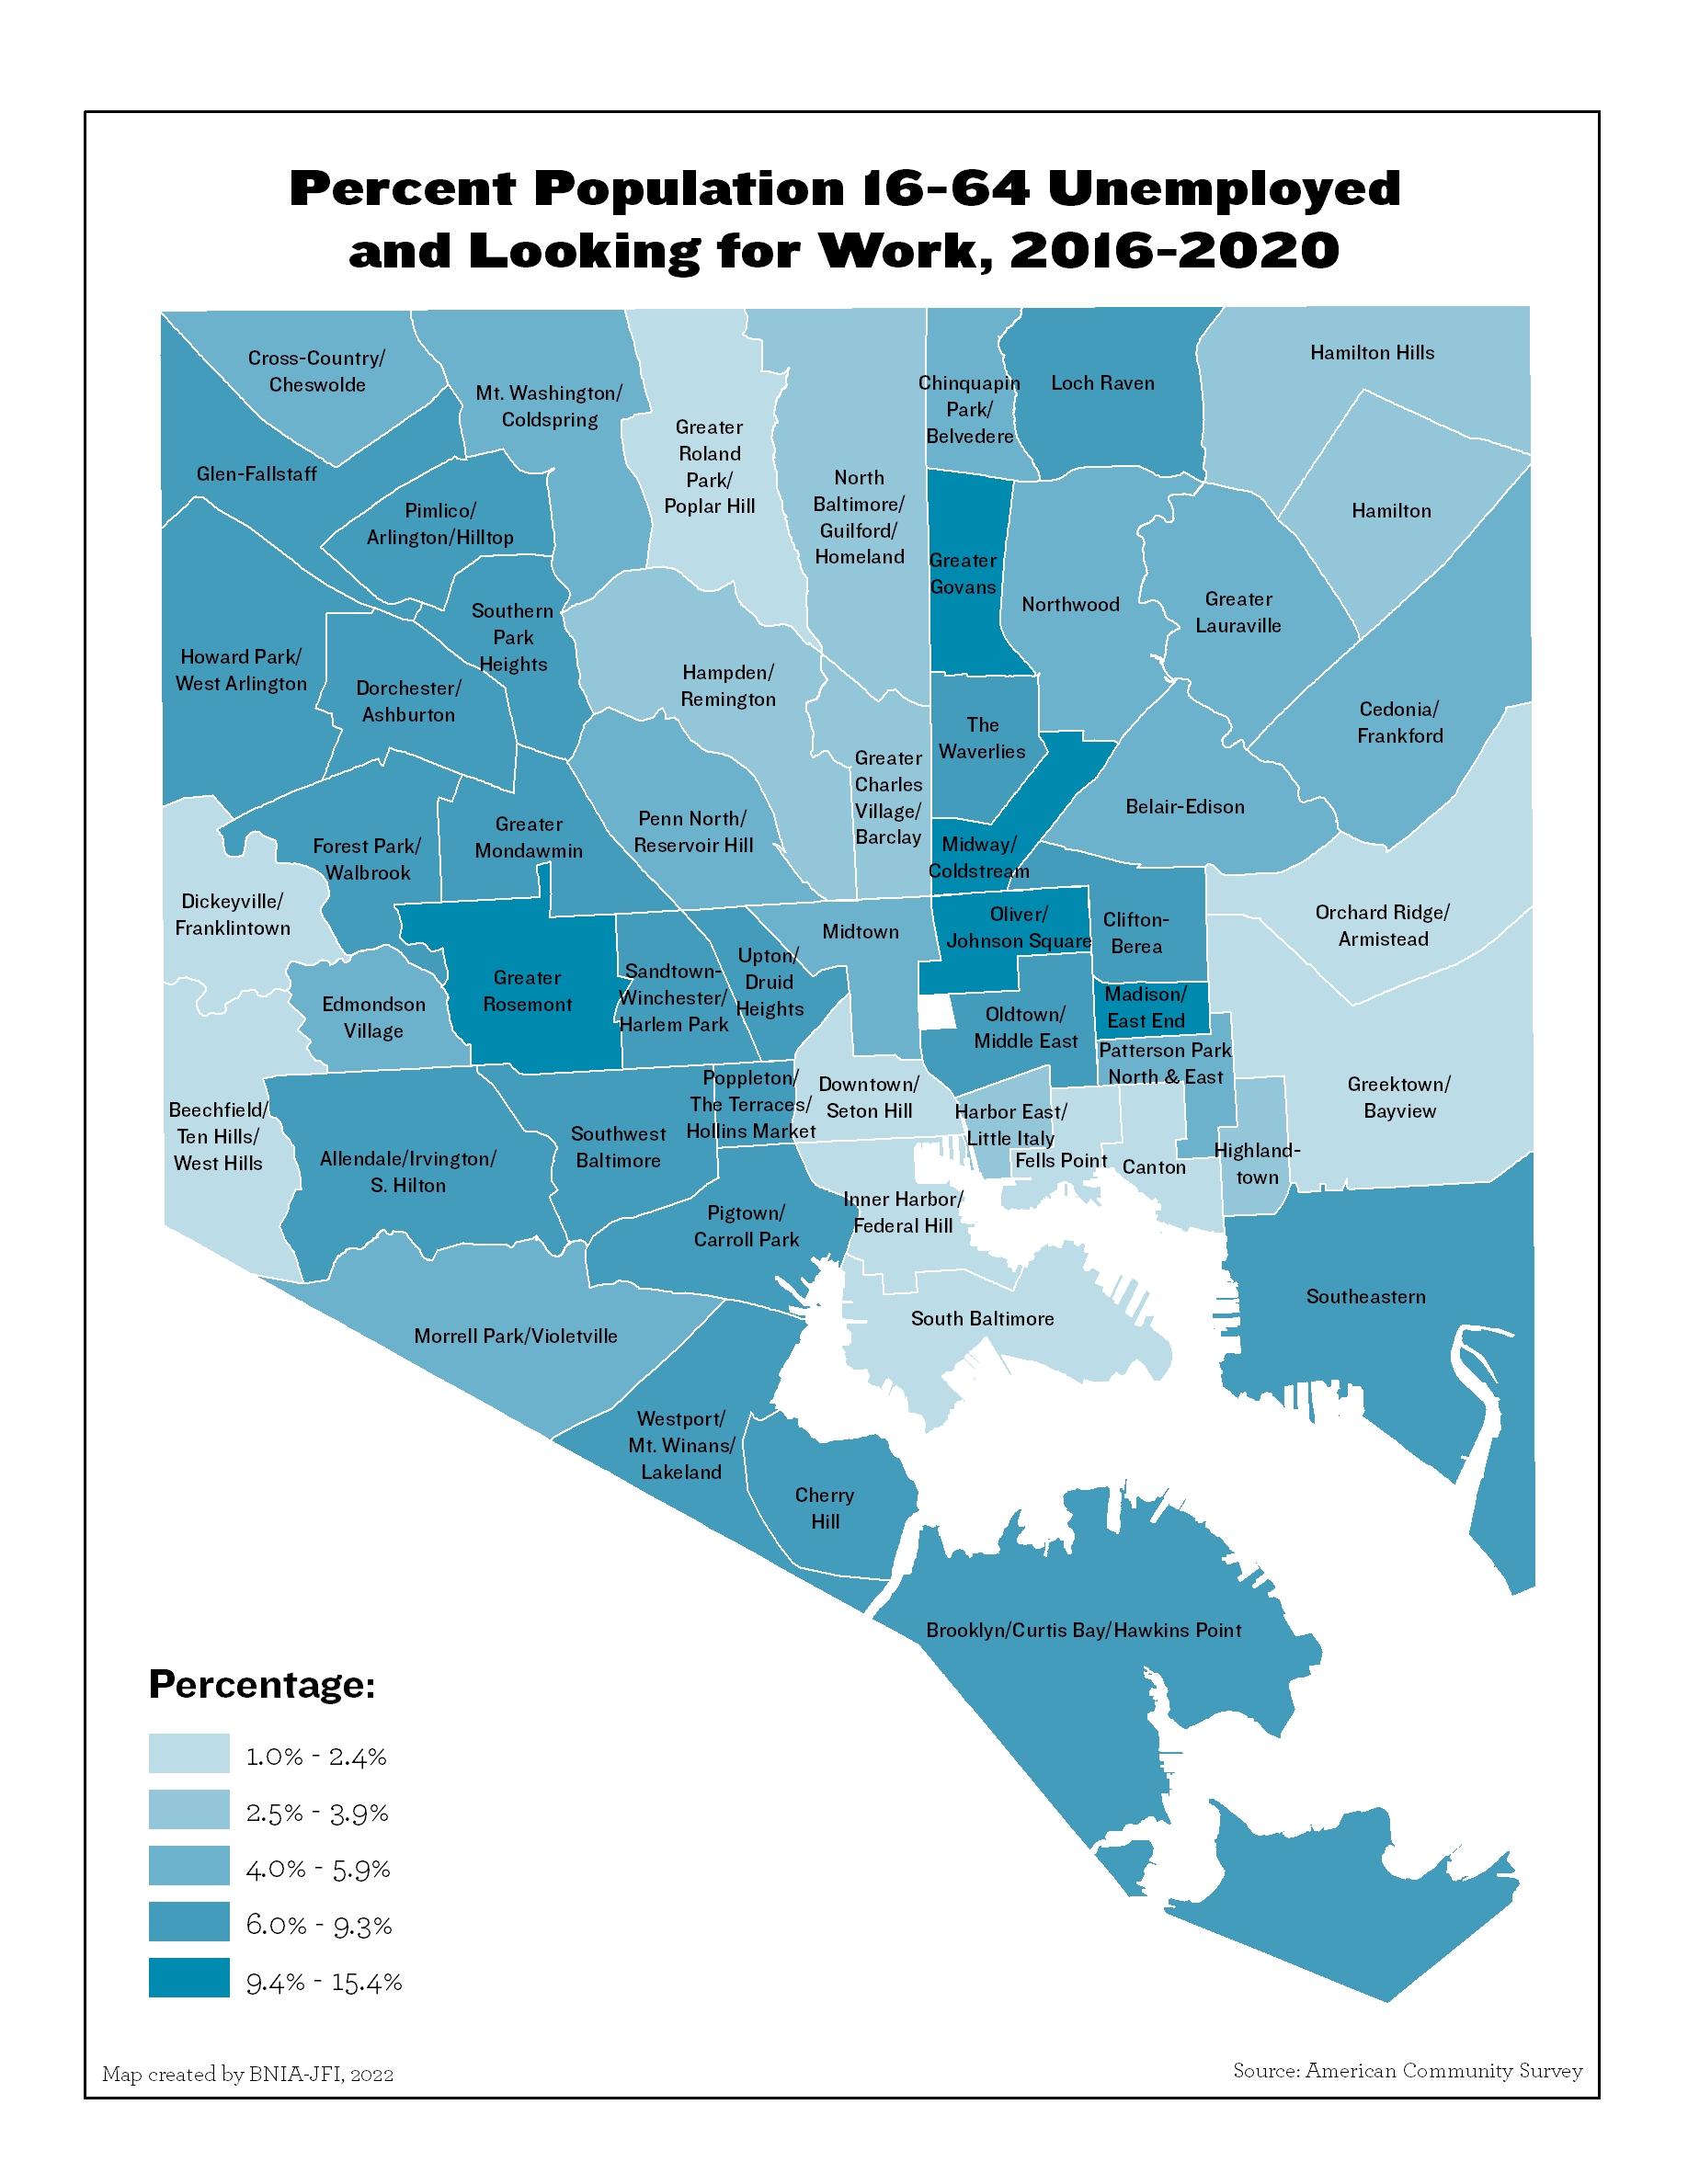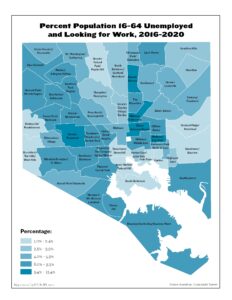
Percent Population 16-64 Unemployed and Looking for Work (2020)
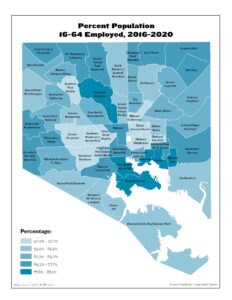
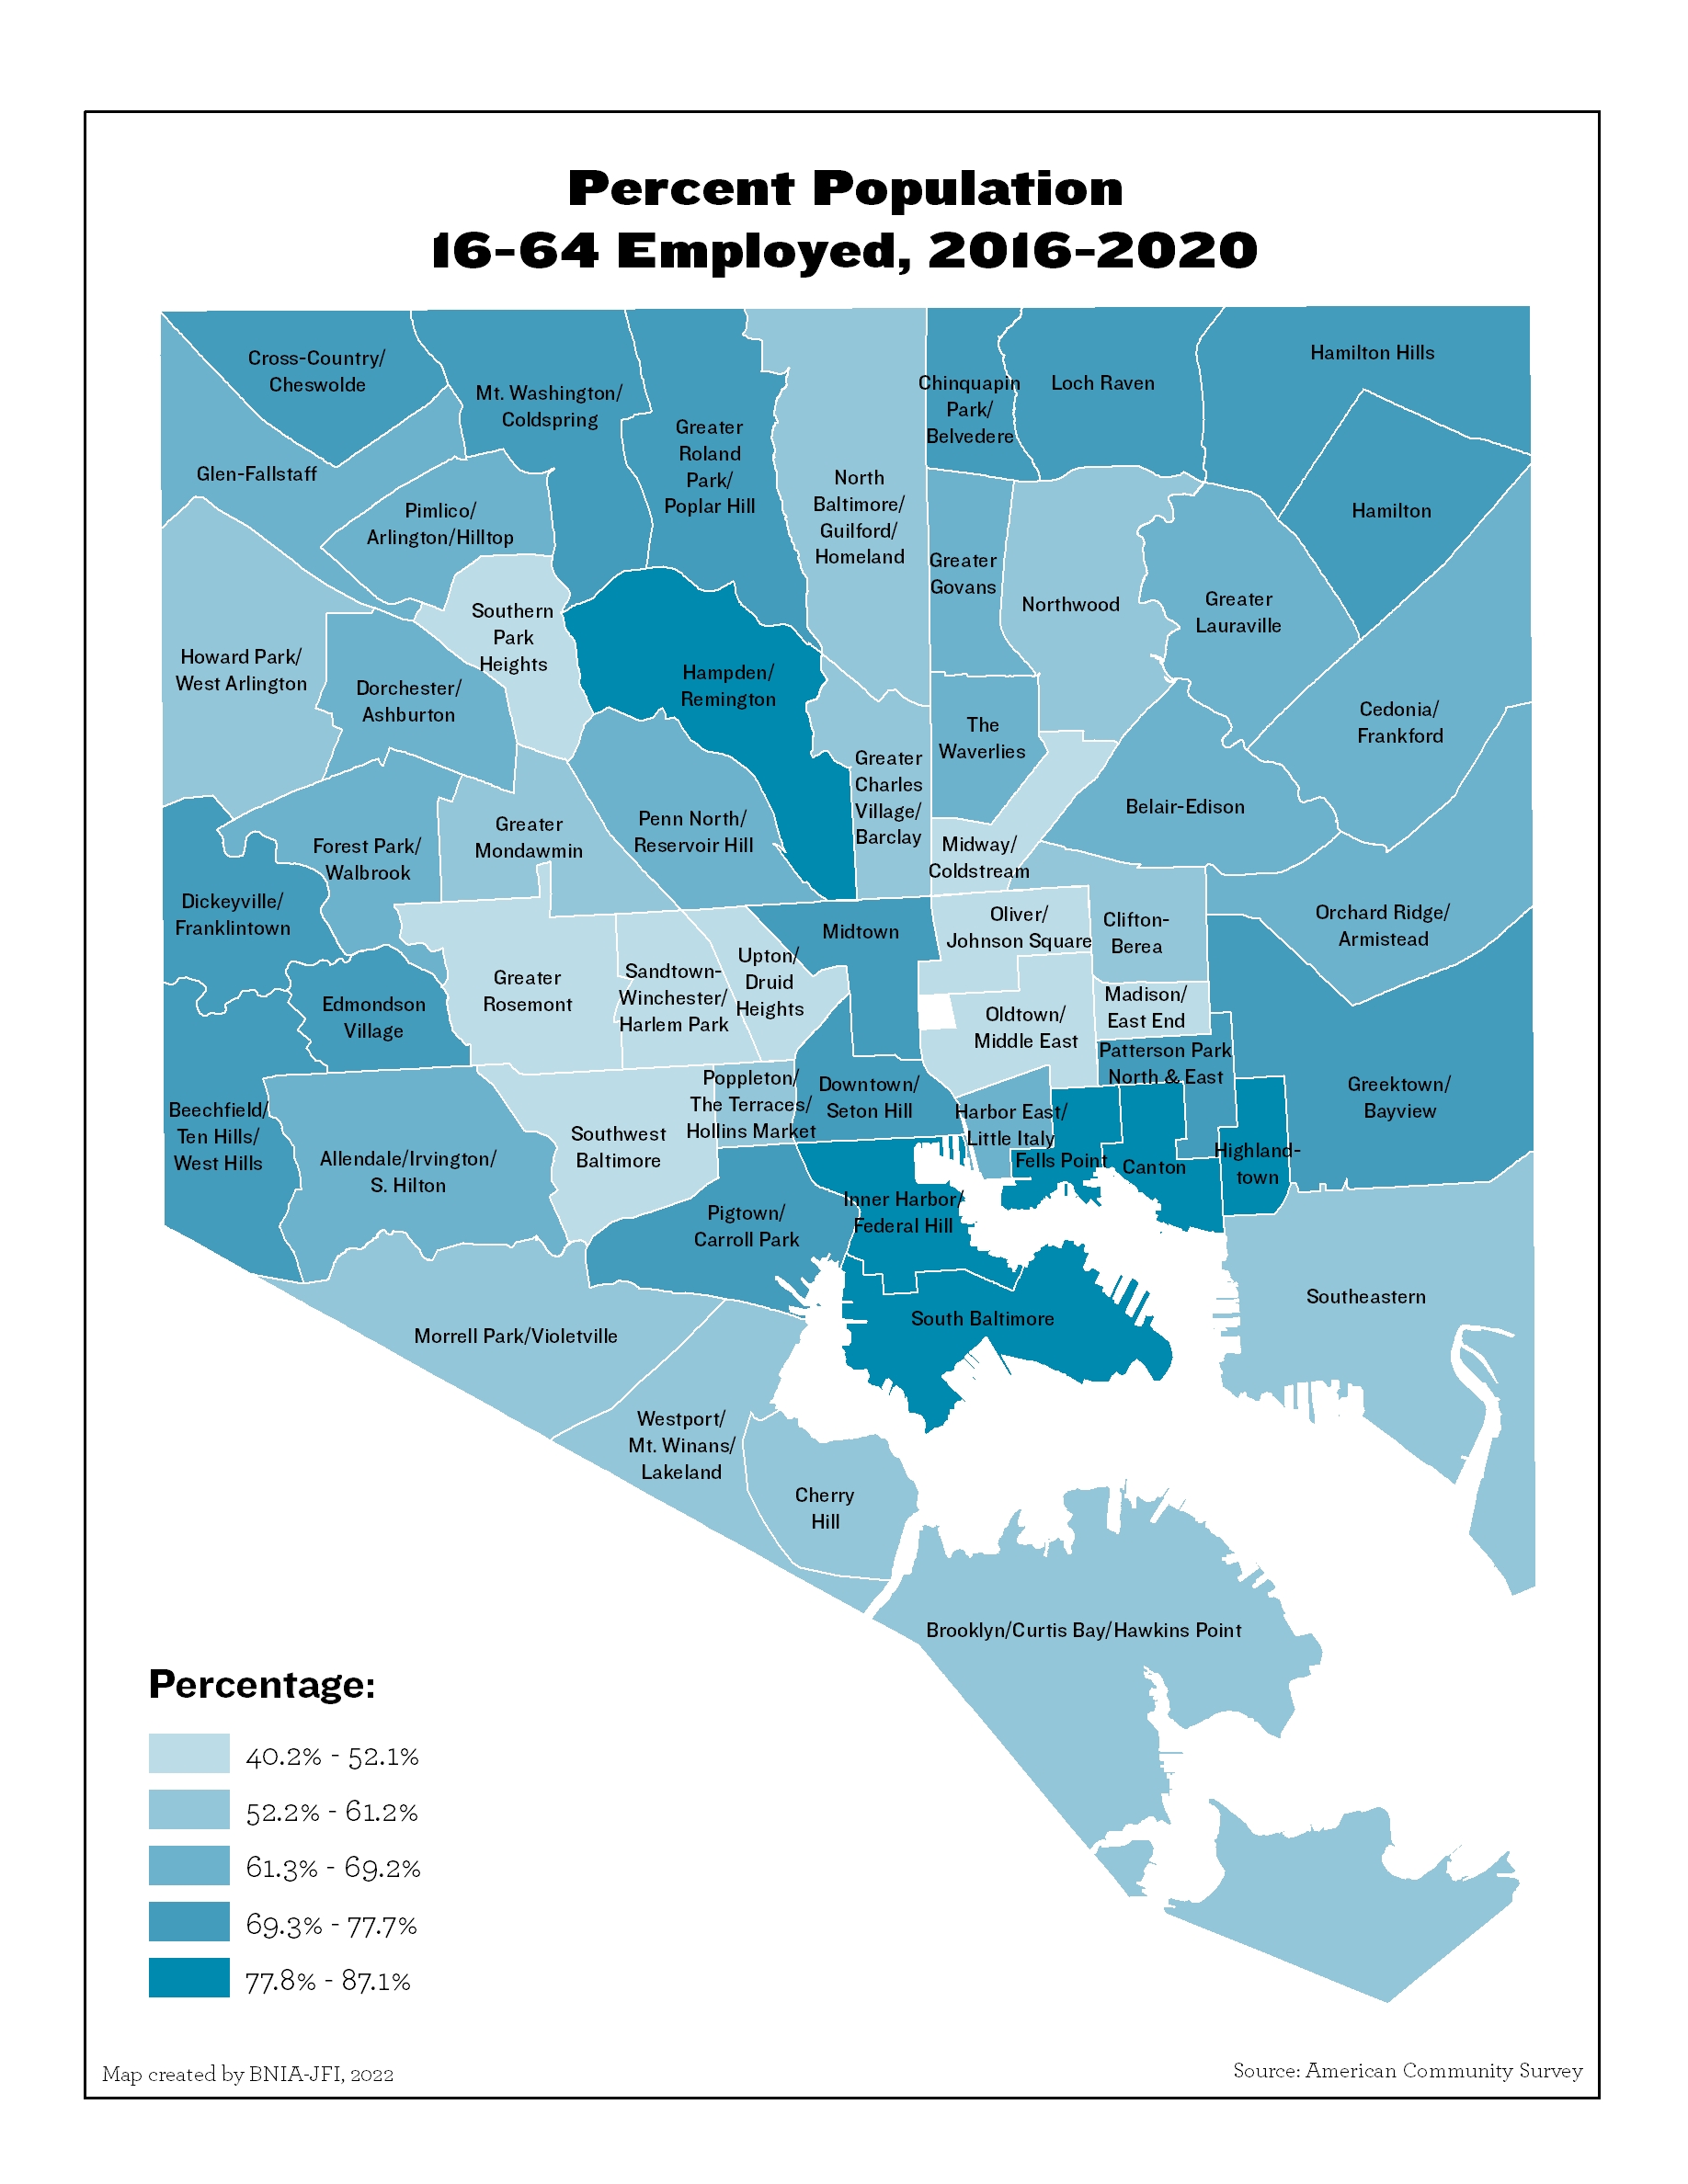
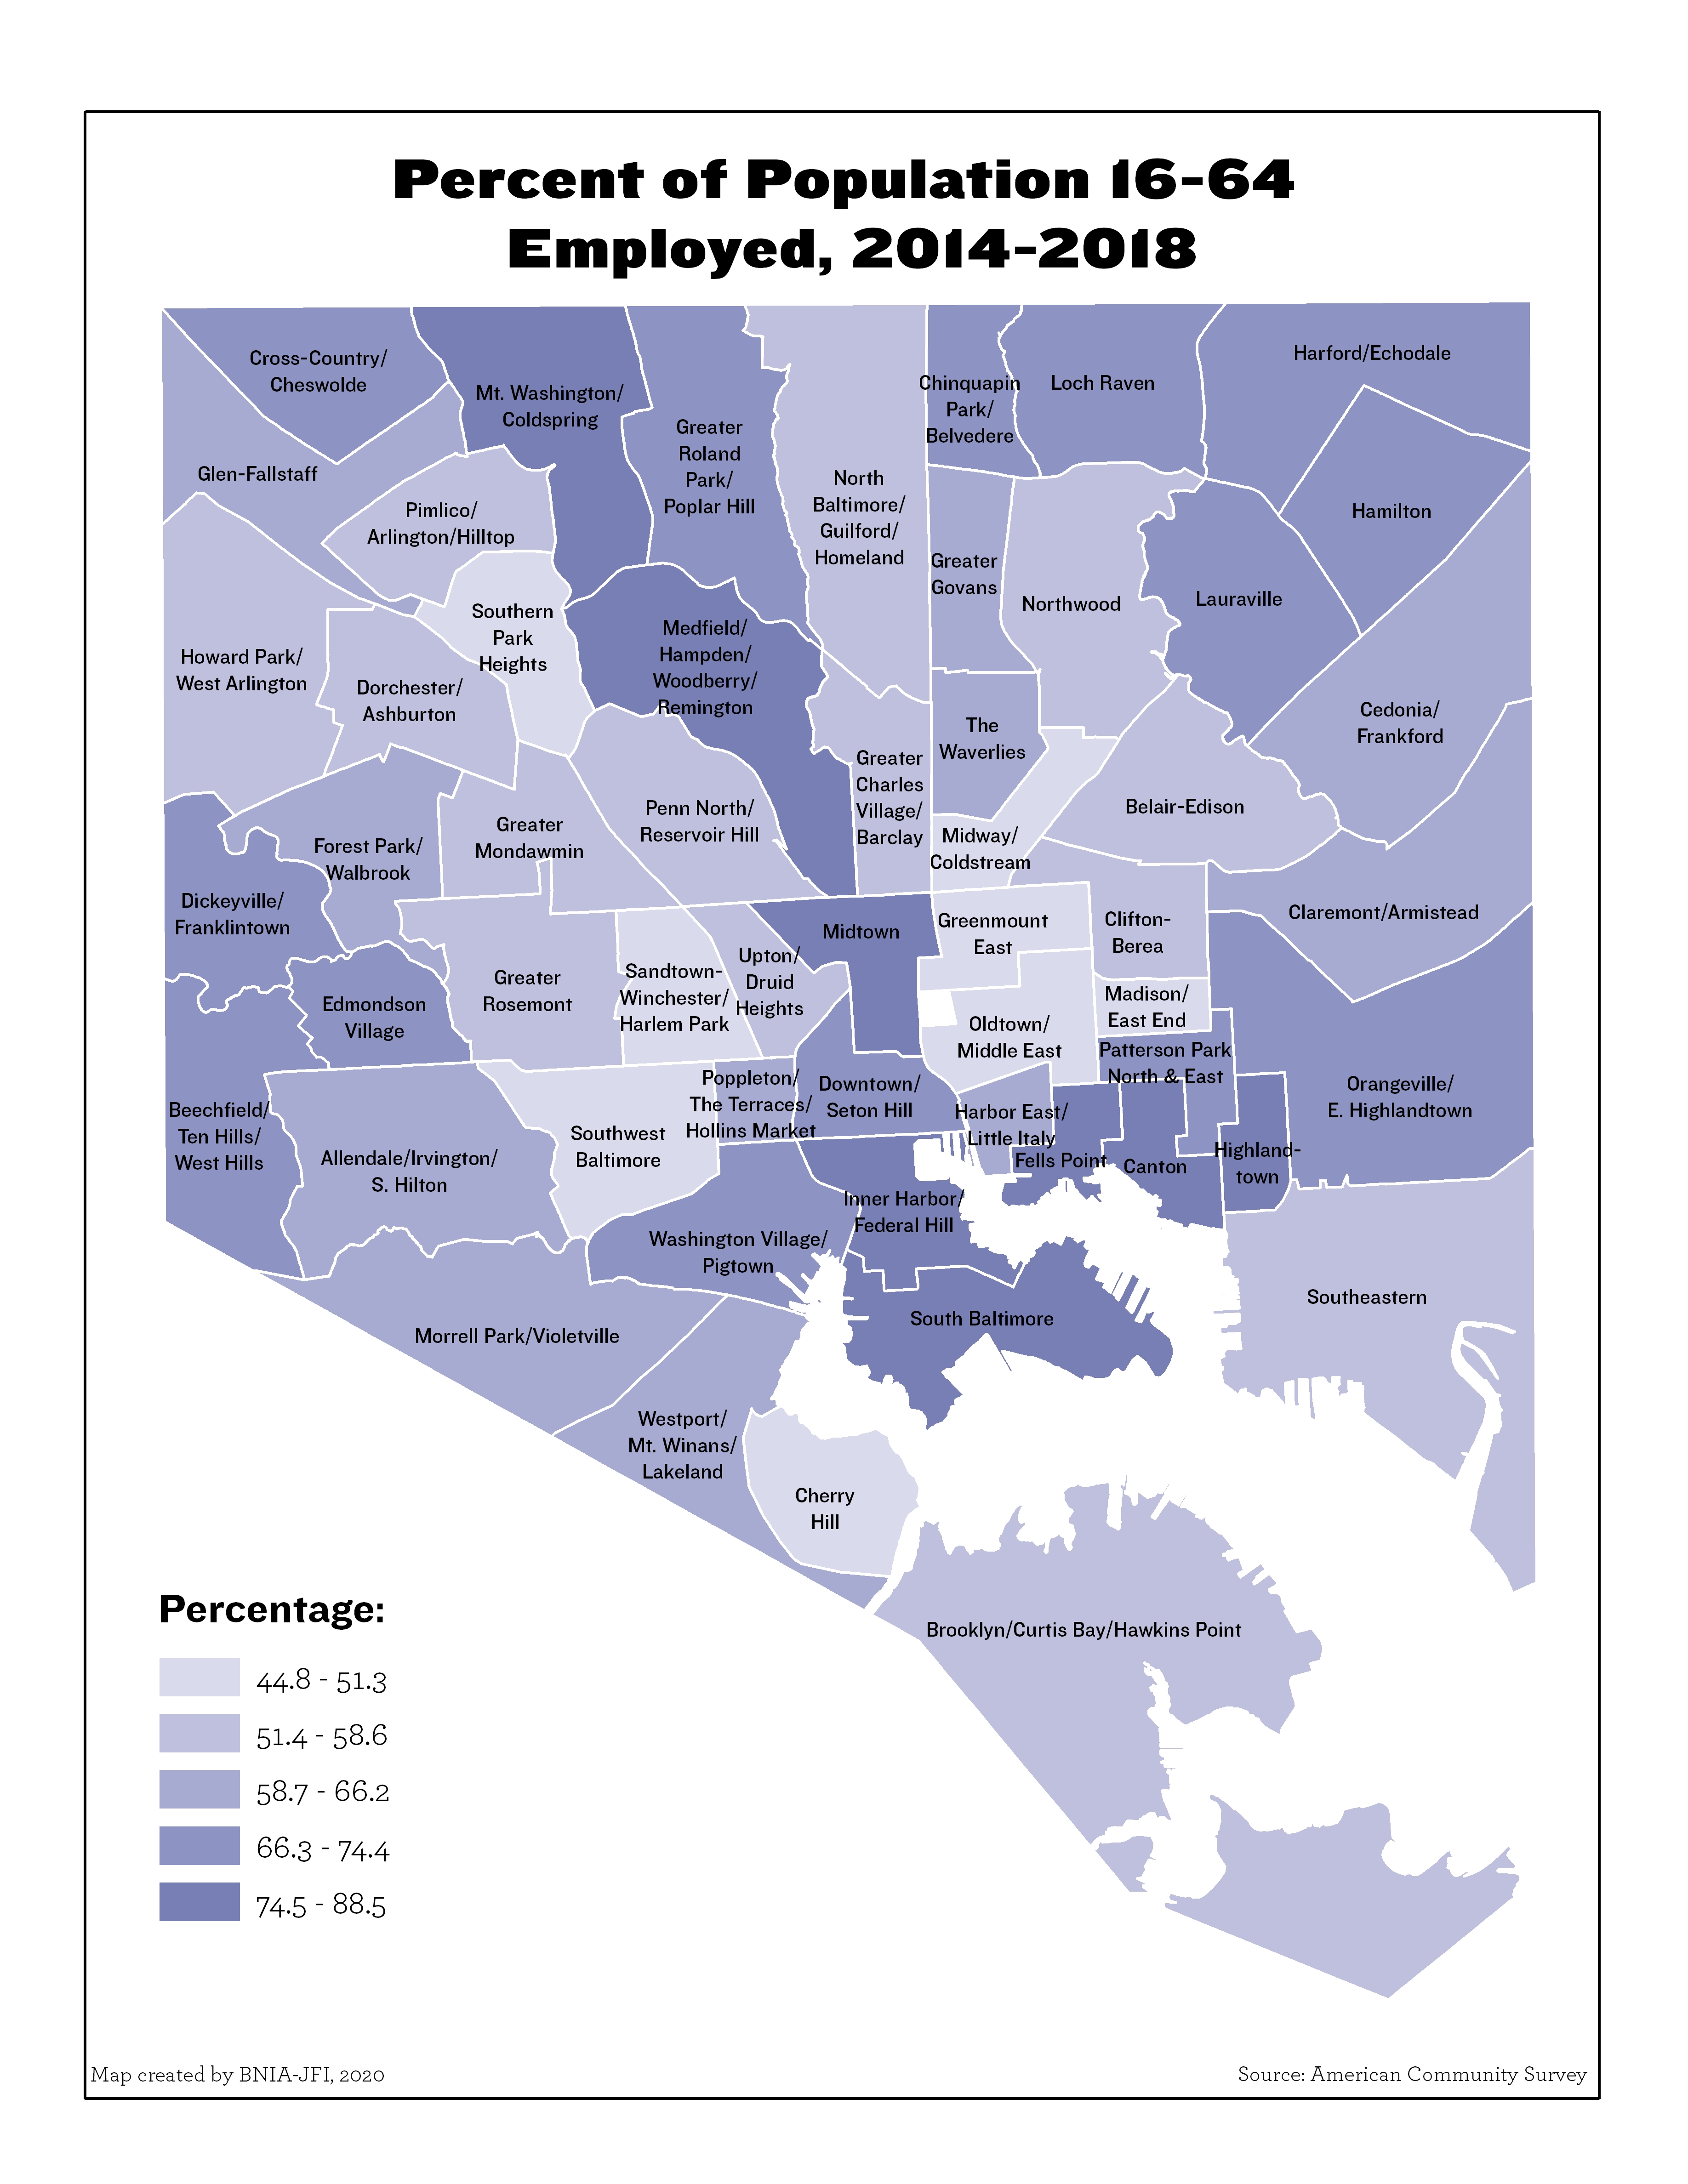
Percent Population 16-64 Employed (2020)
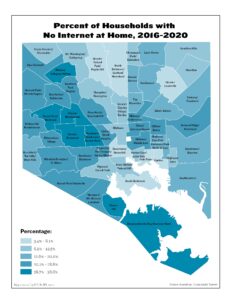
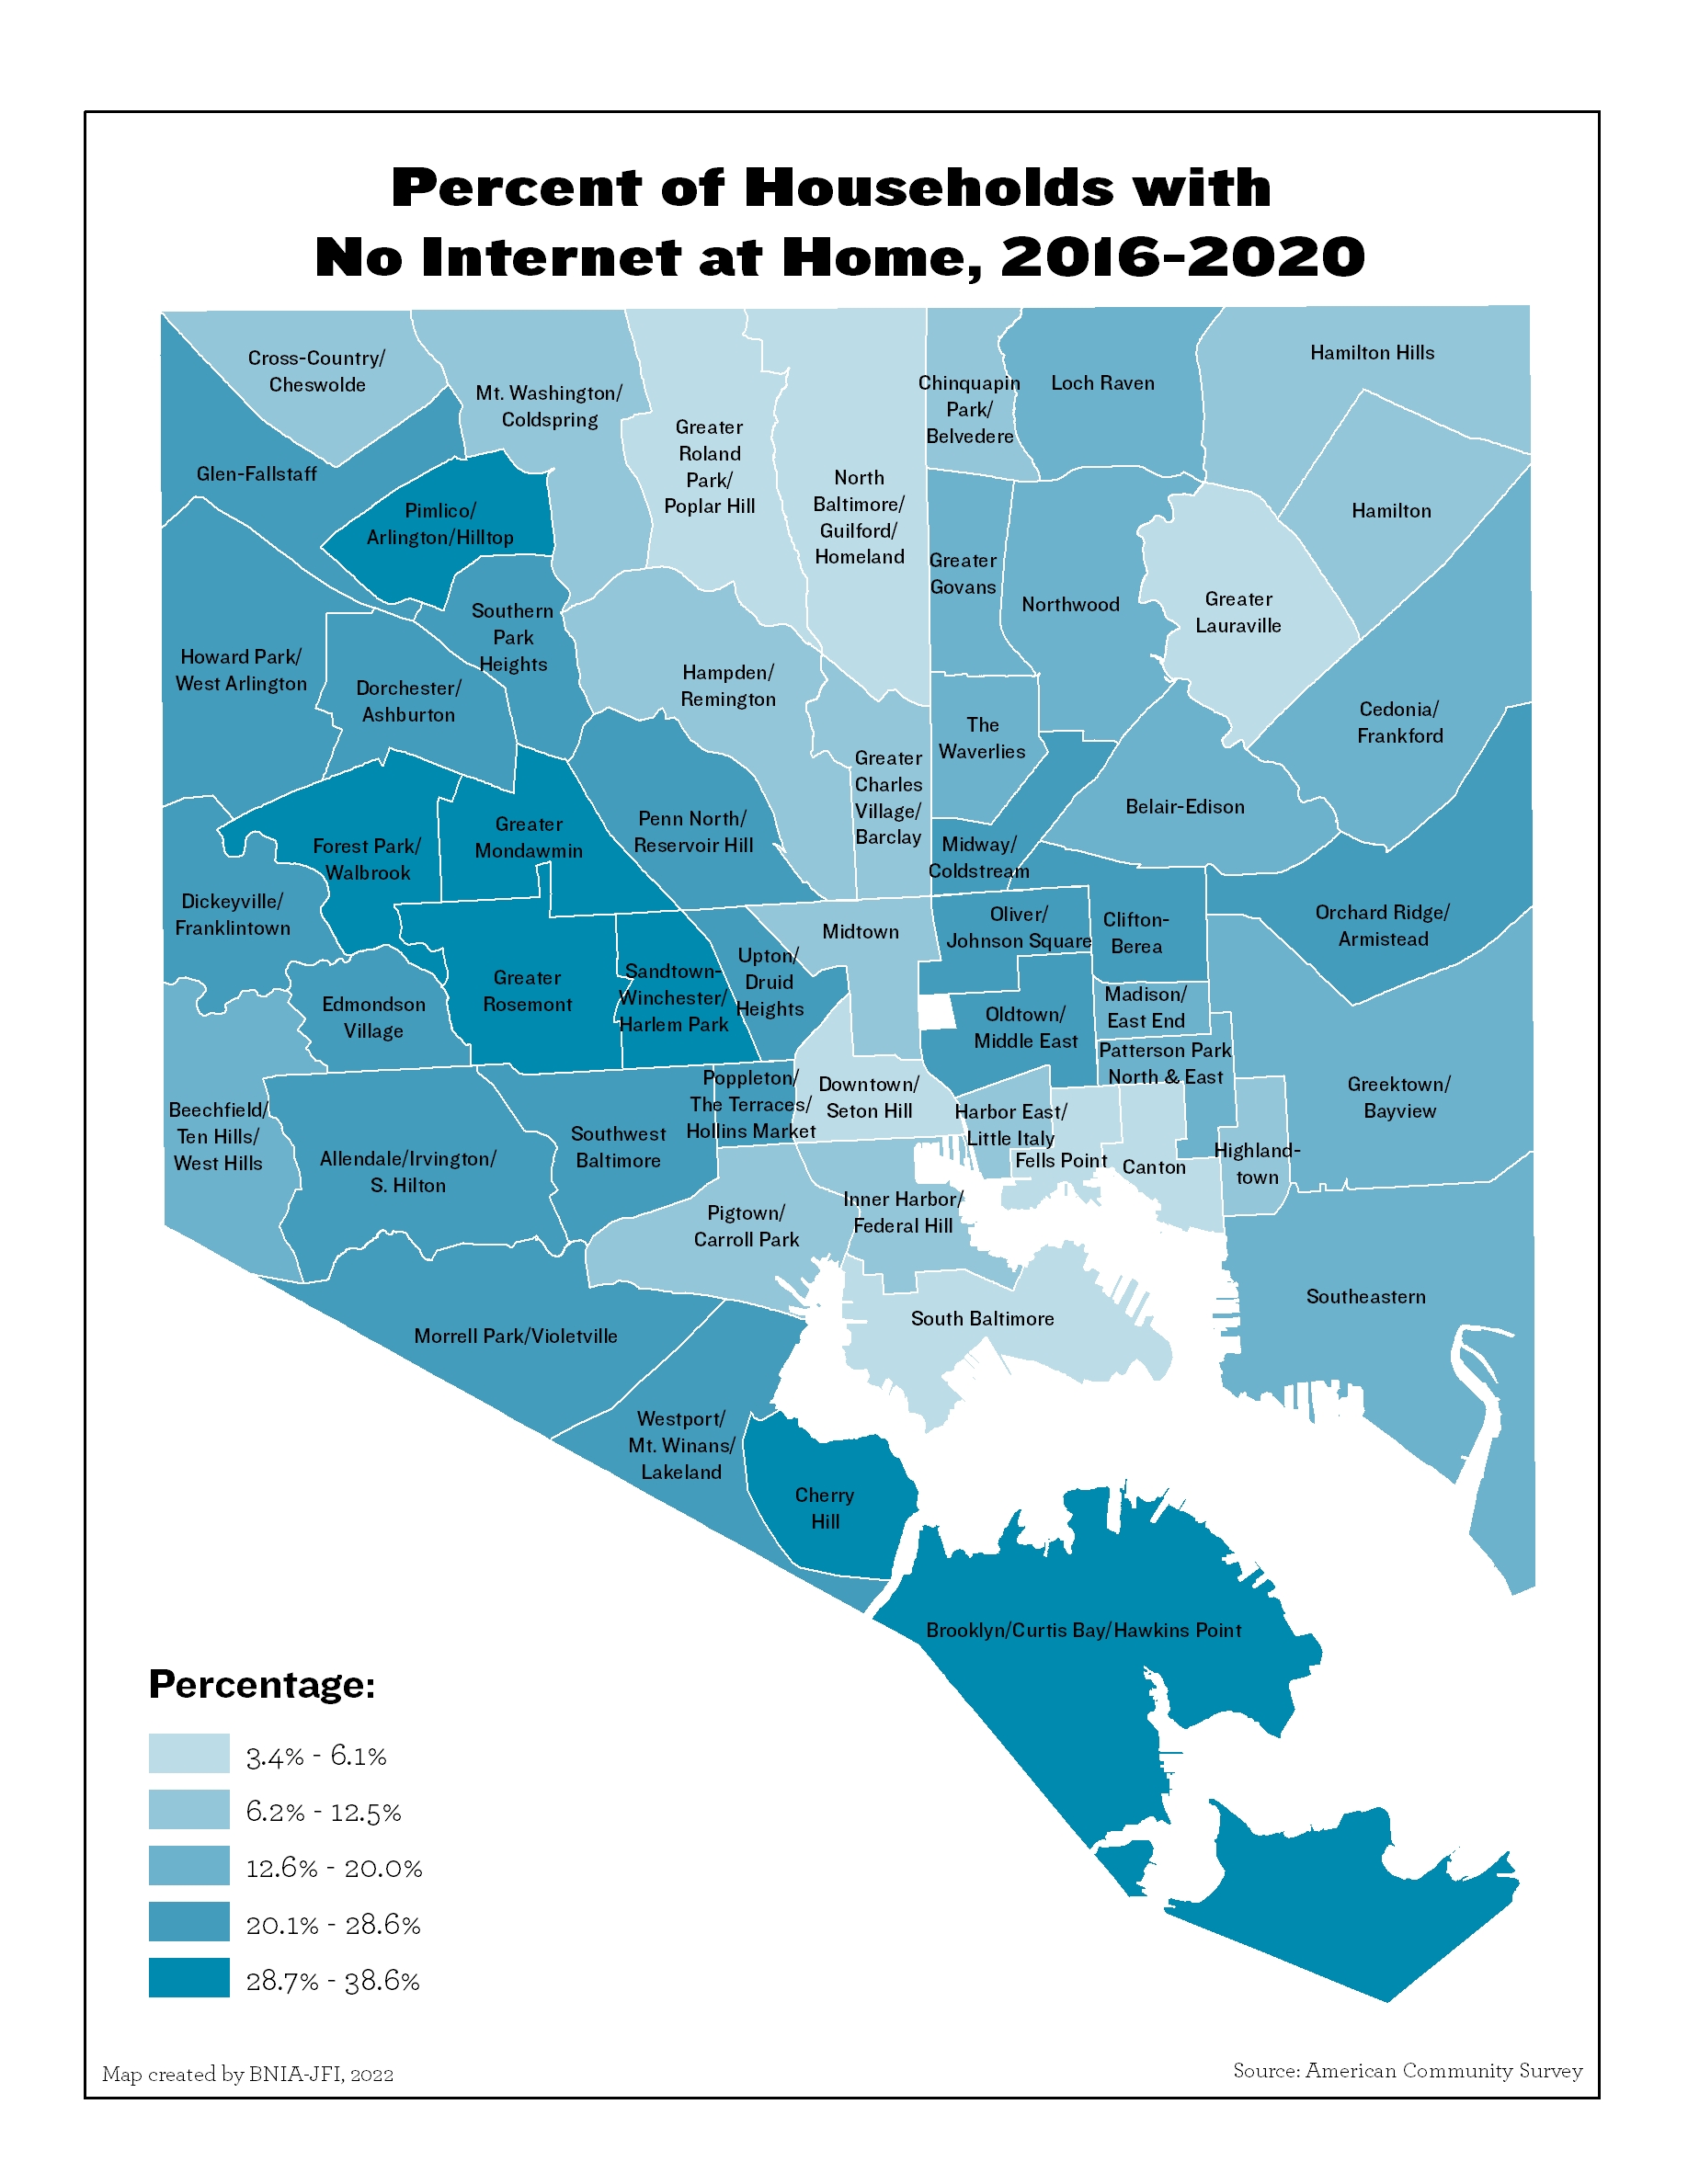
Percent of Households with No Internet at Home (2020)
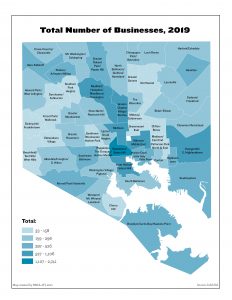
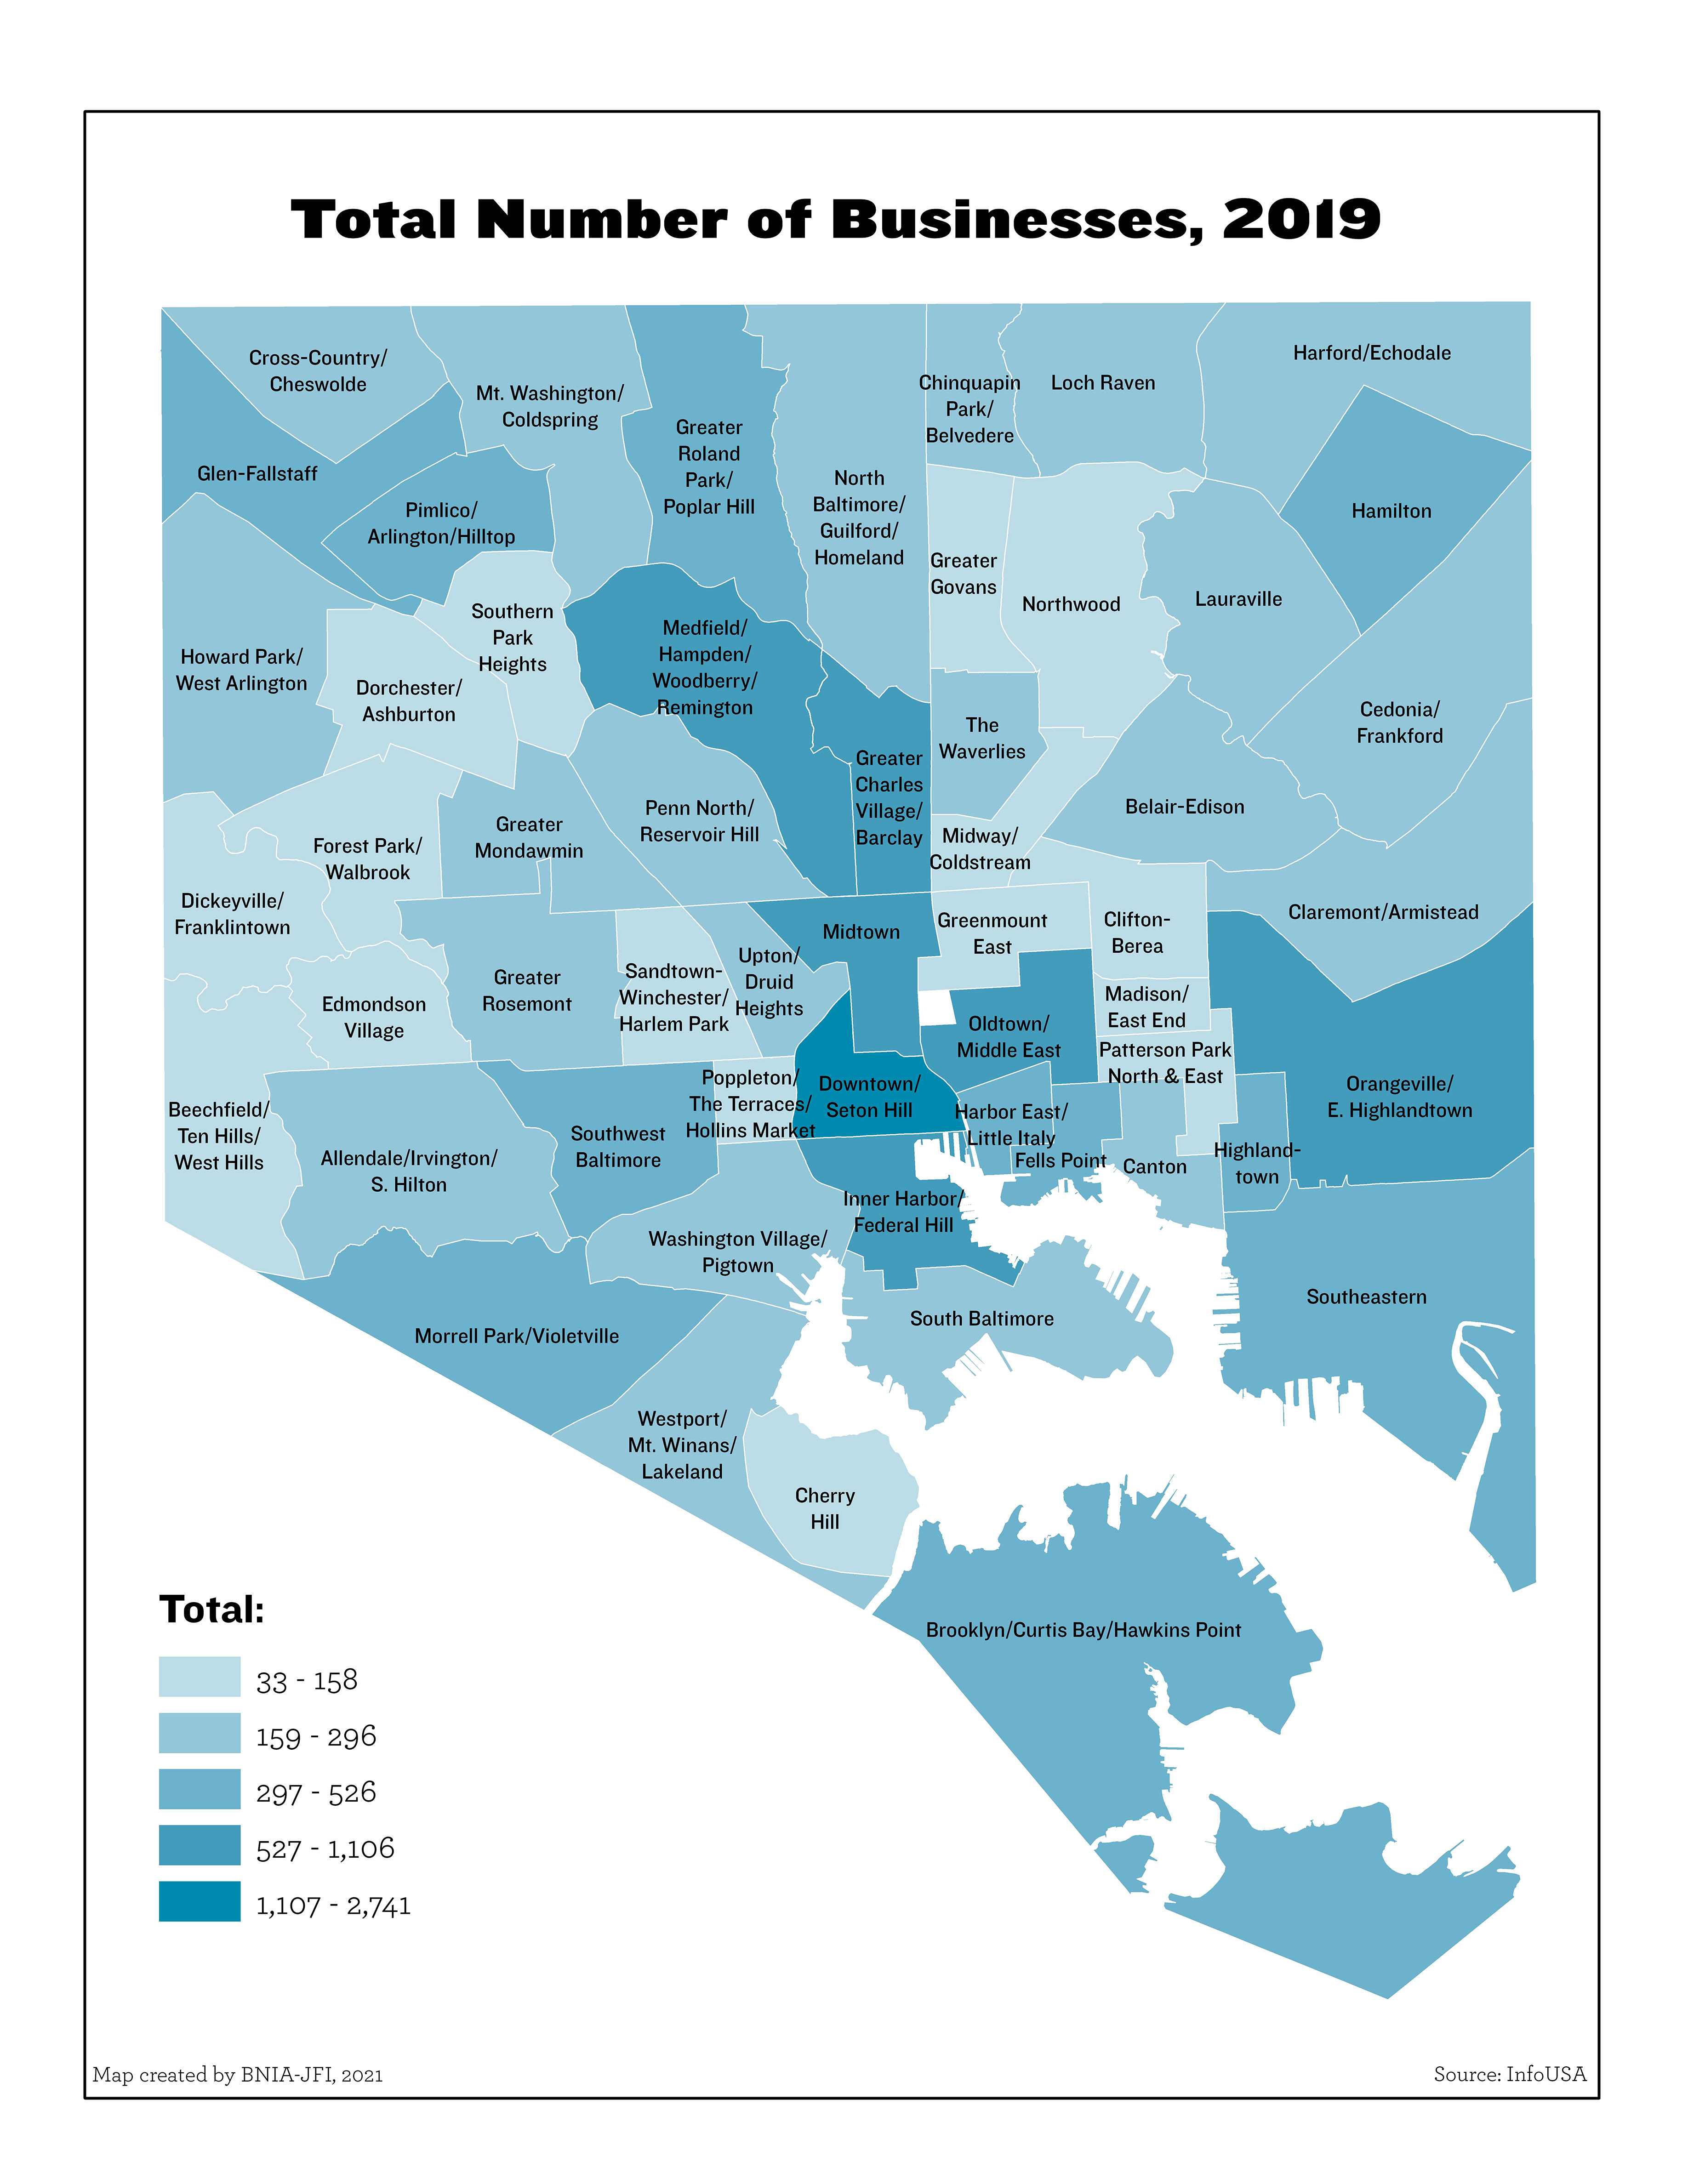
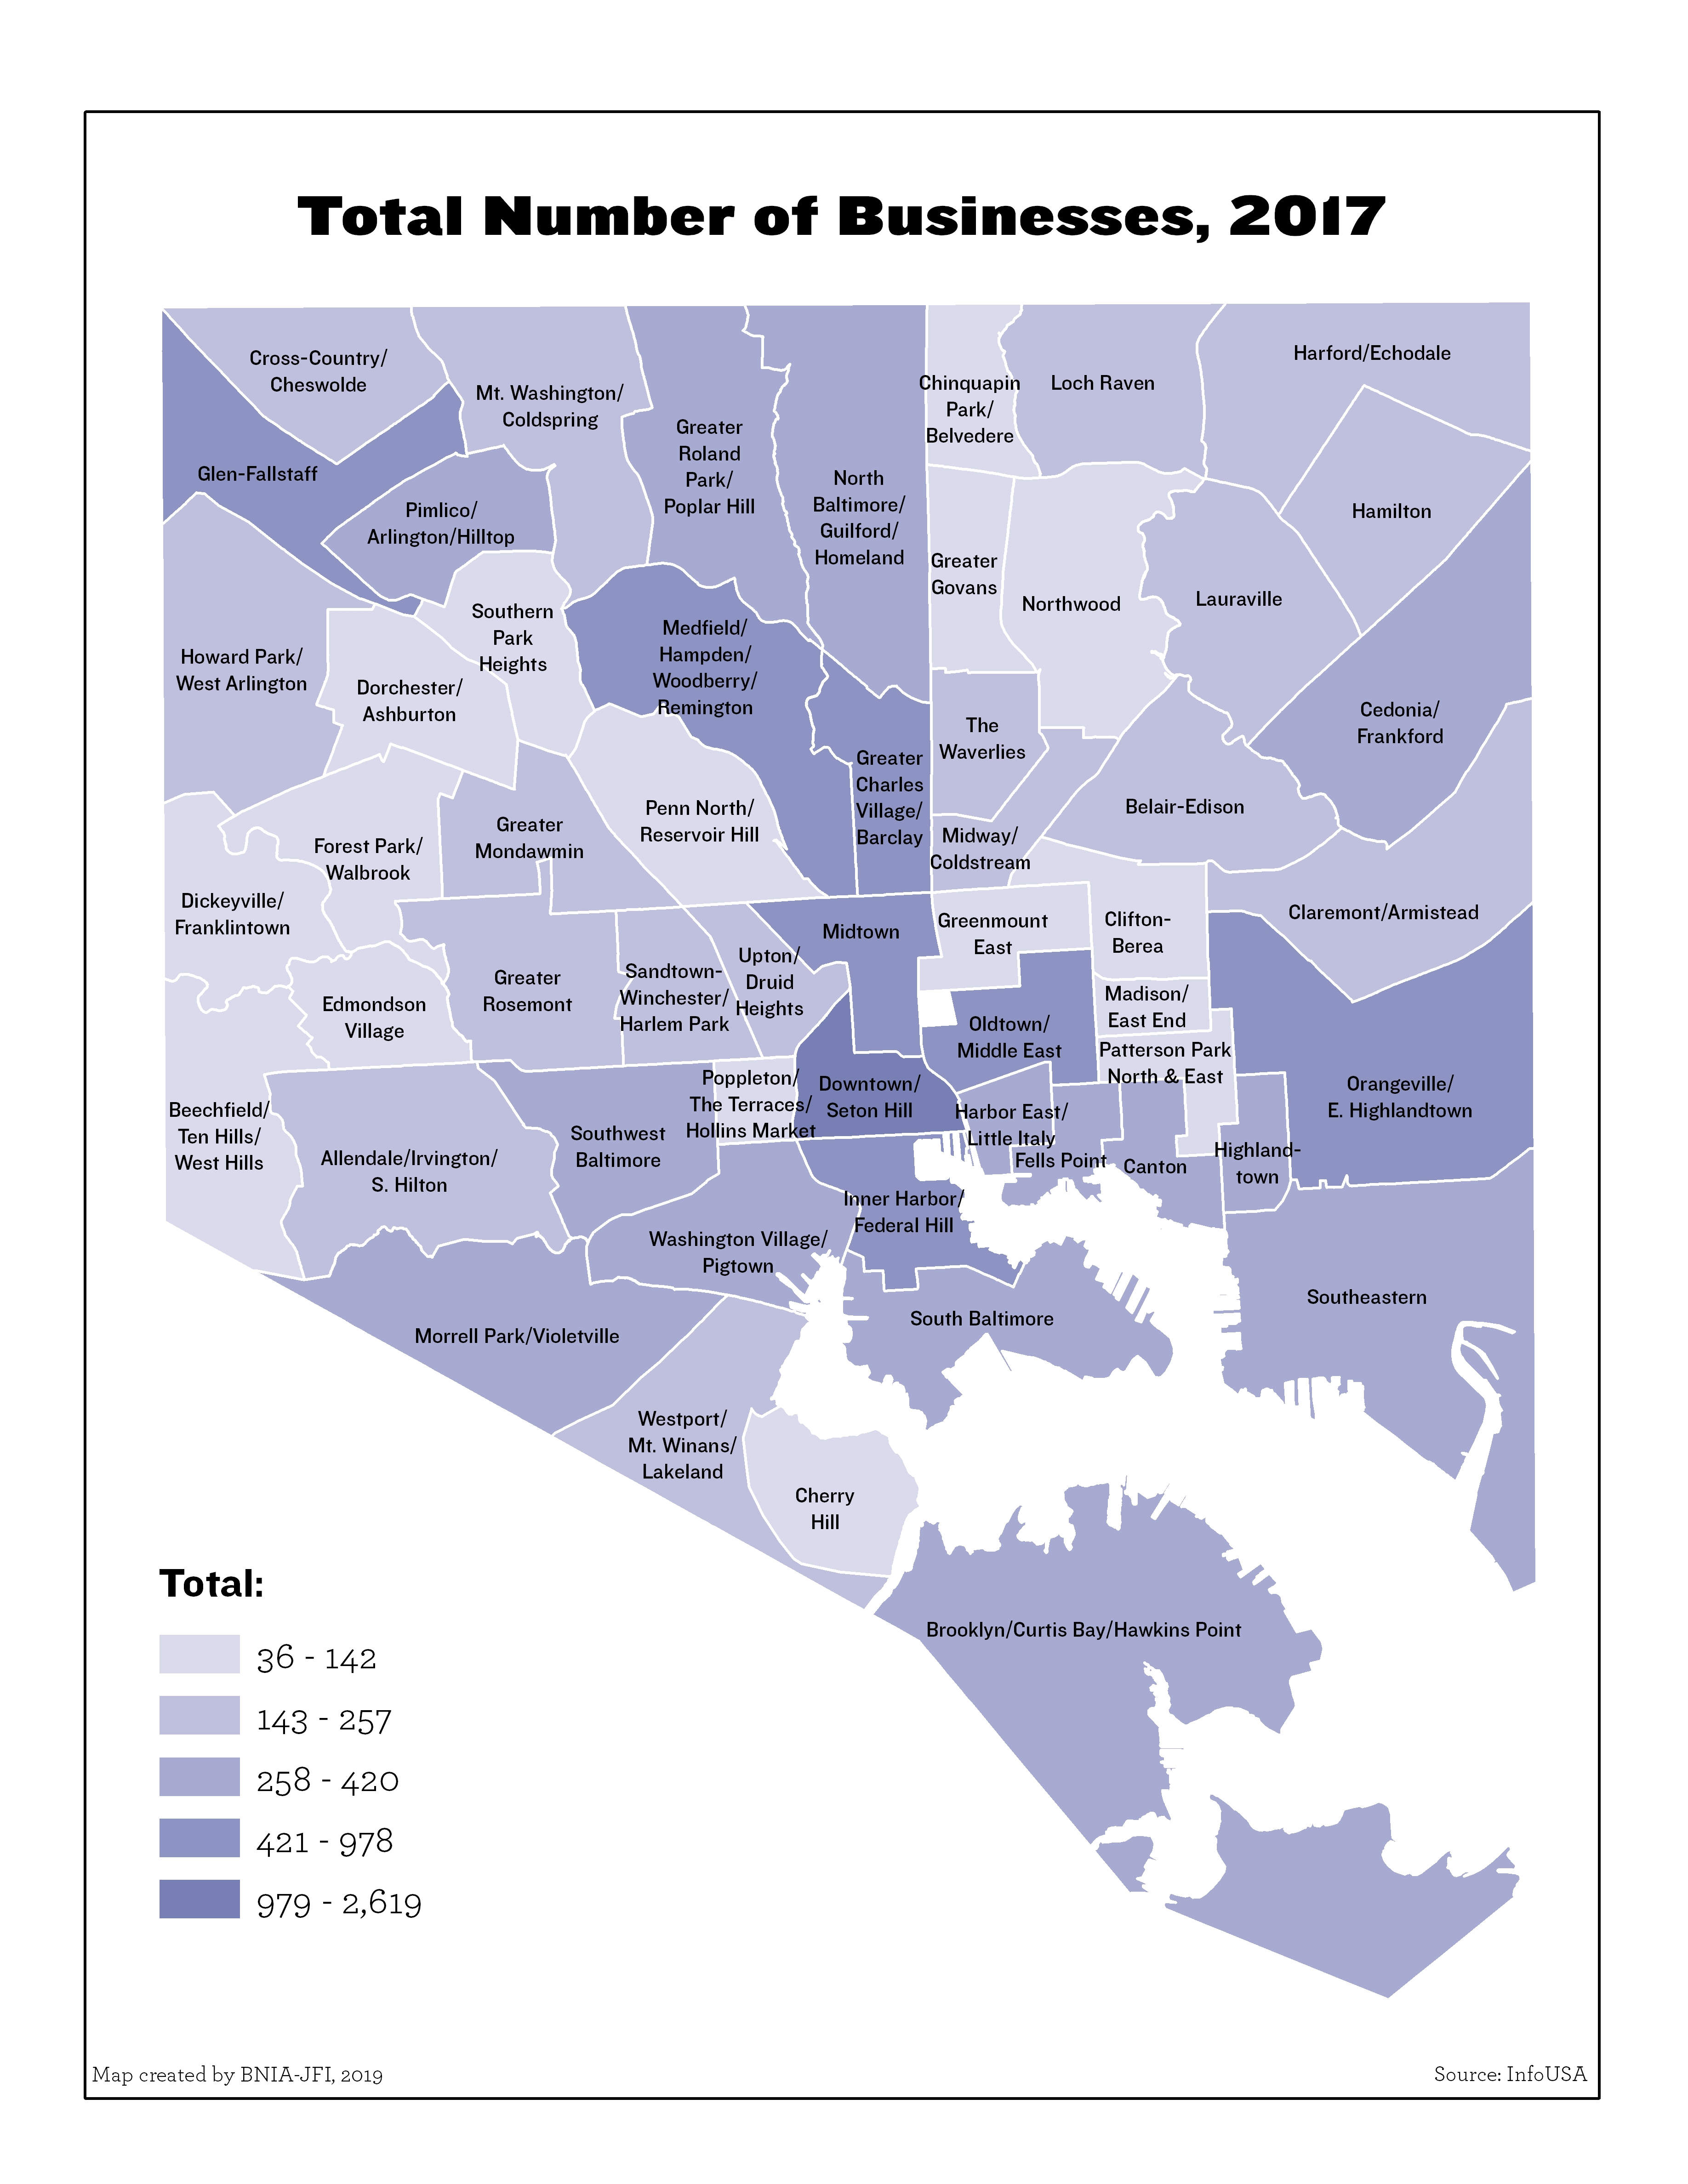
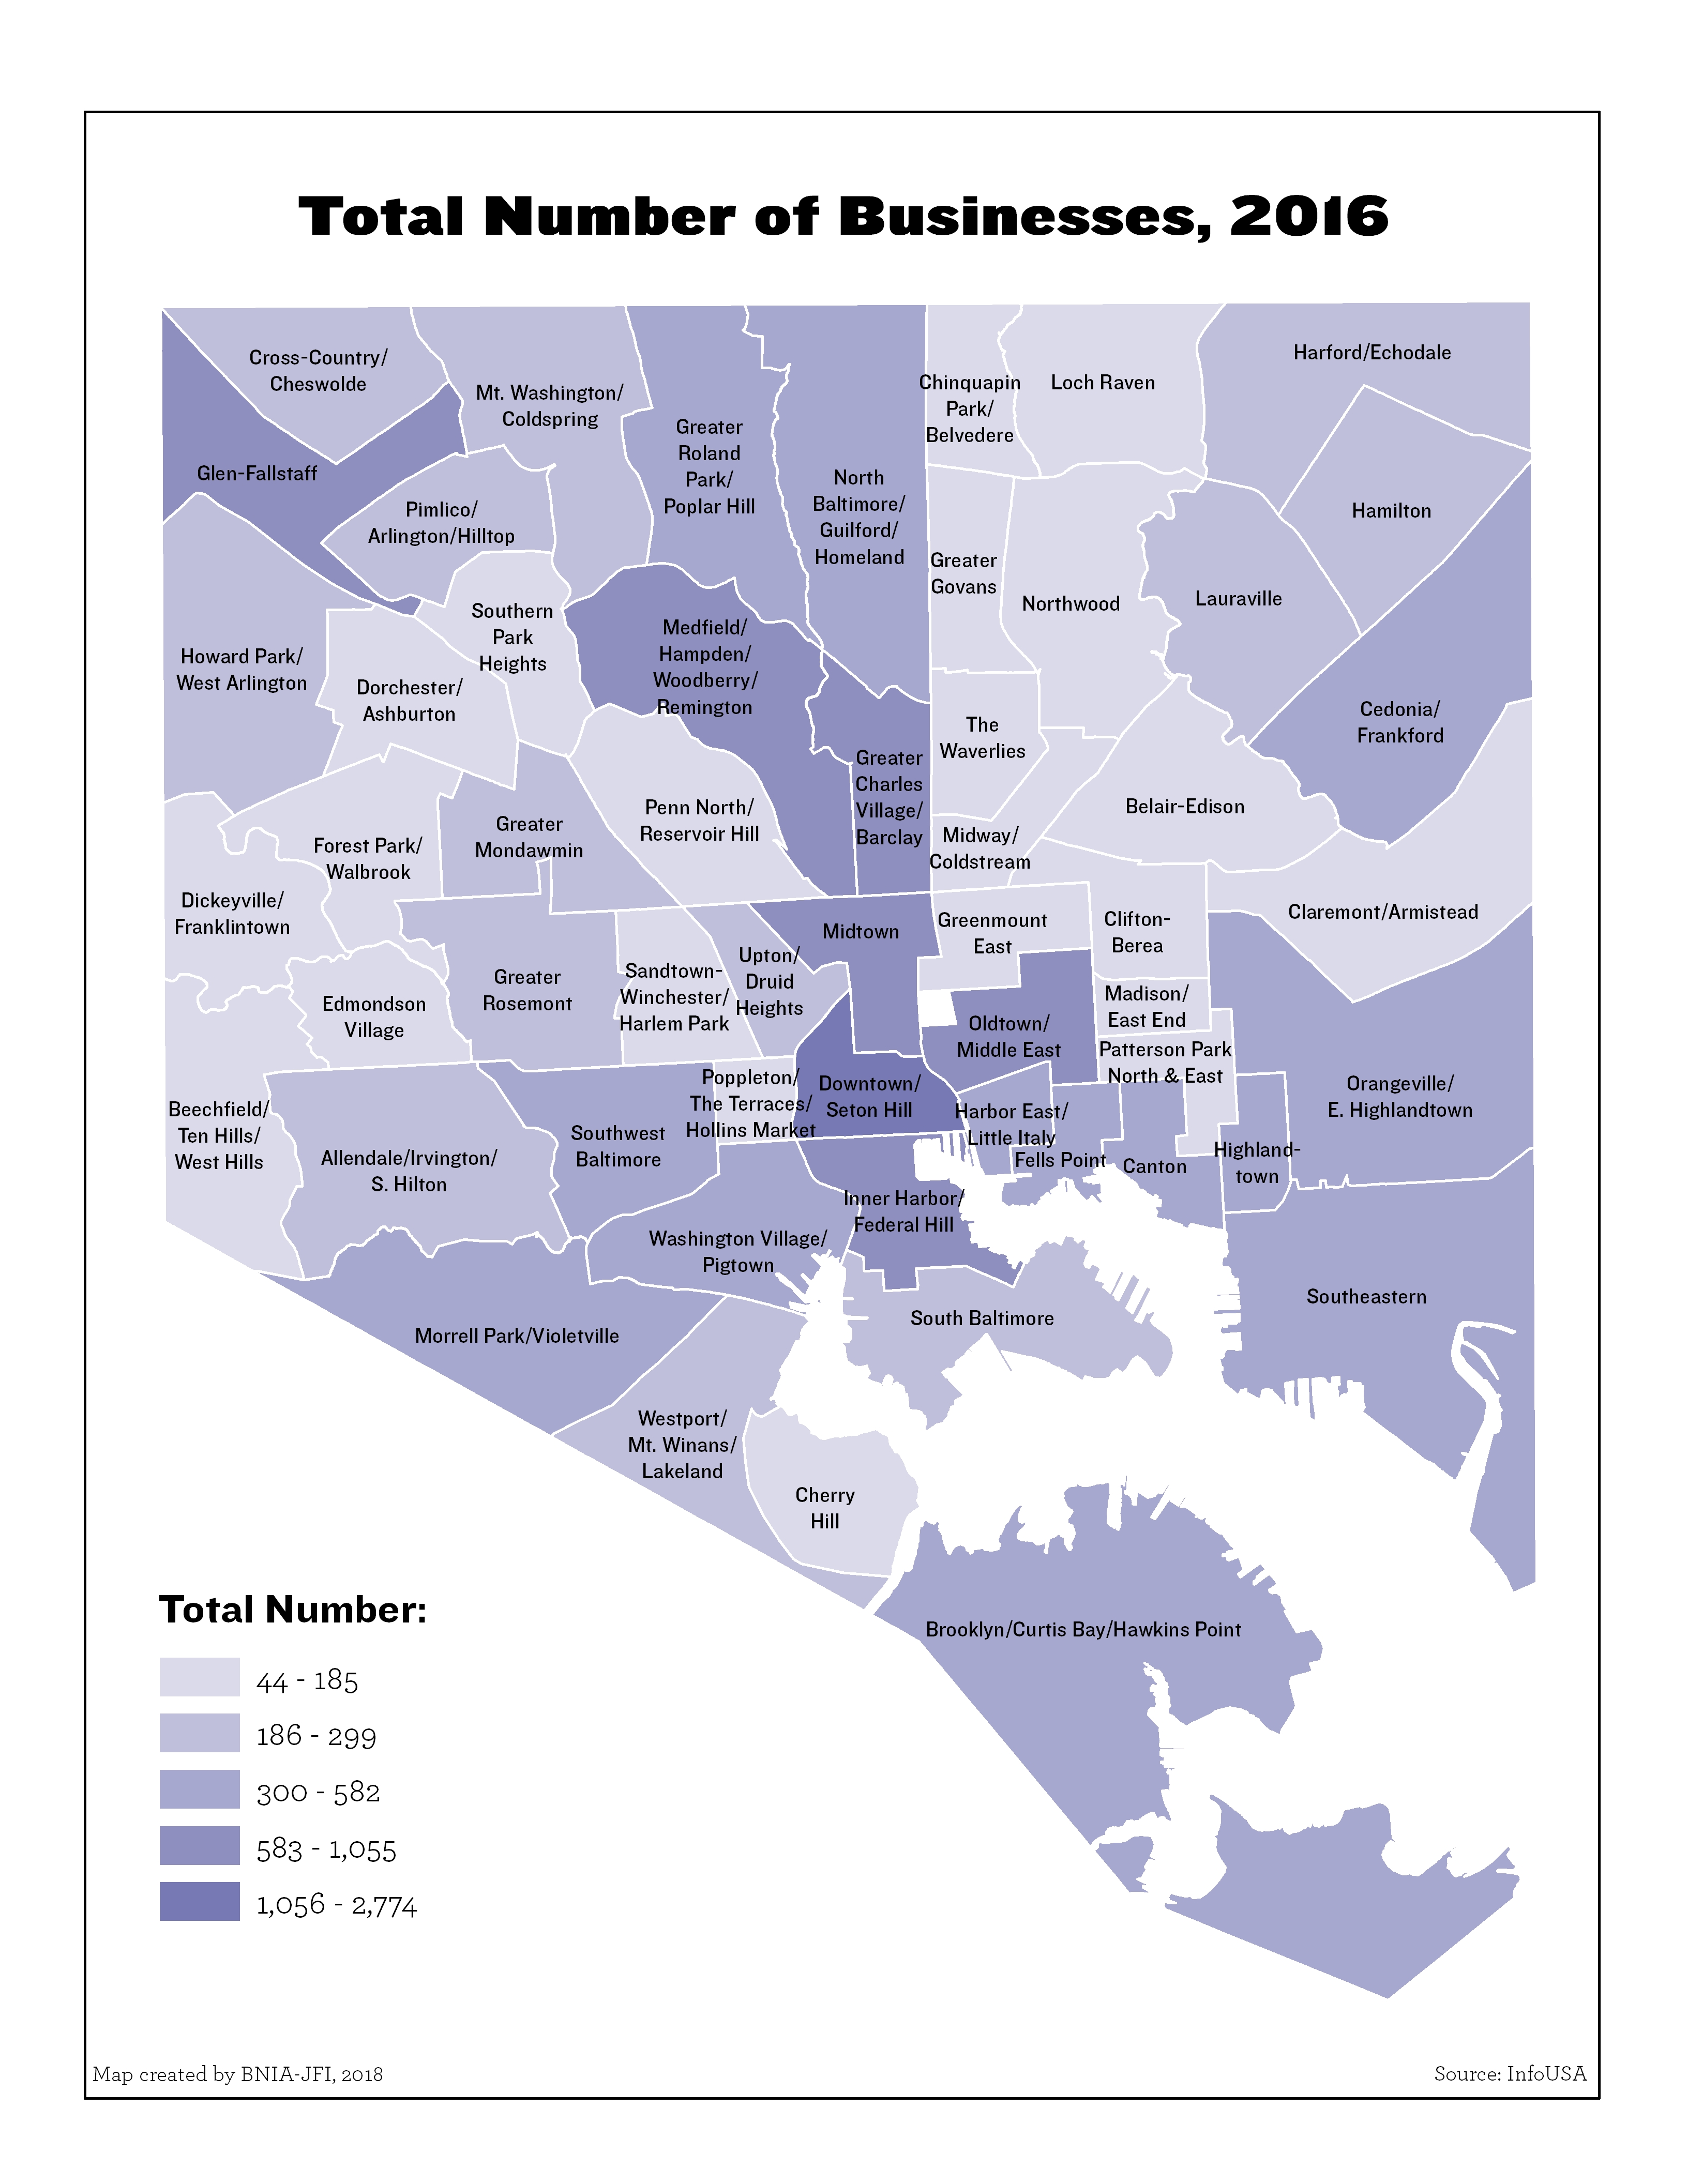
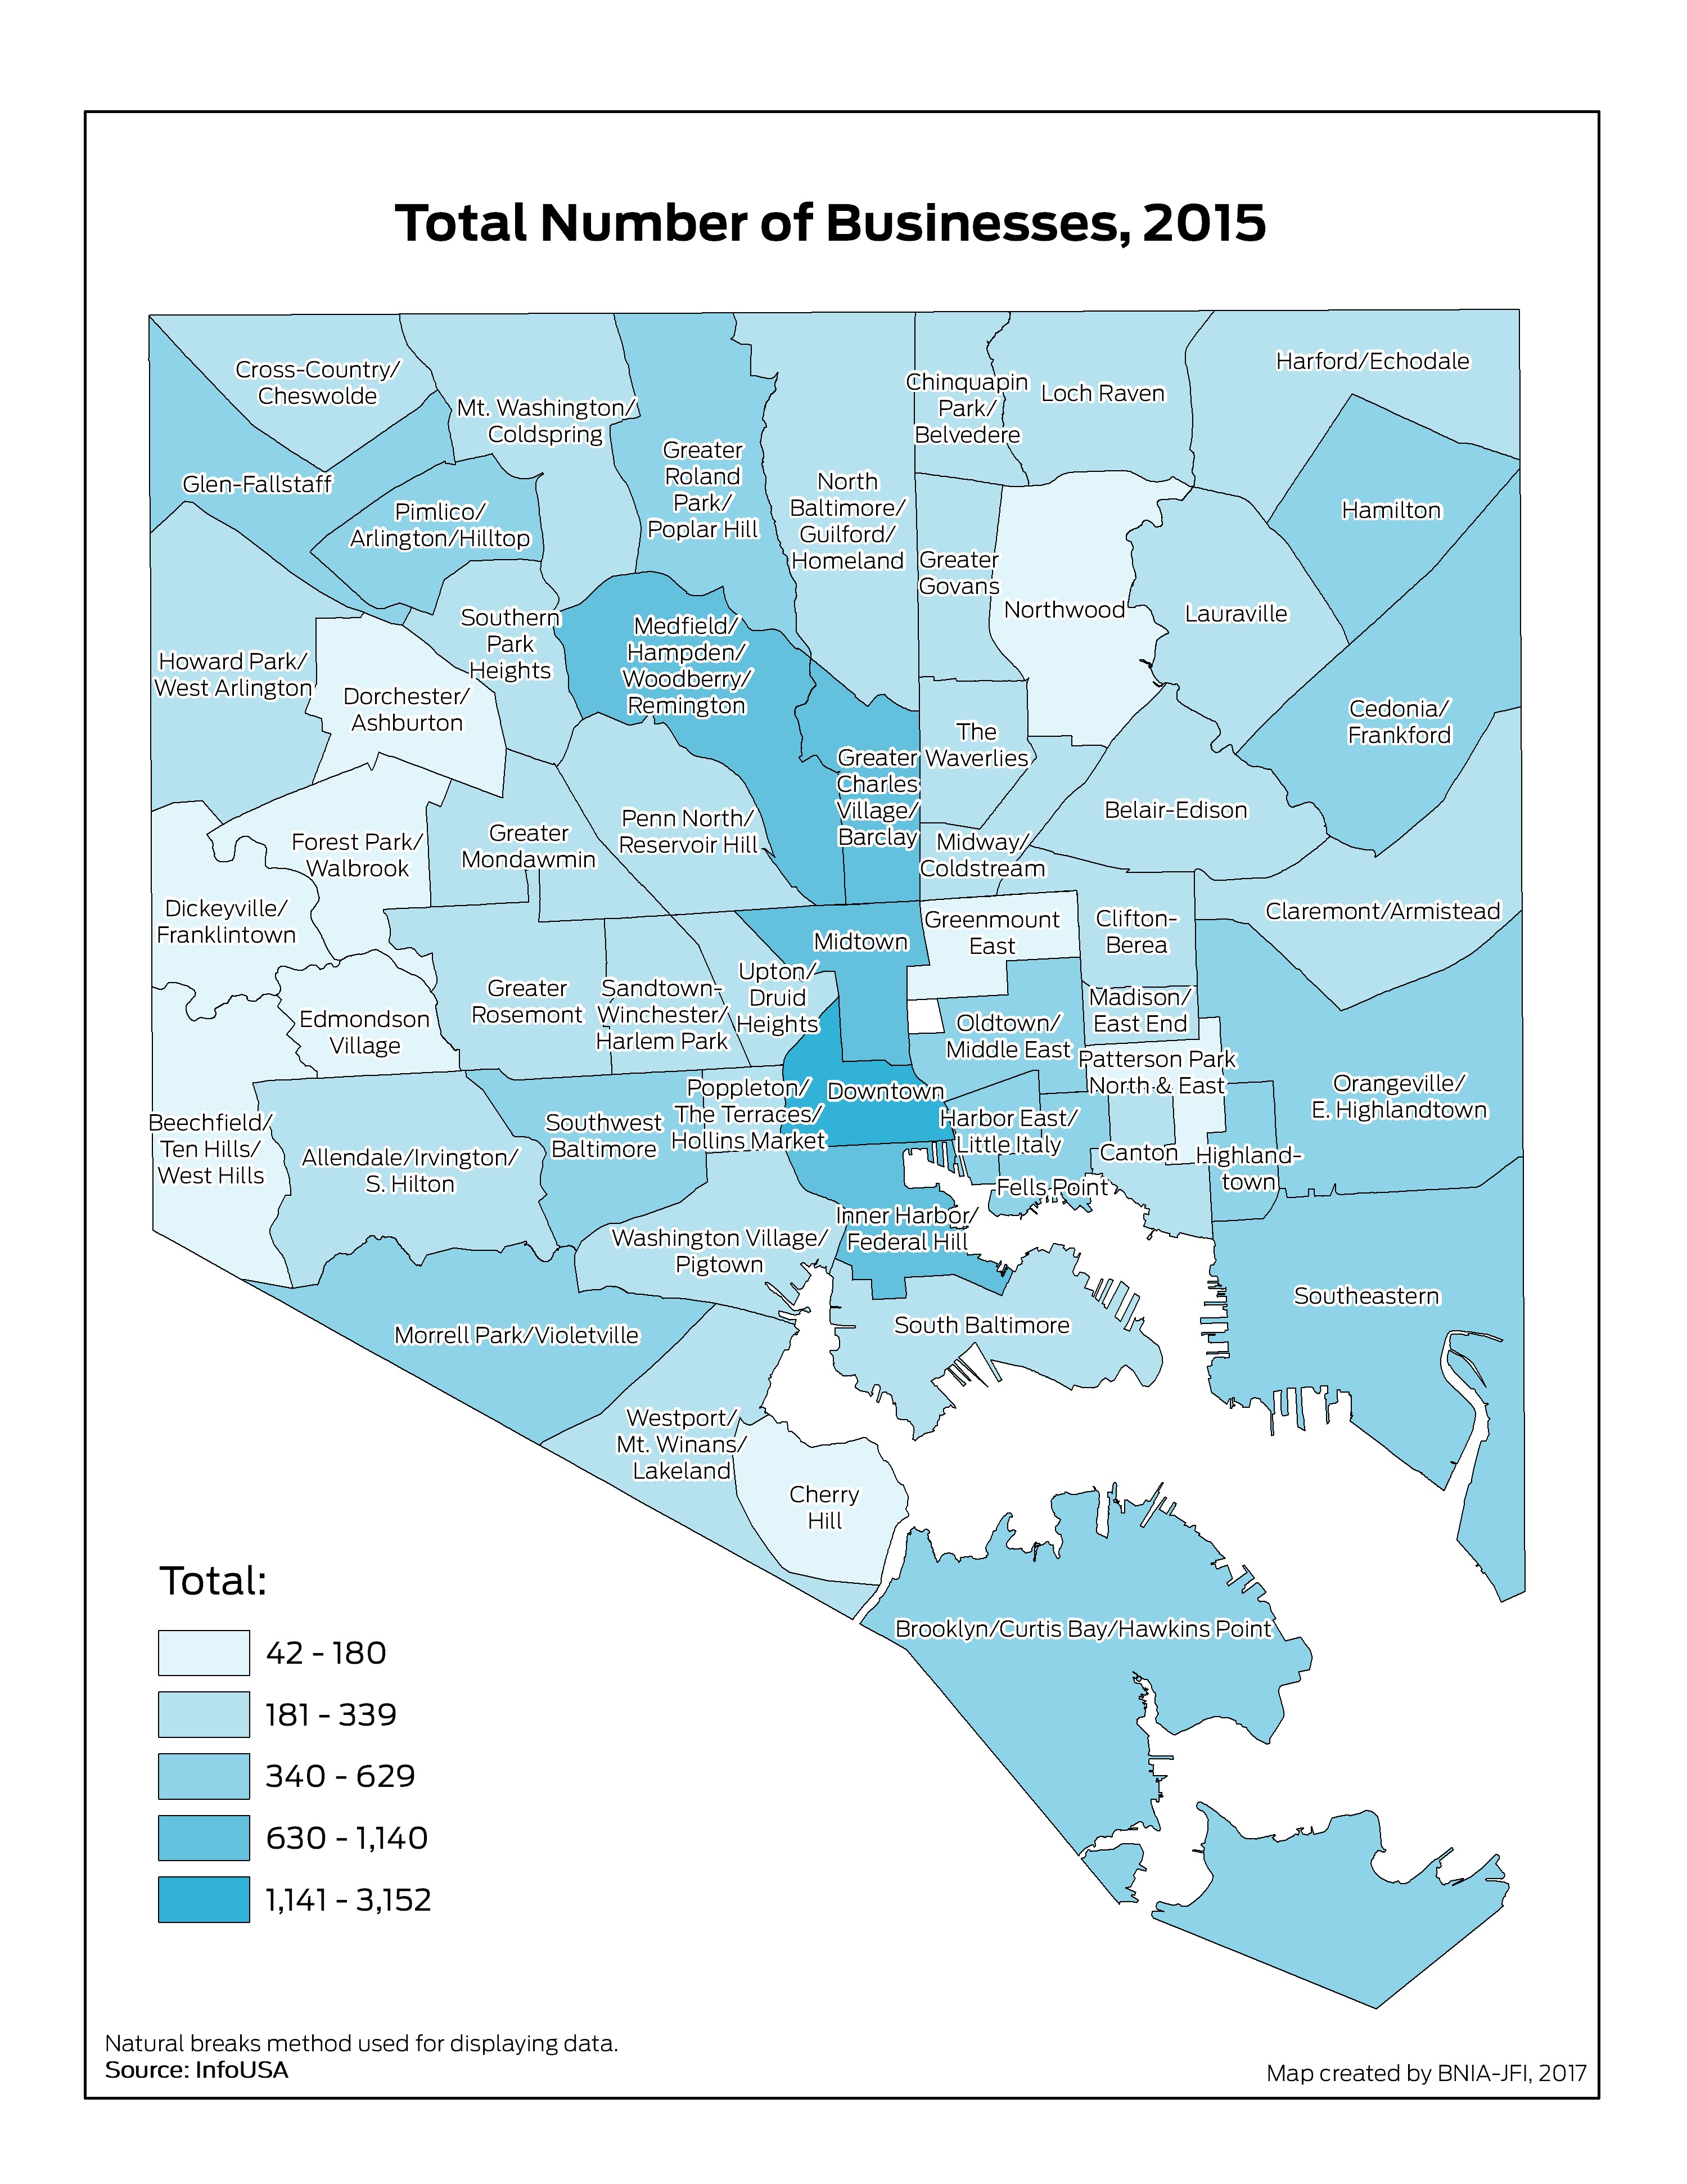
Total Number of Businesses
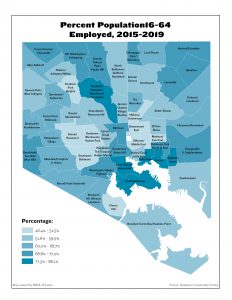
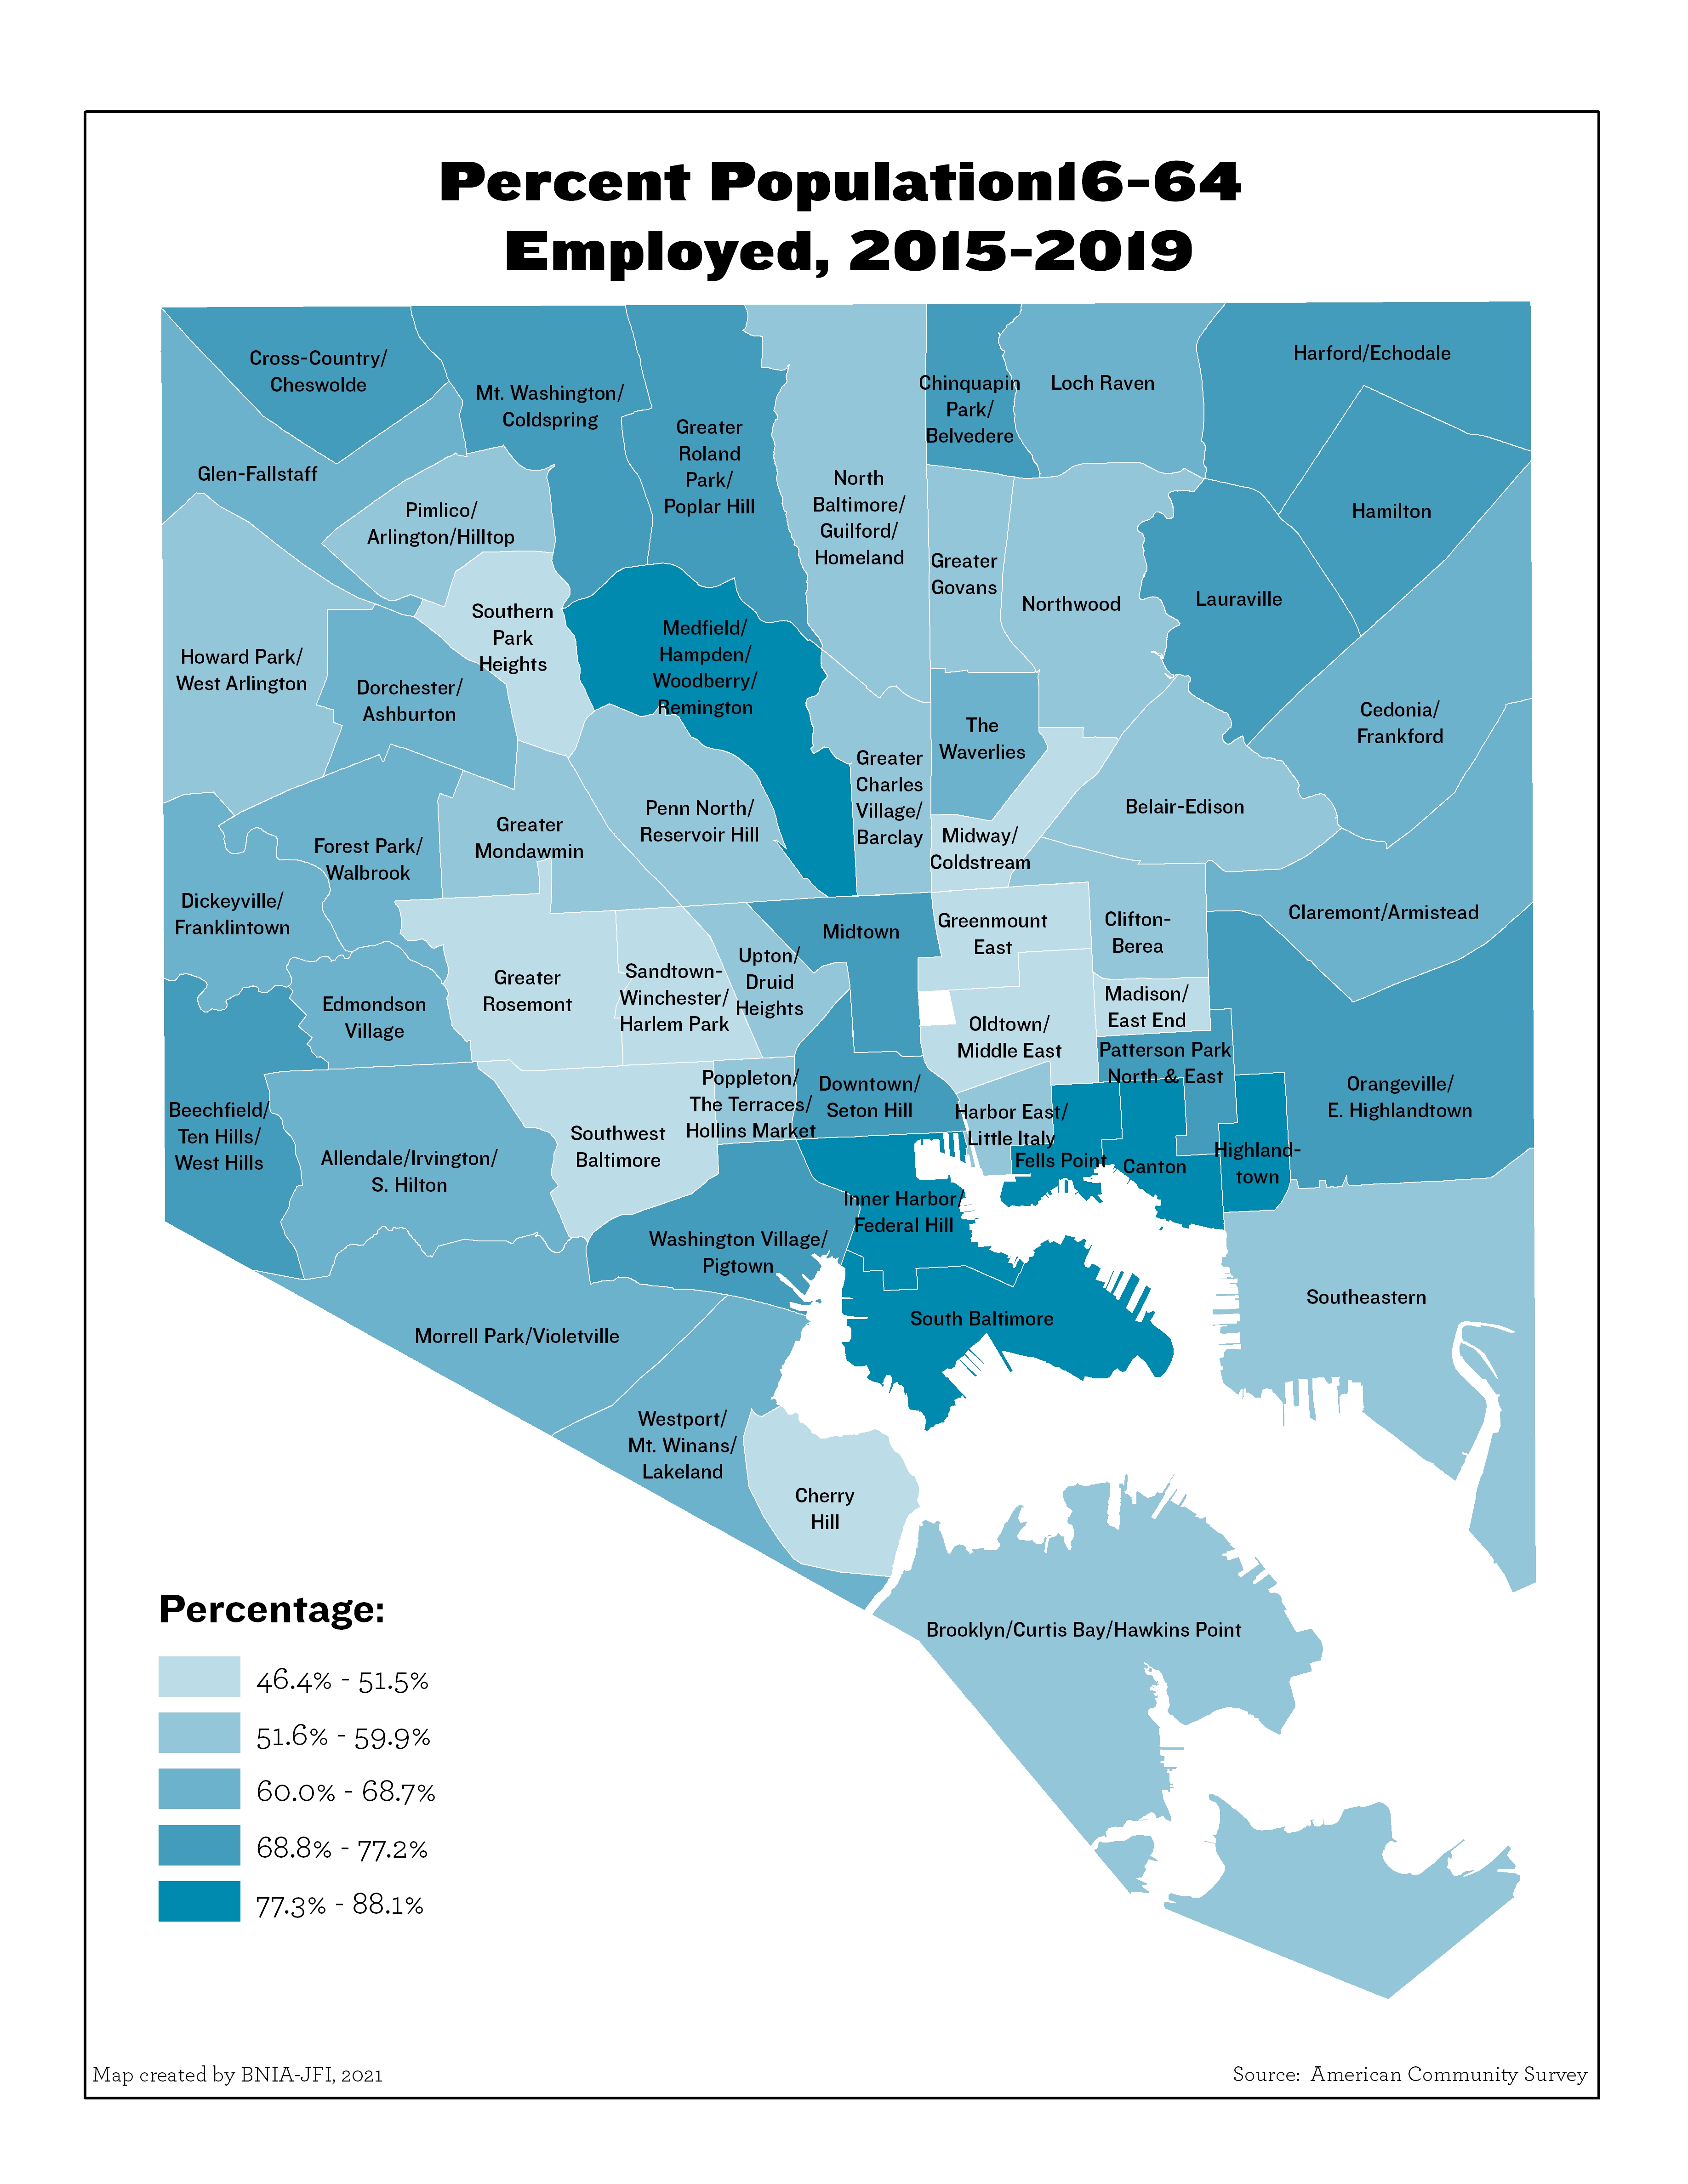
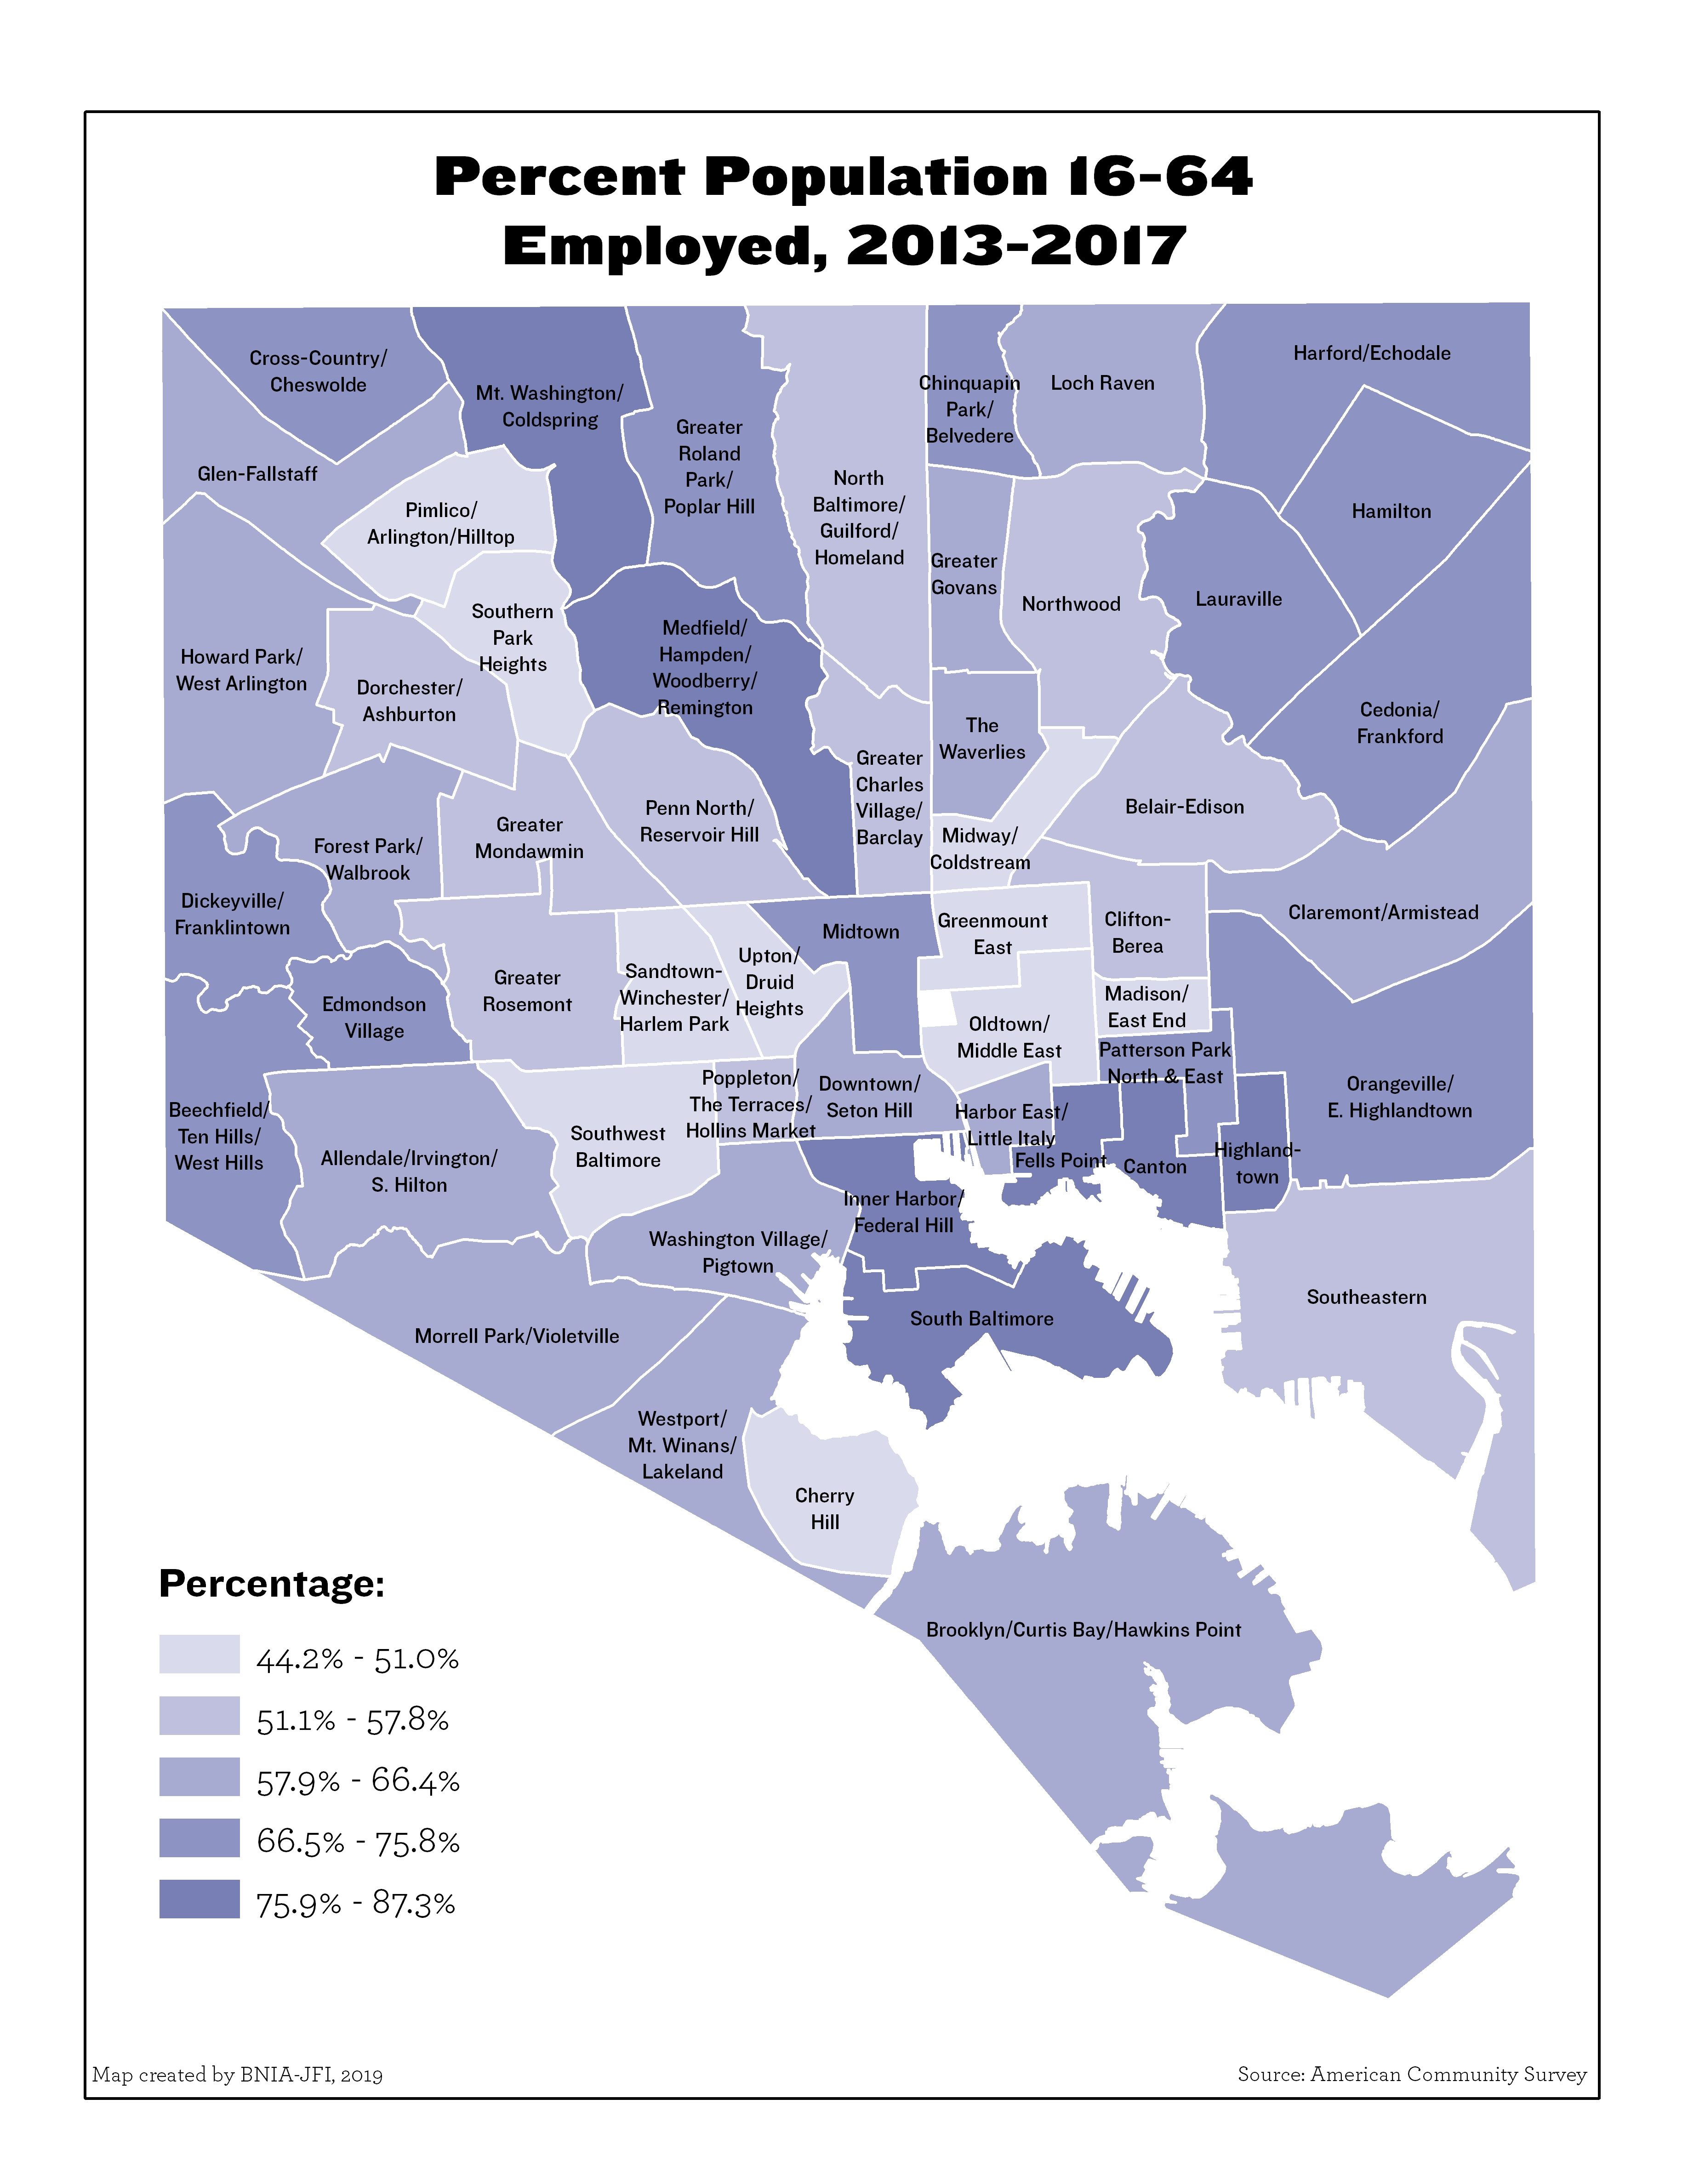
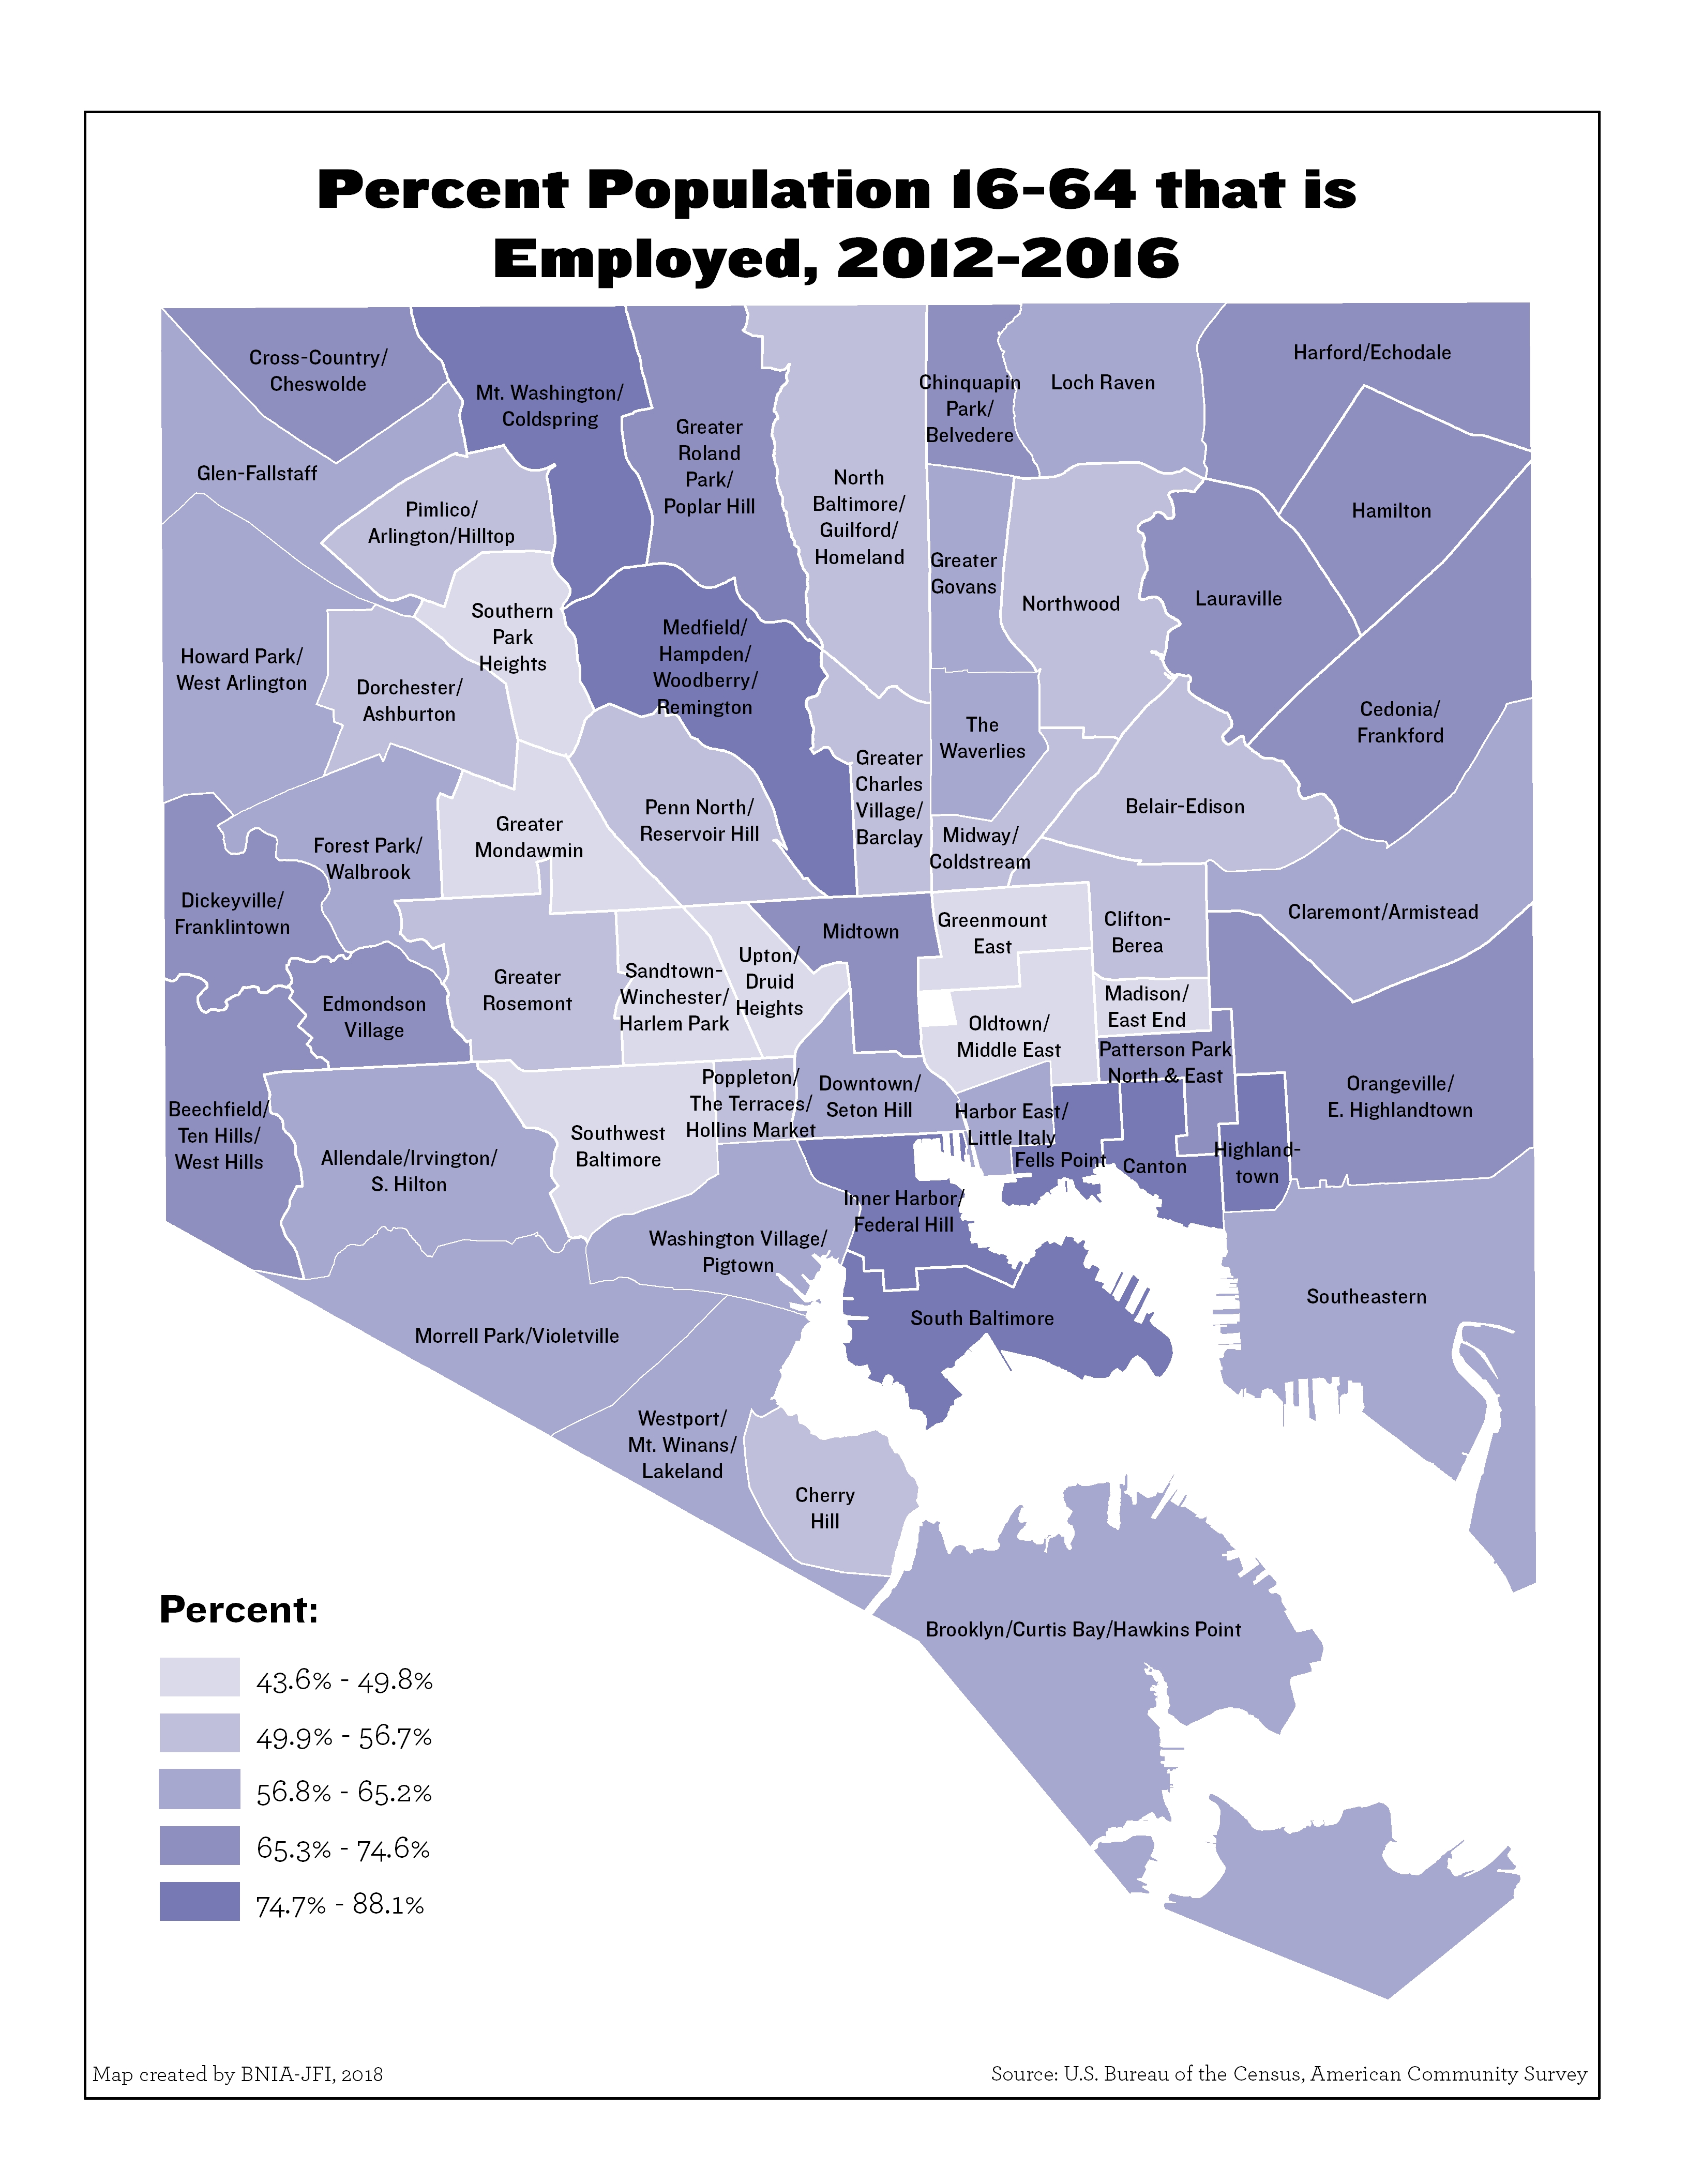
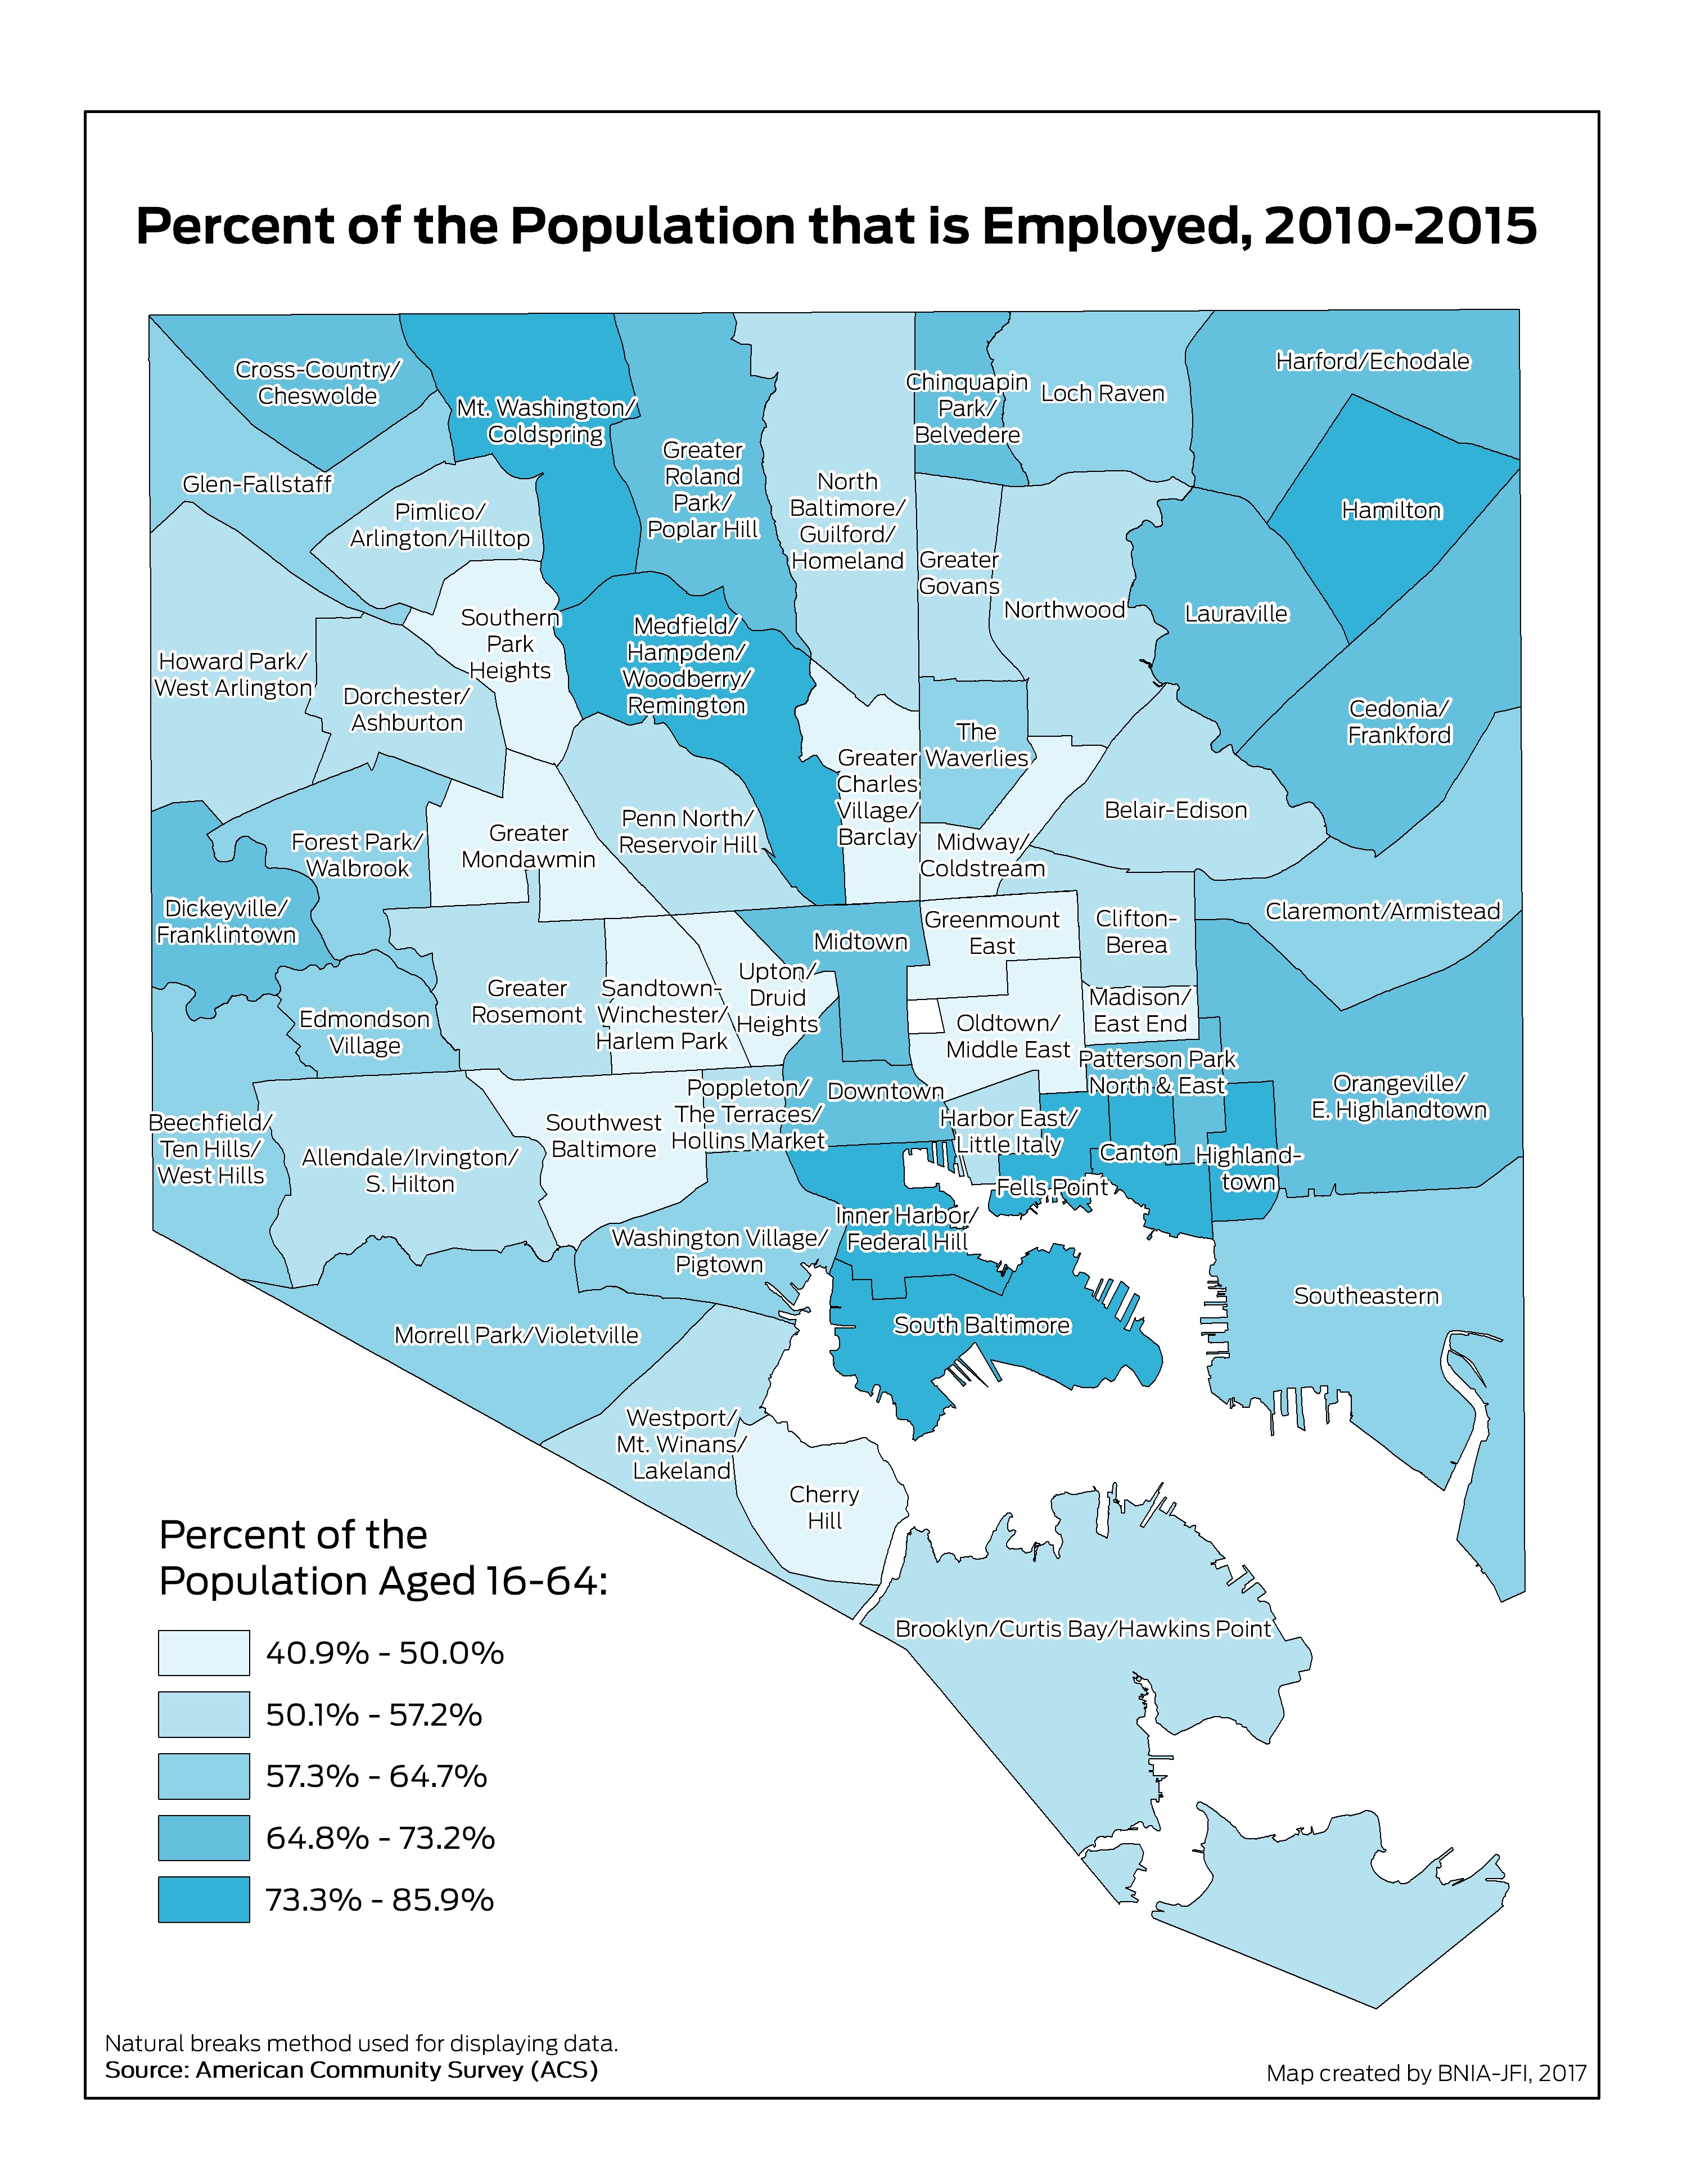
Percent Population 16-64 Employed
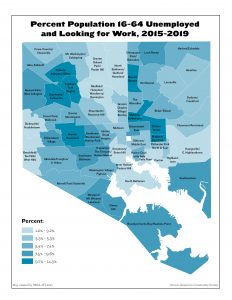
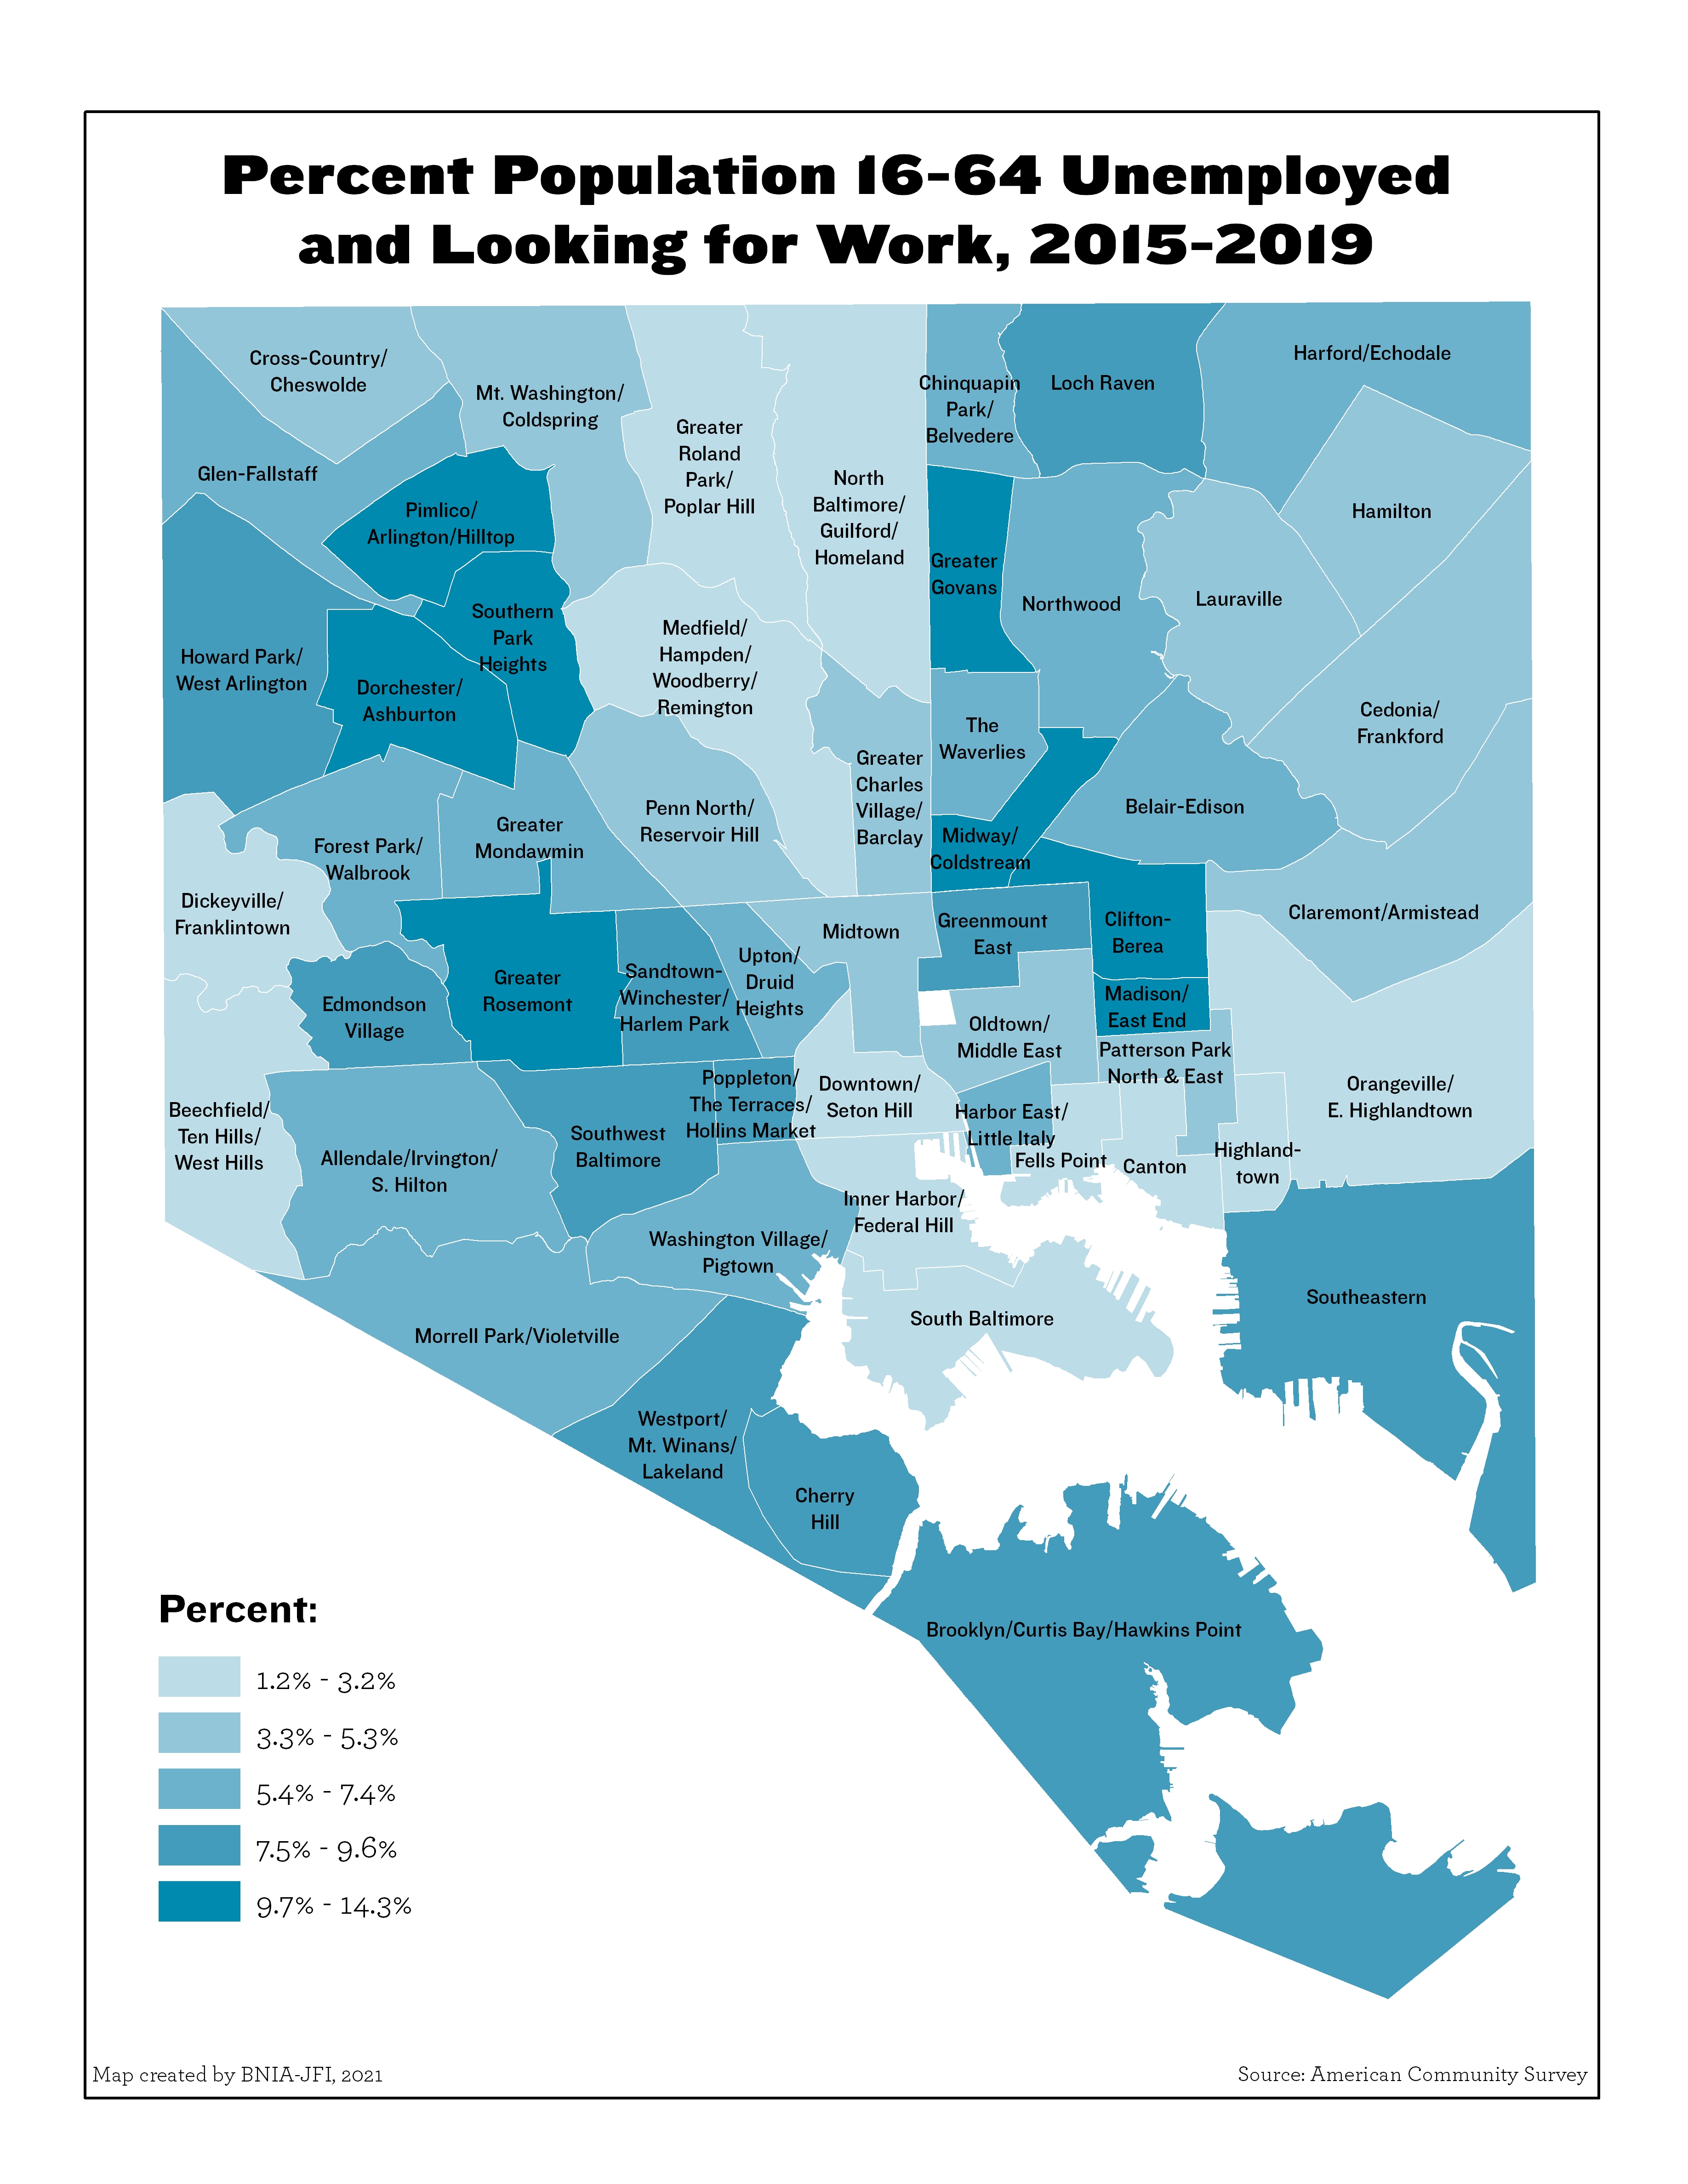
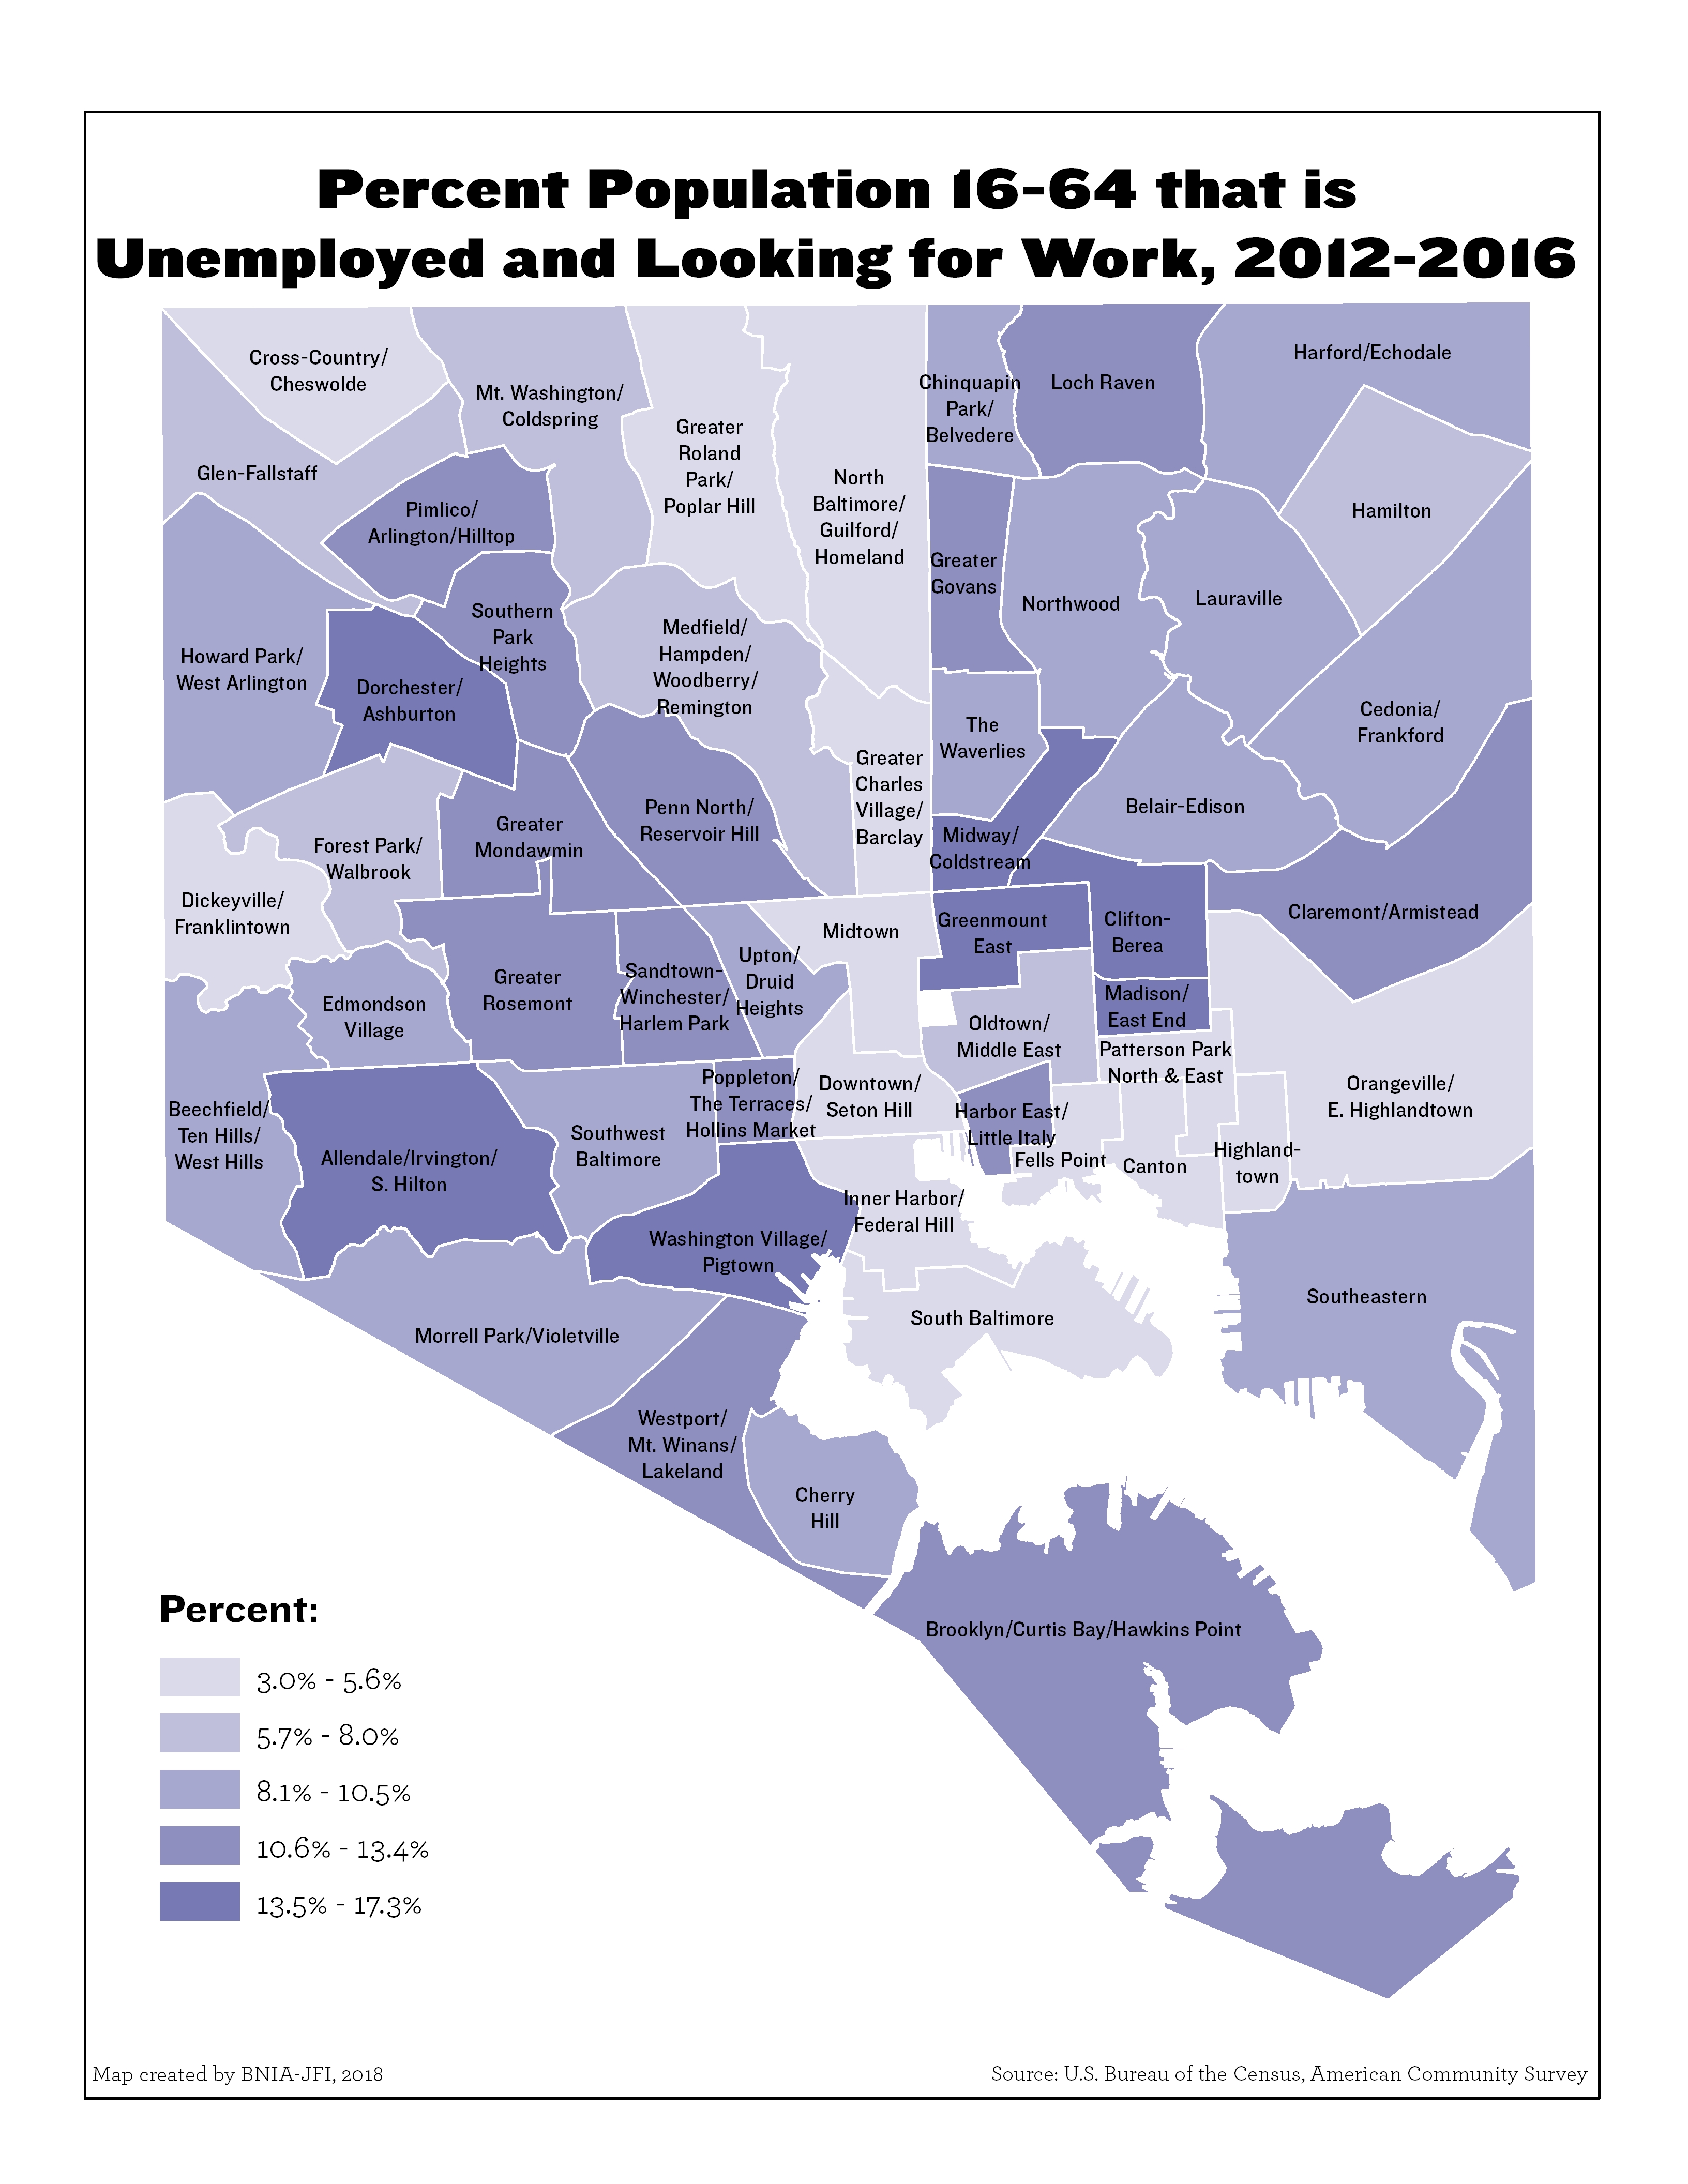
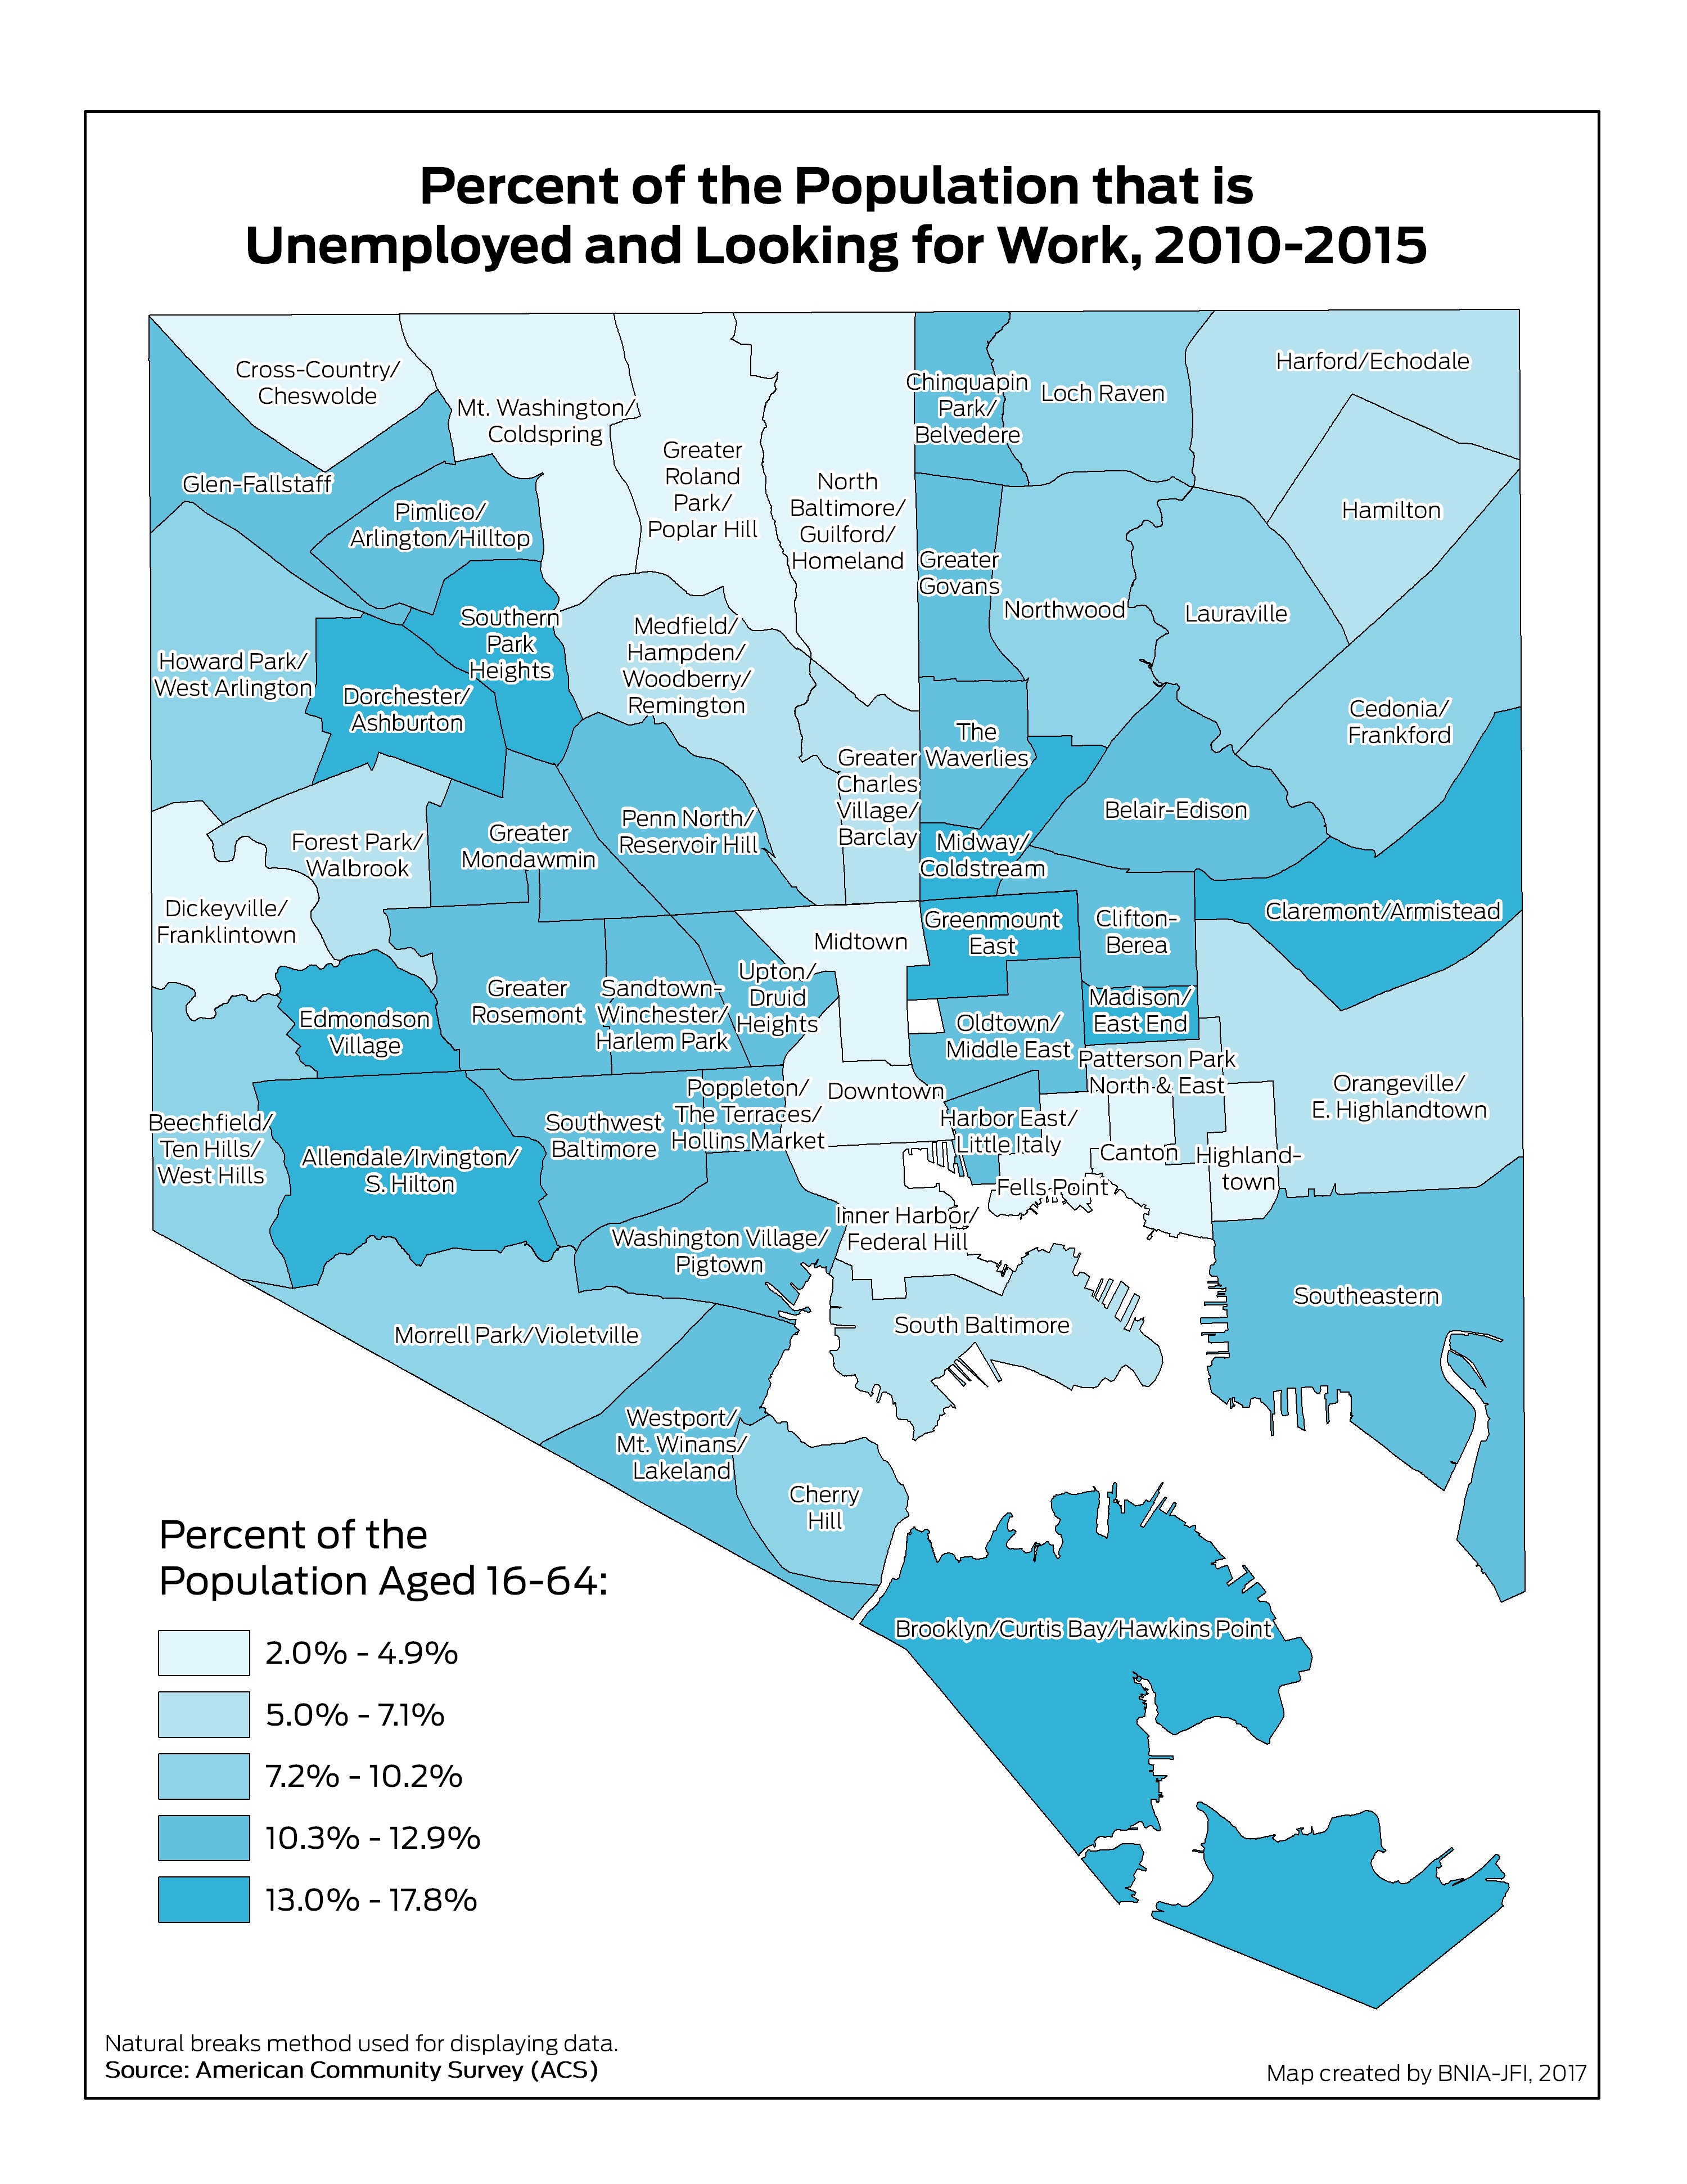
Percent Population 16-64 Unemployed and Looking for Work
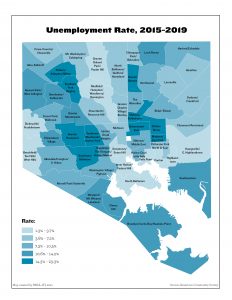
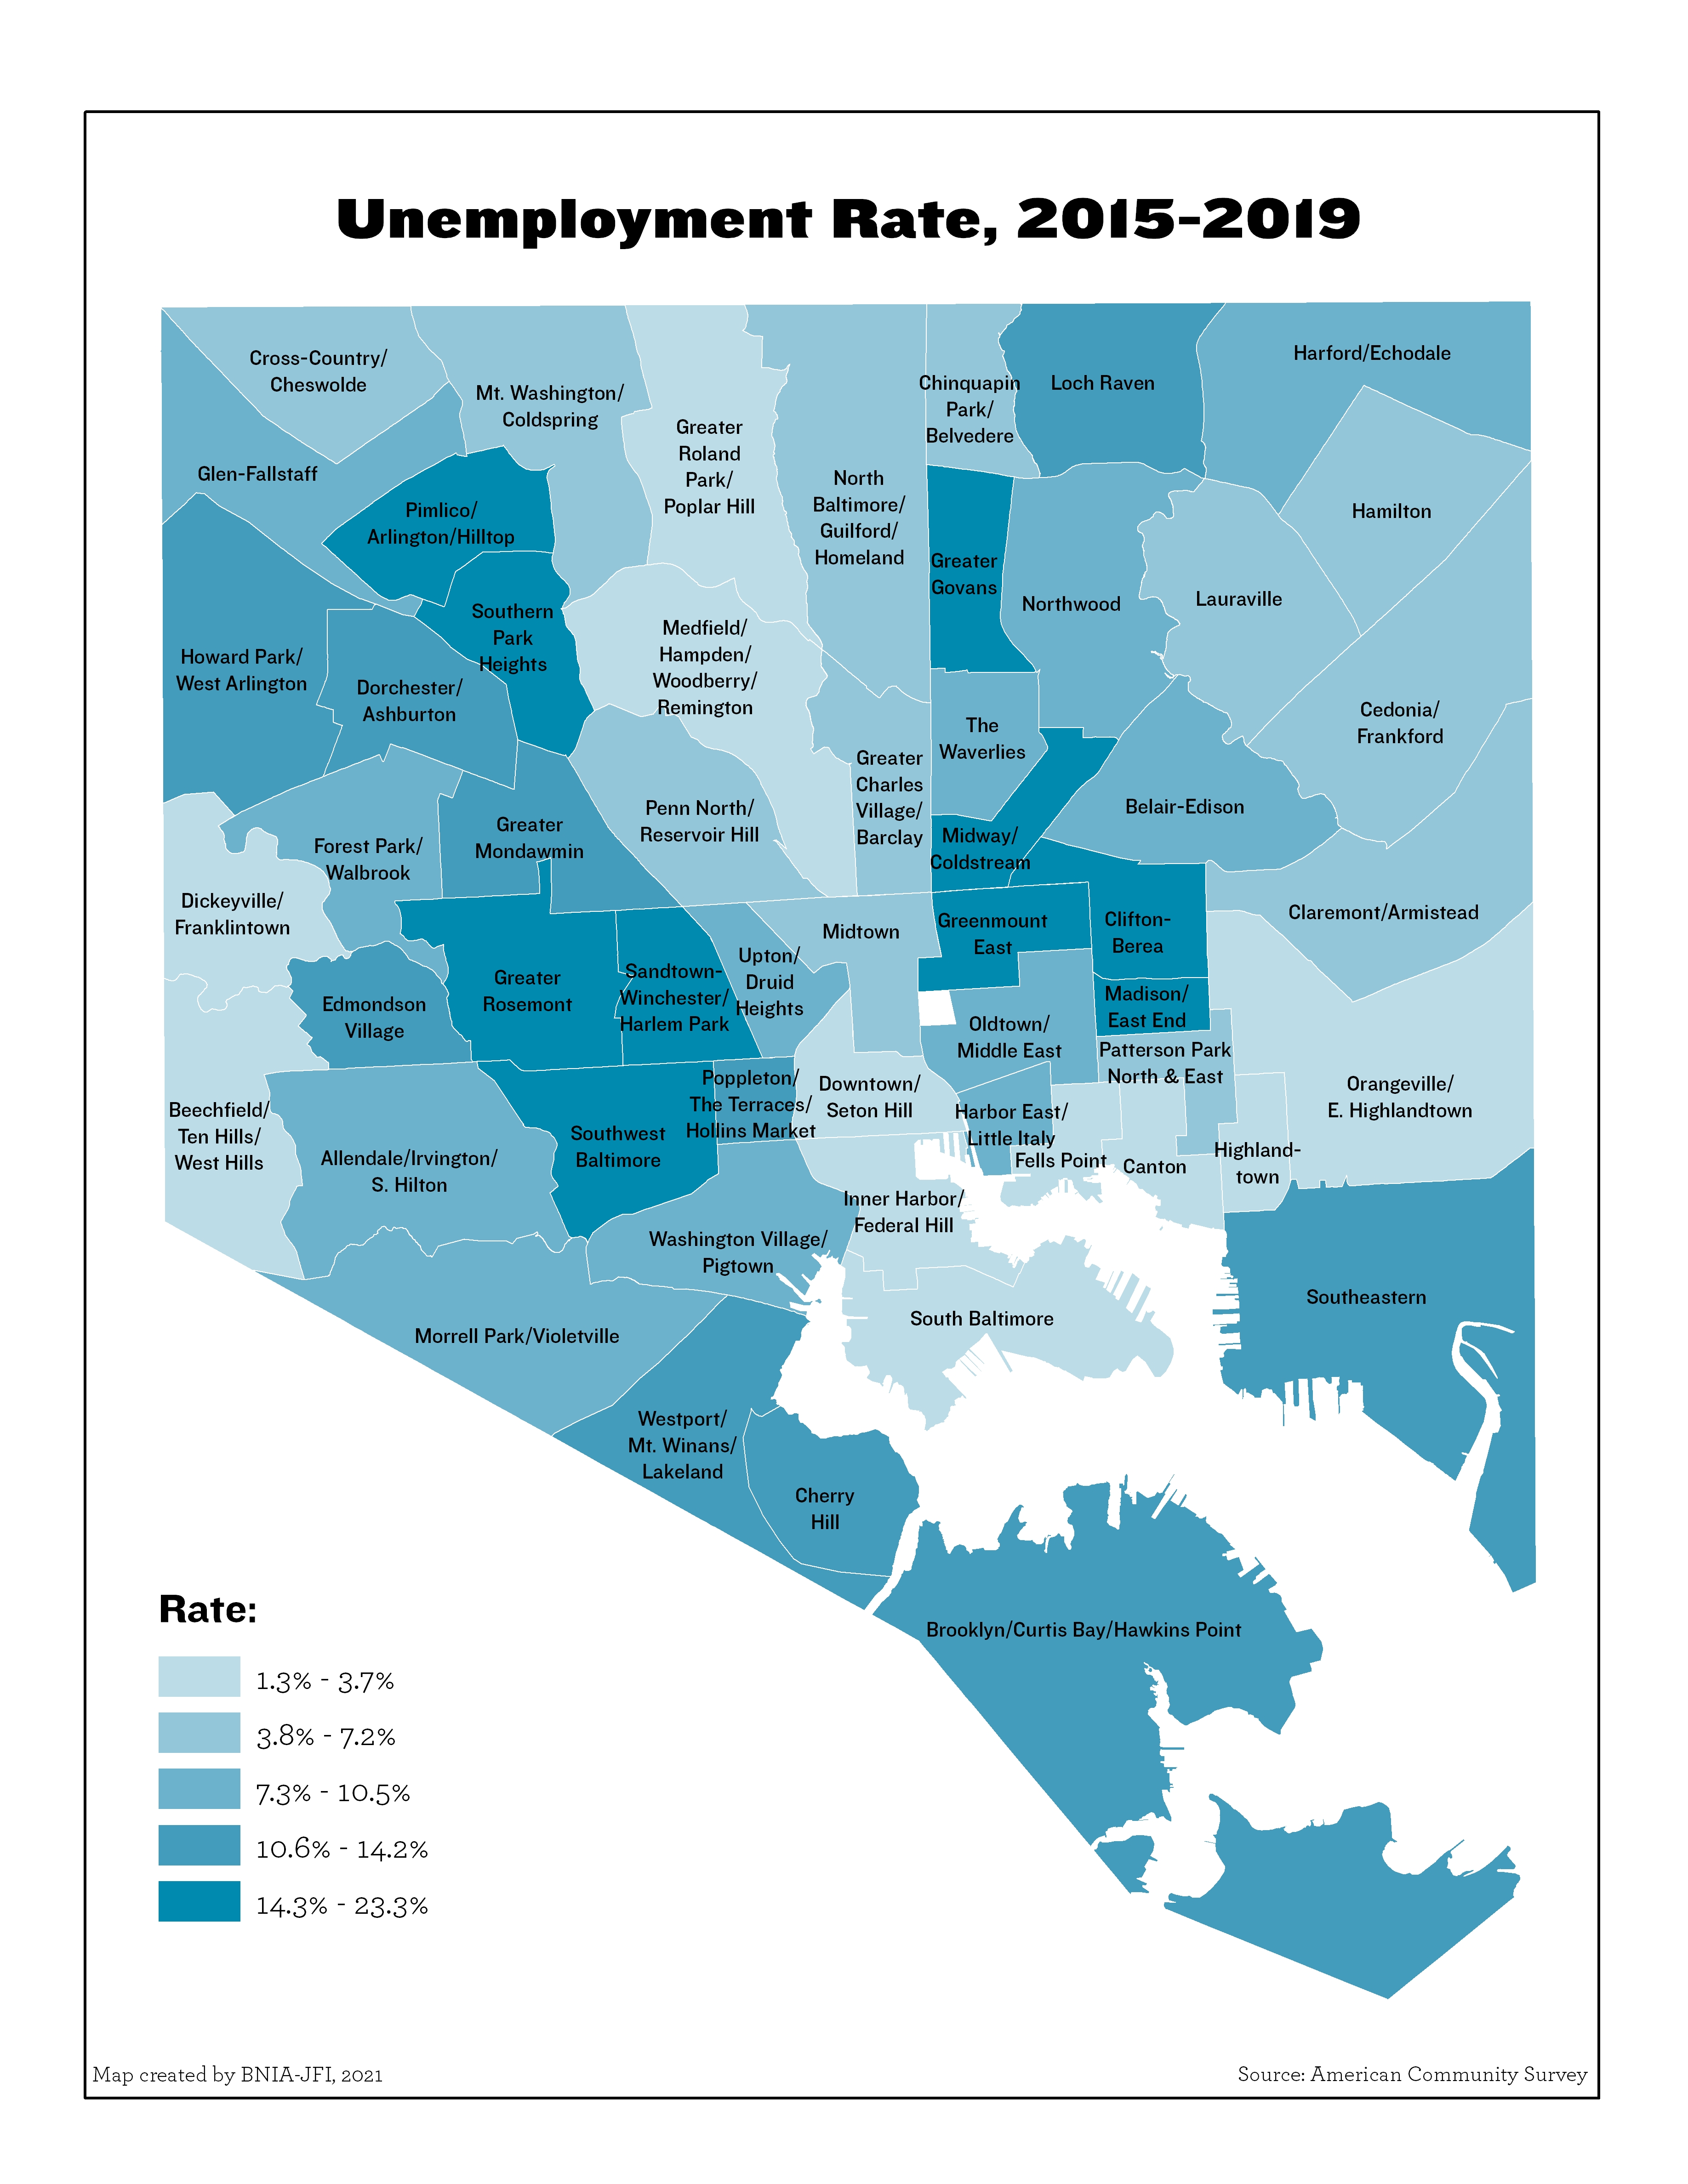
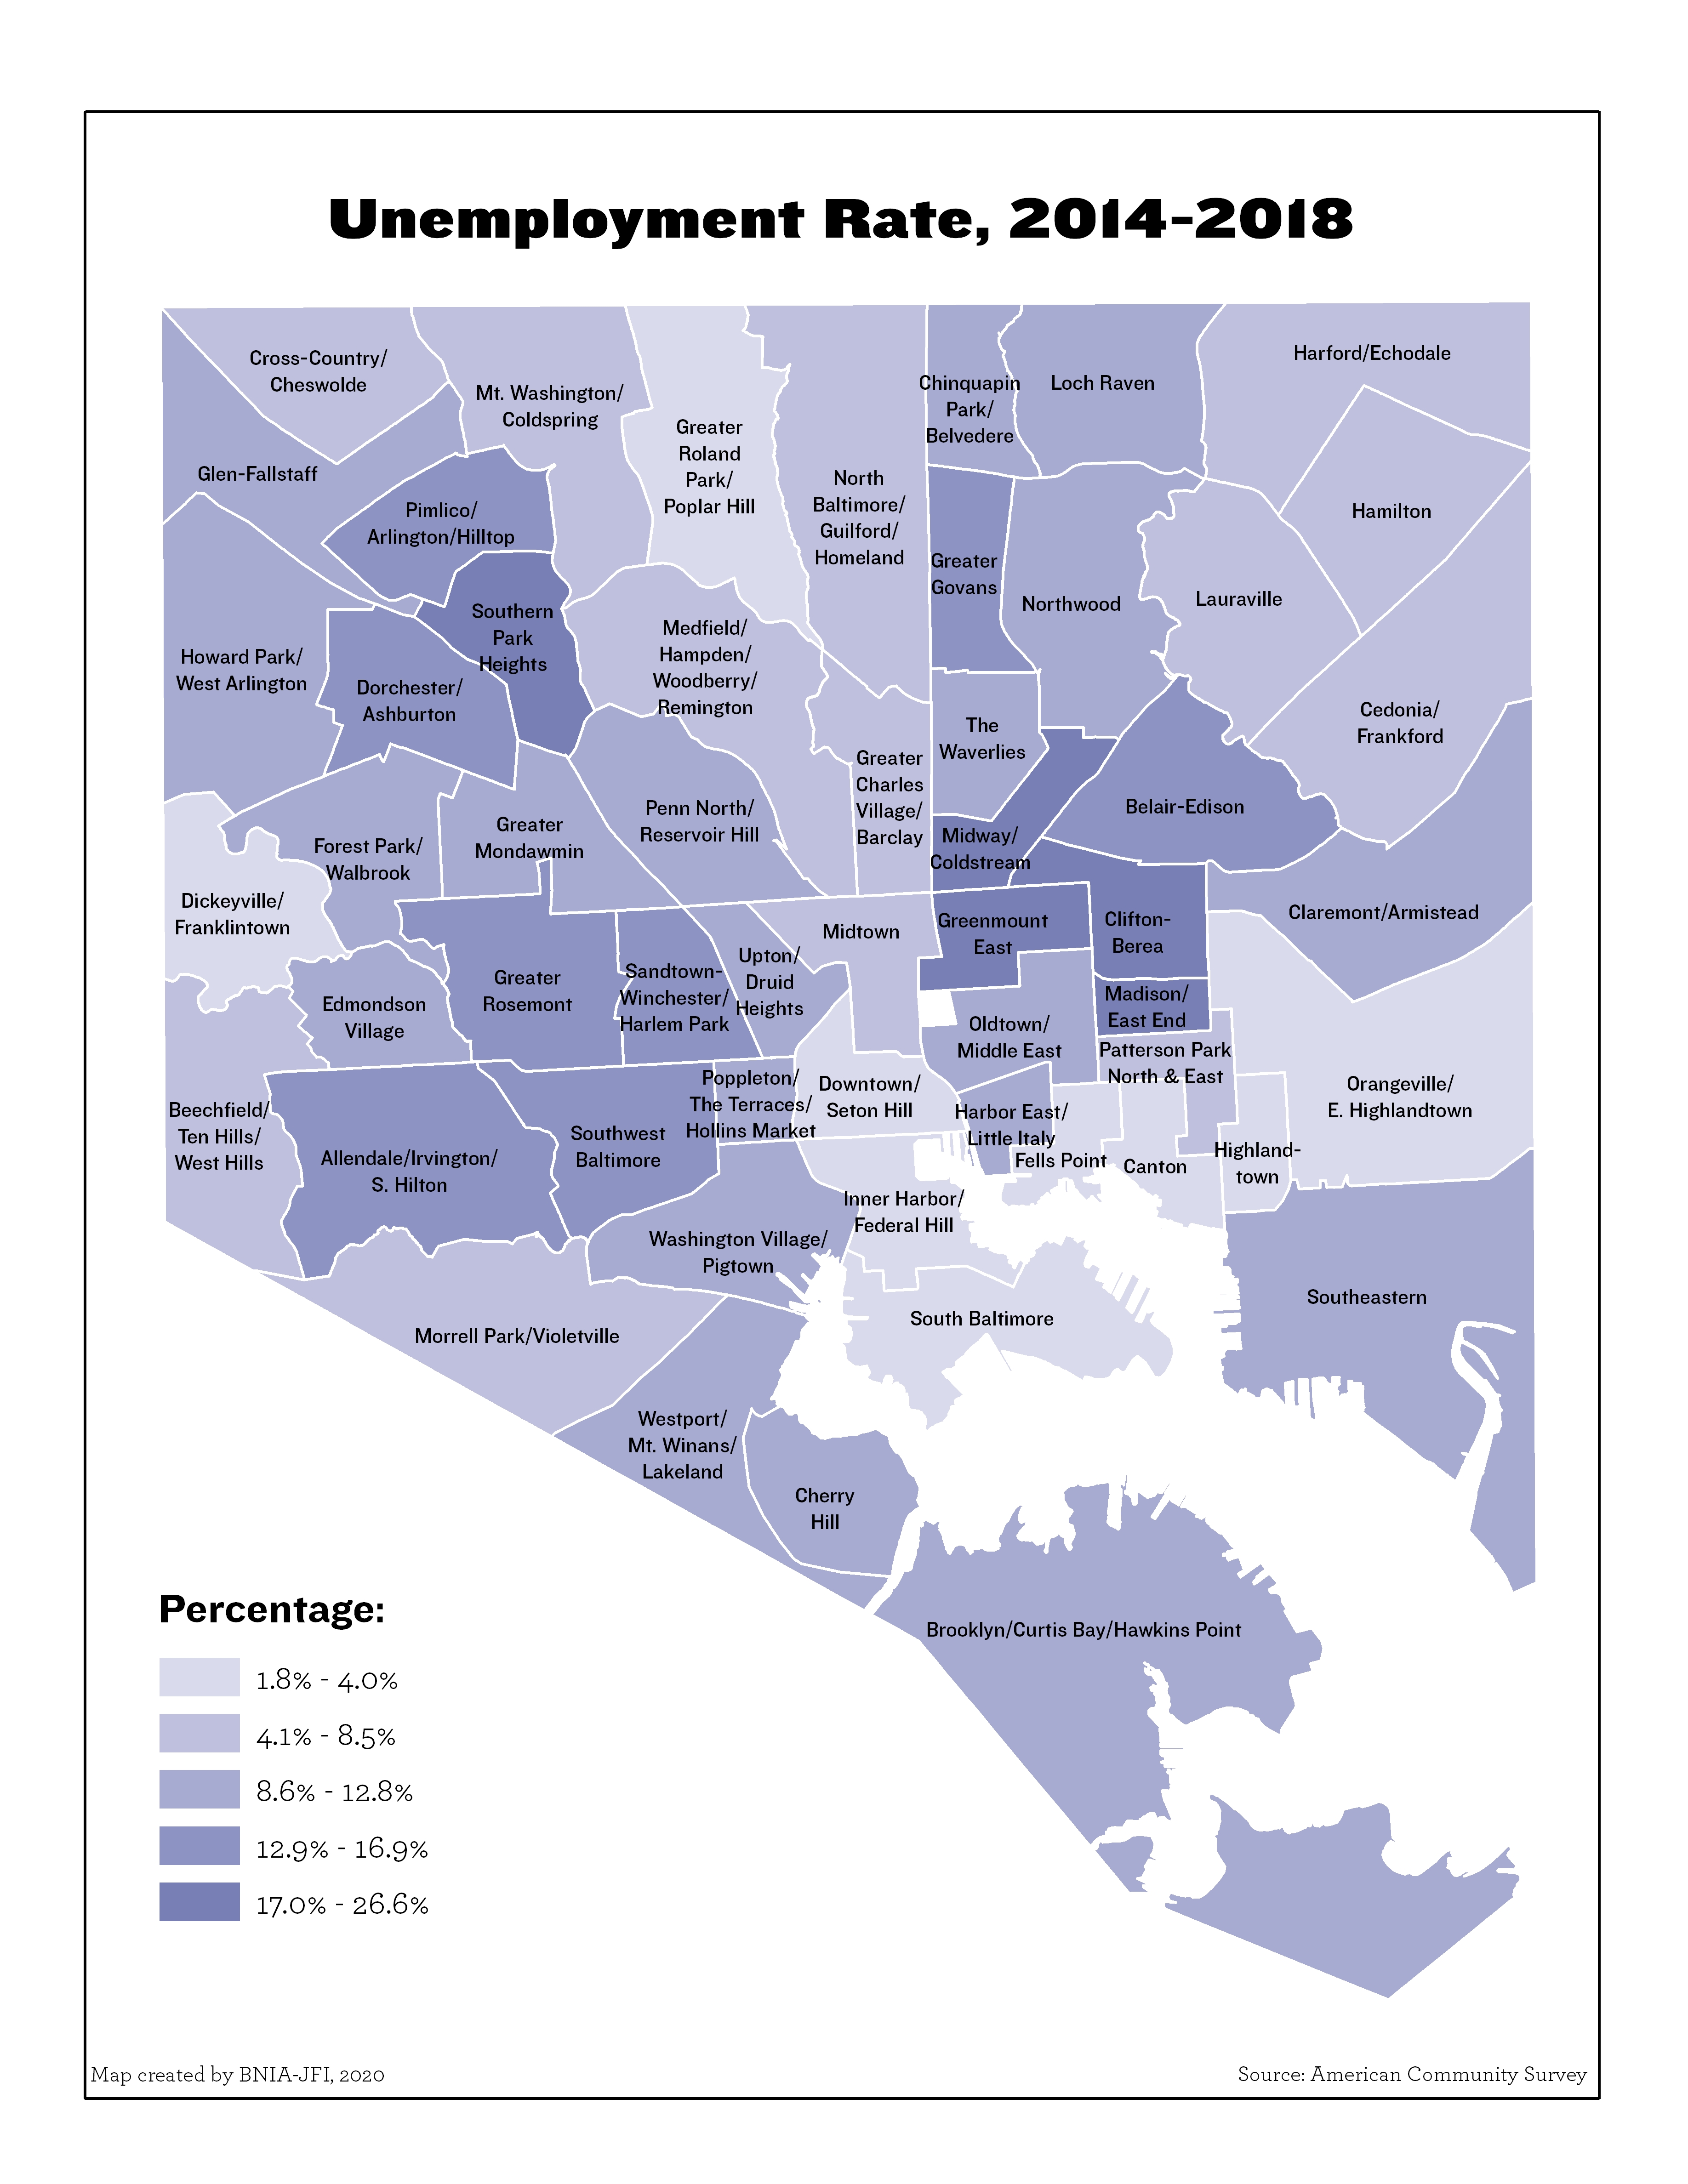
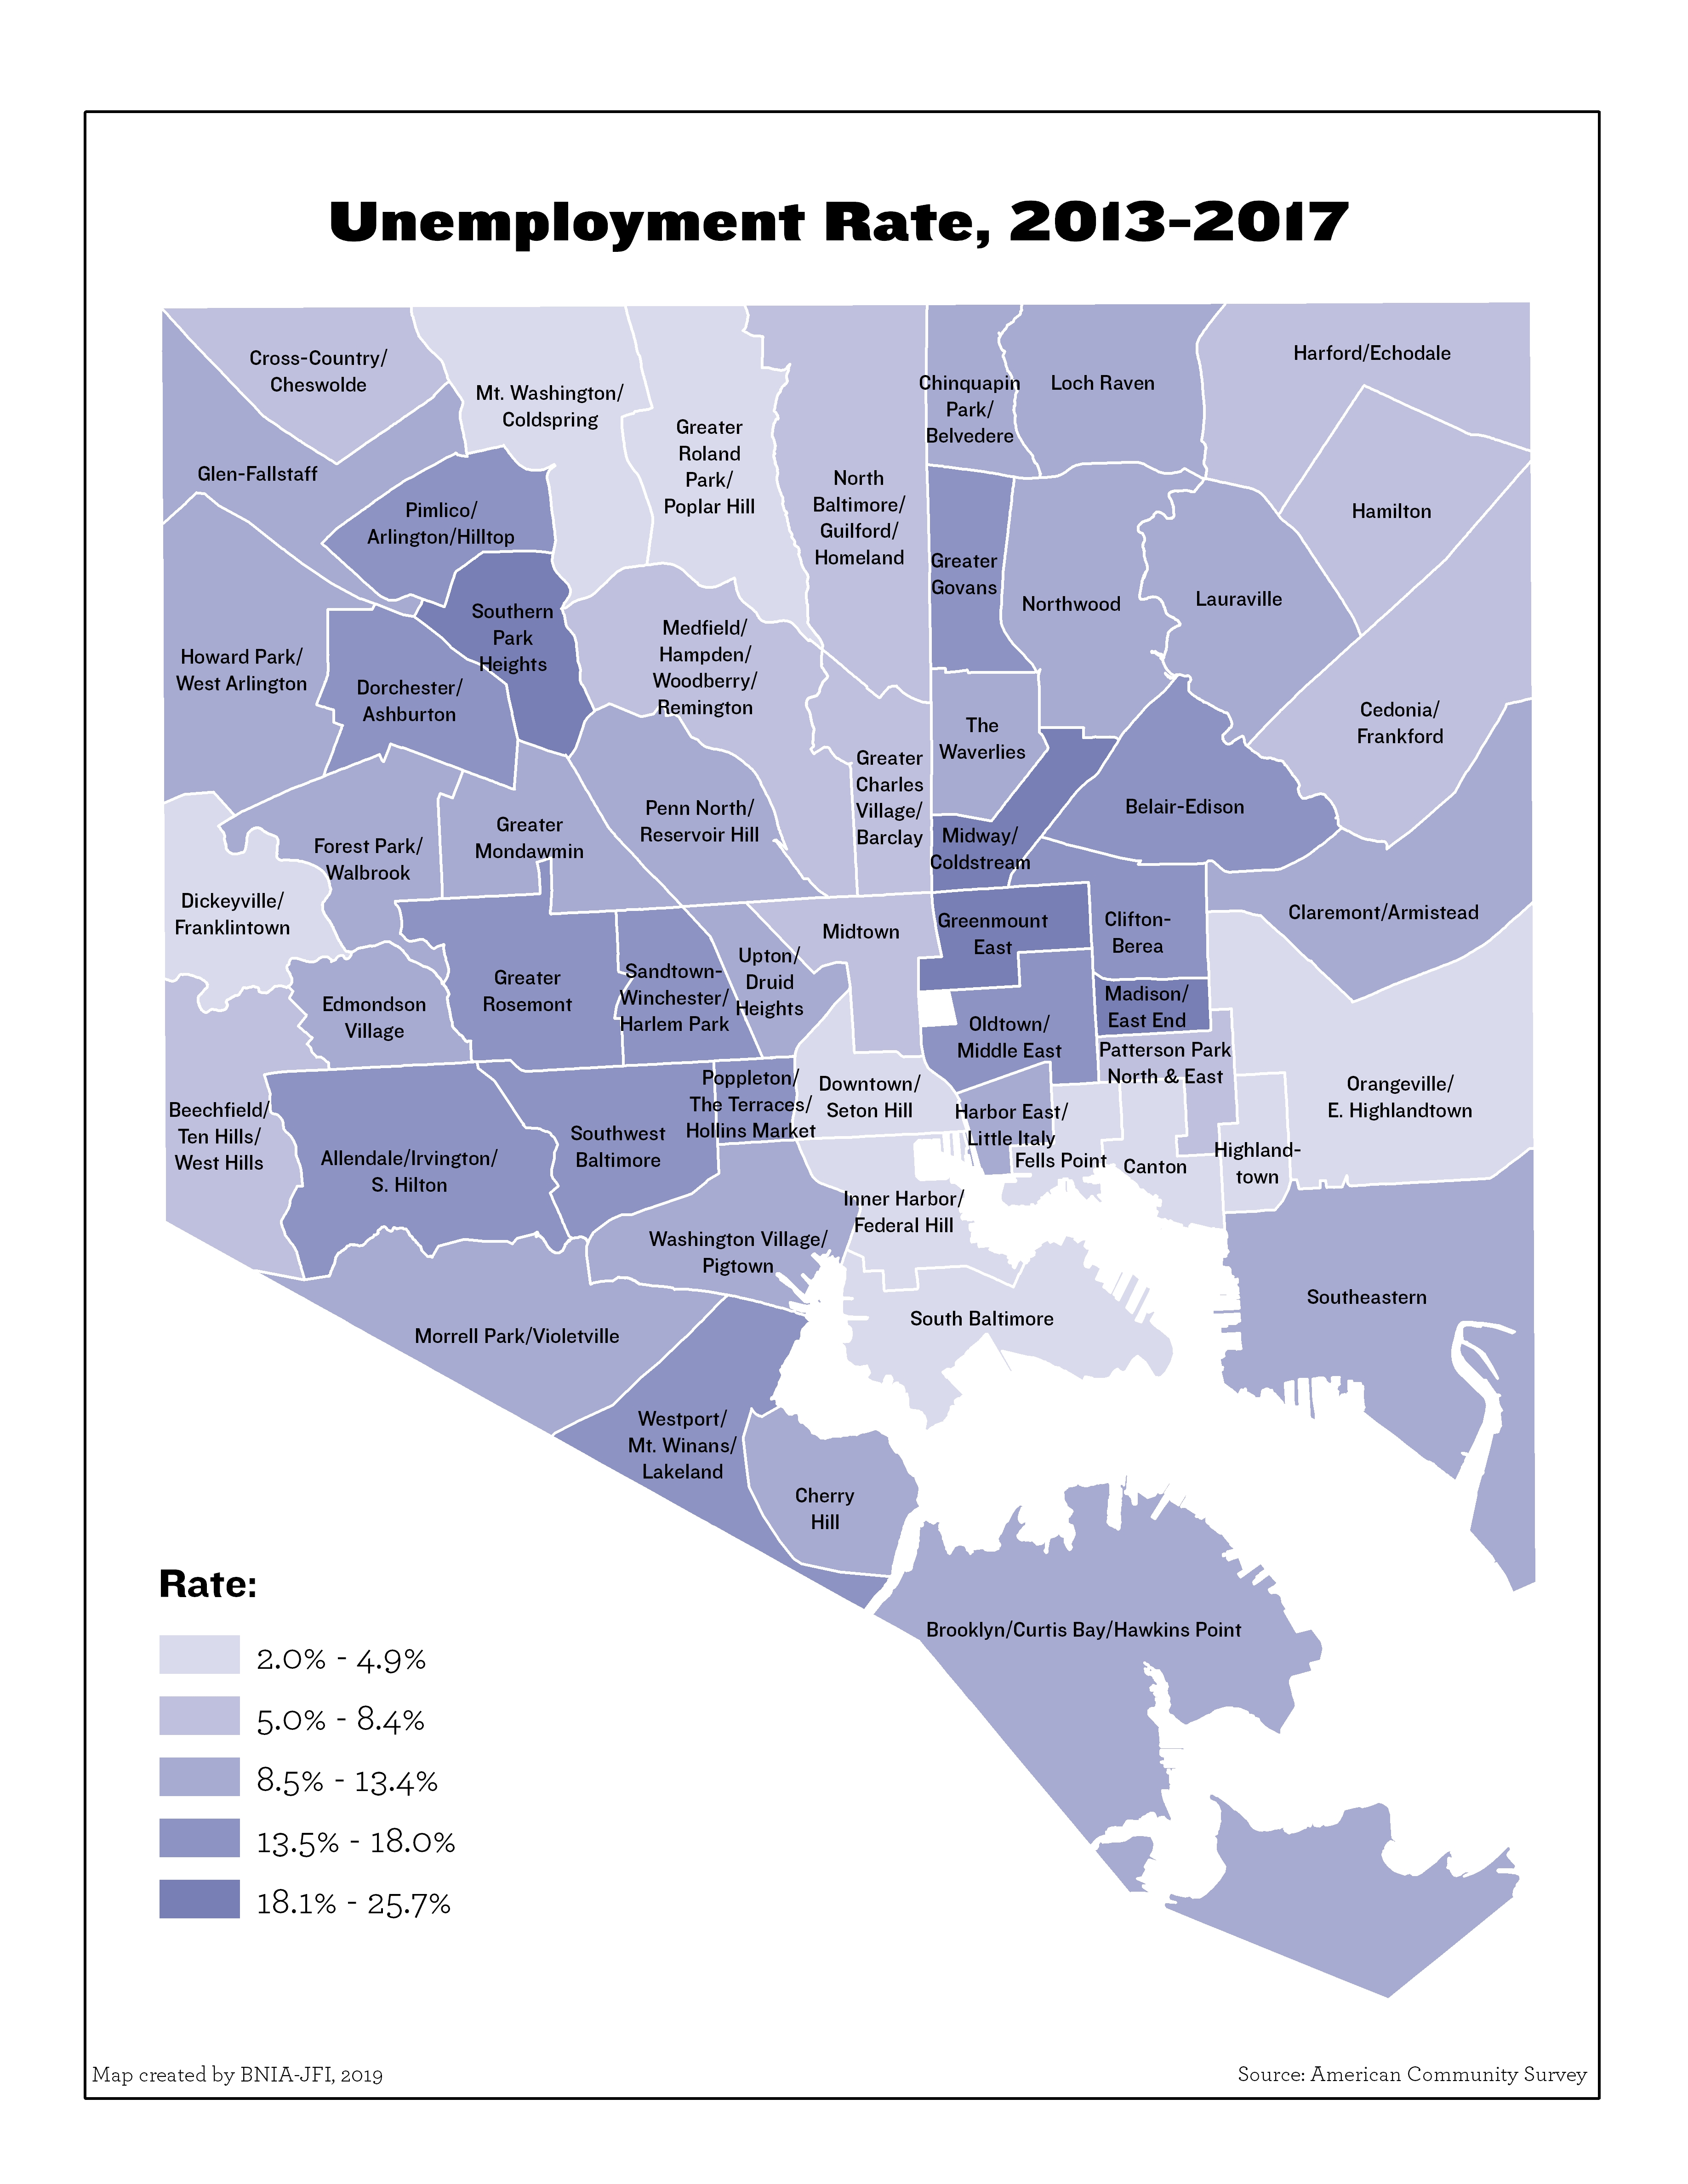
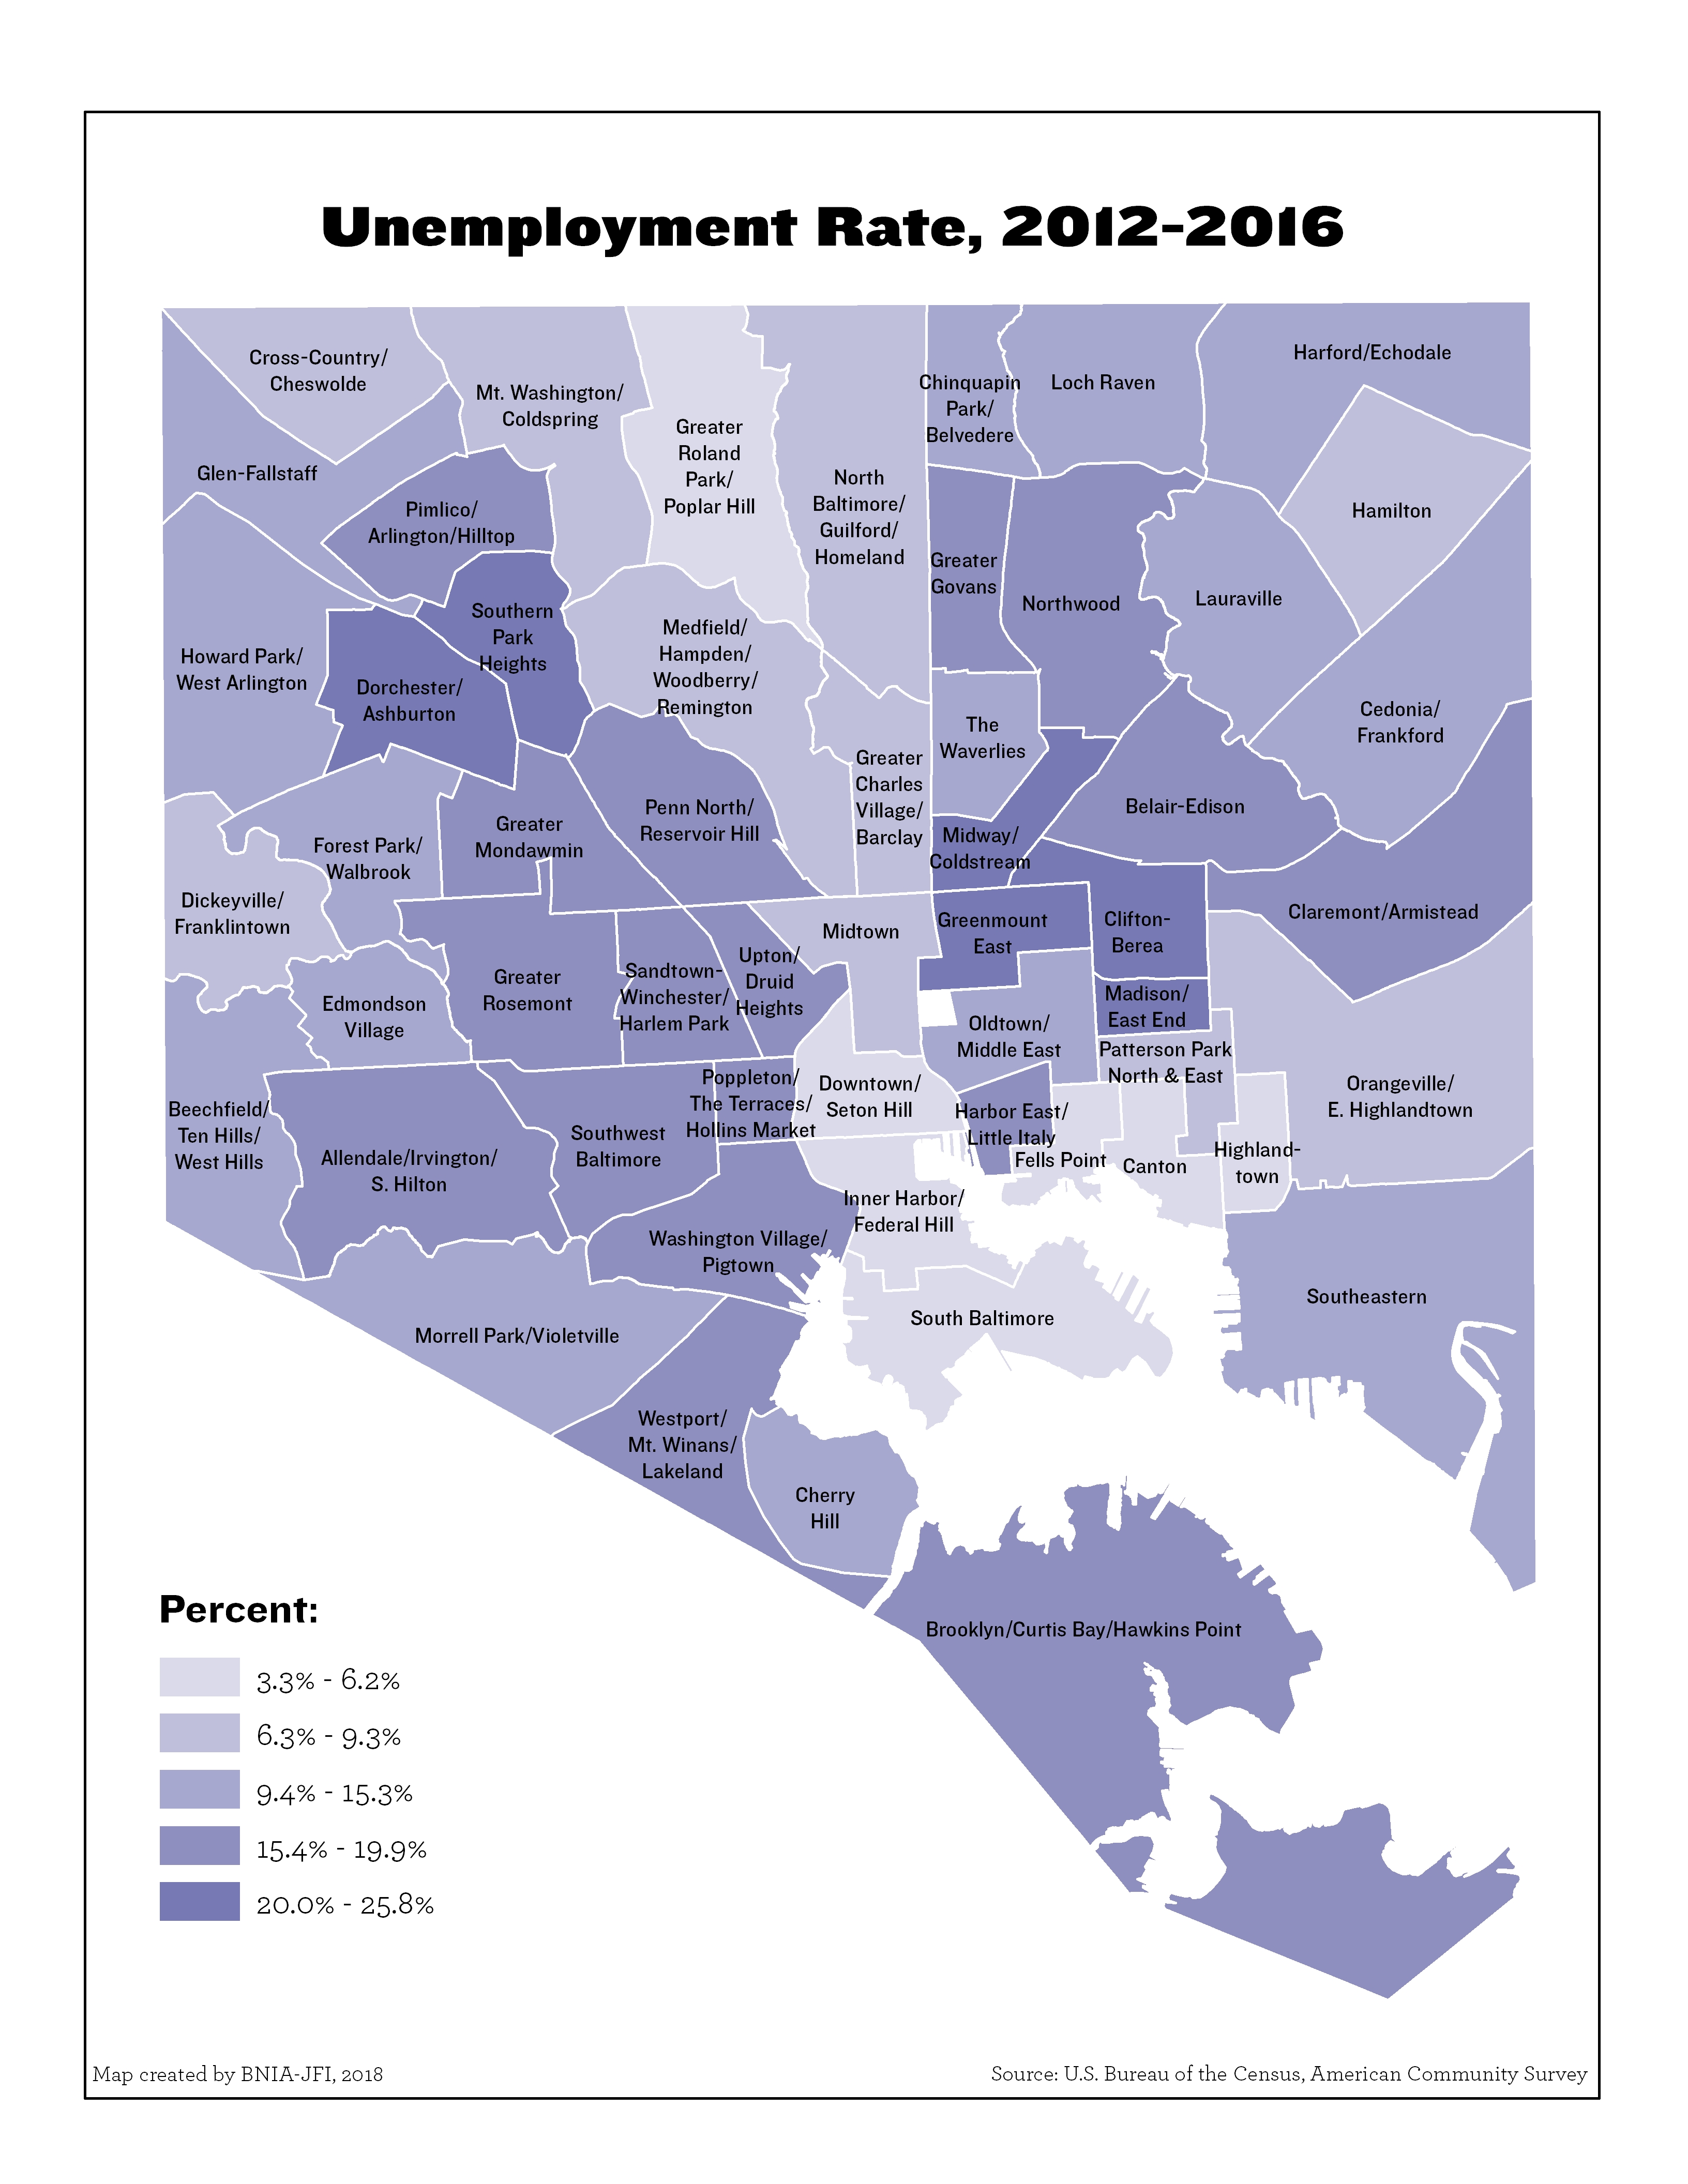
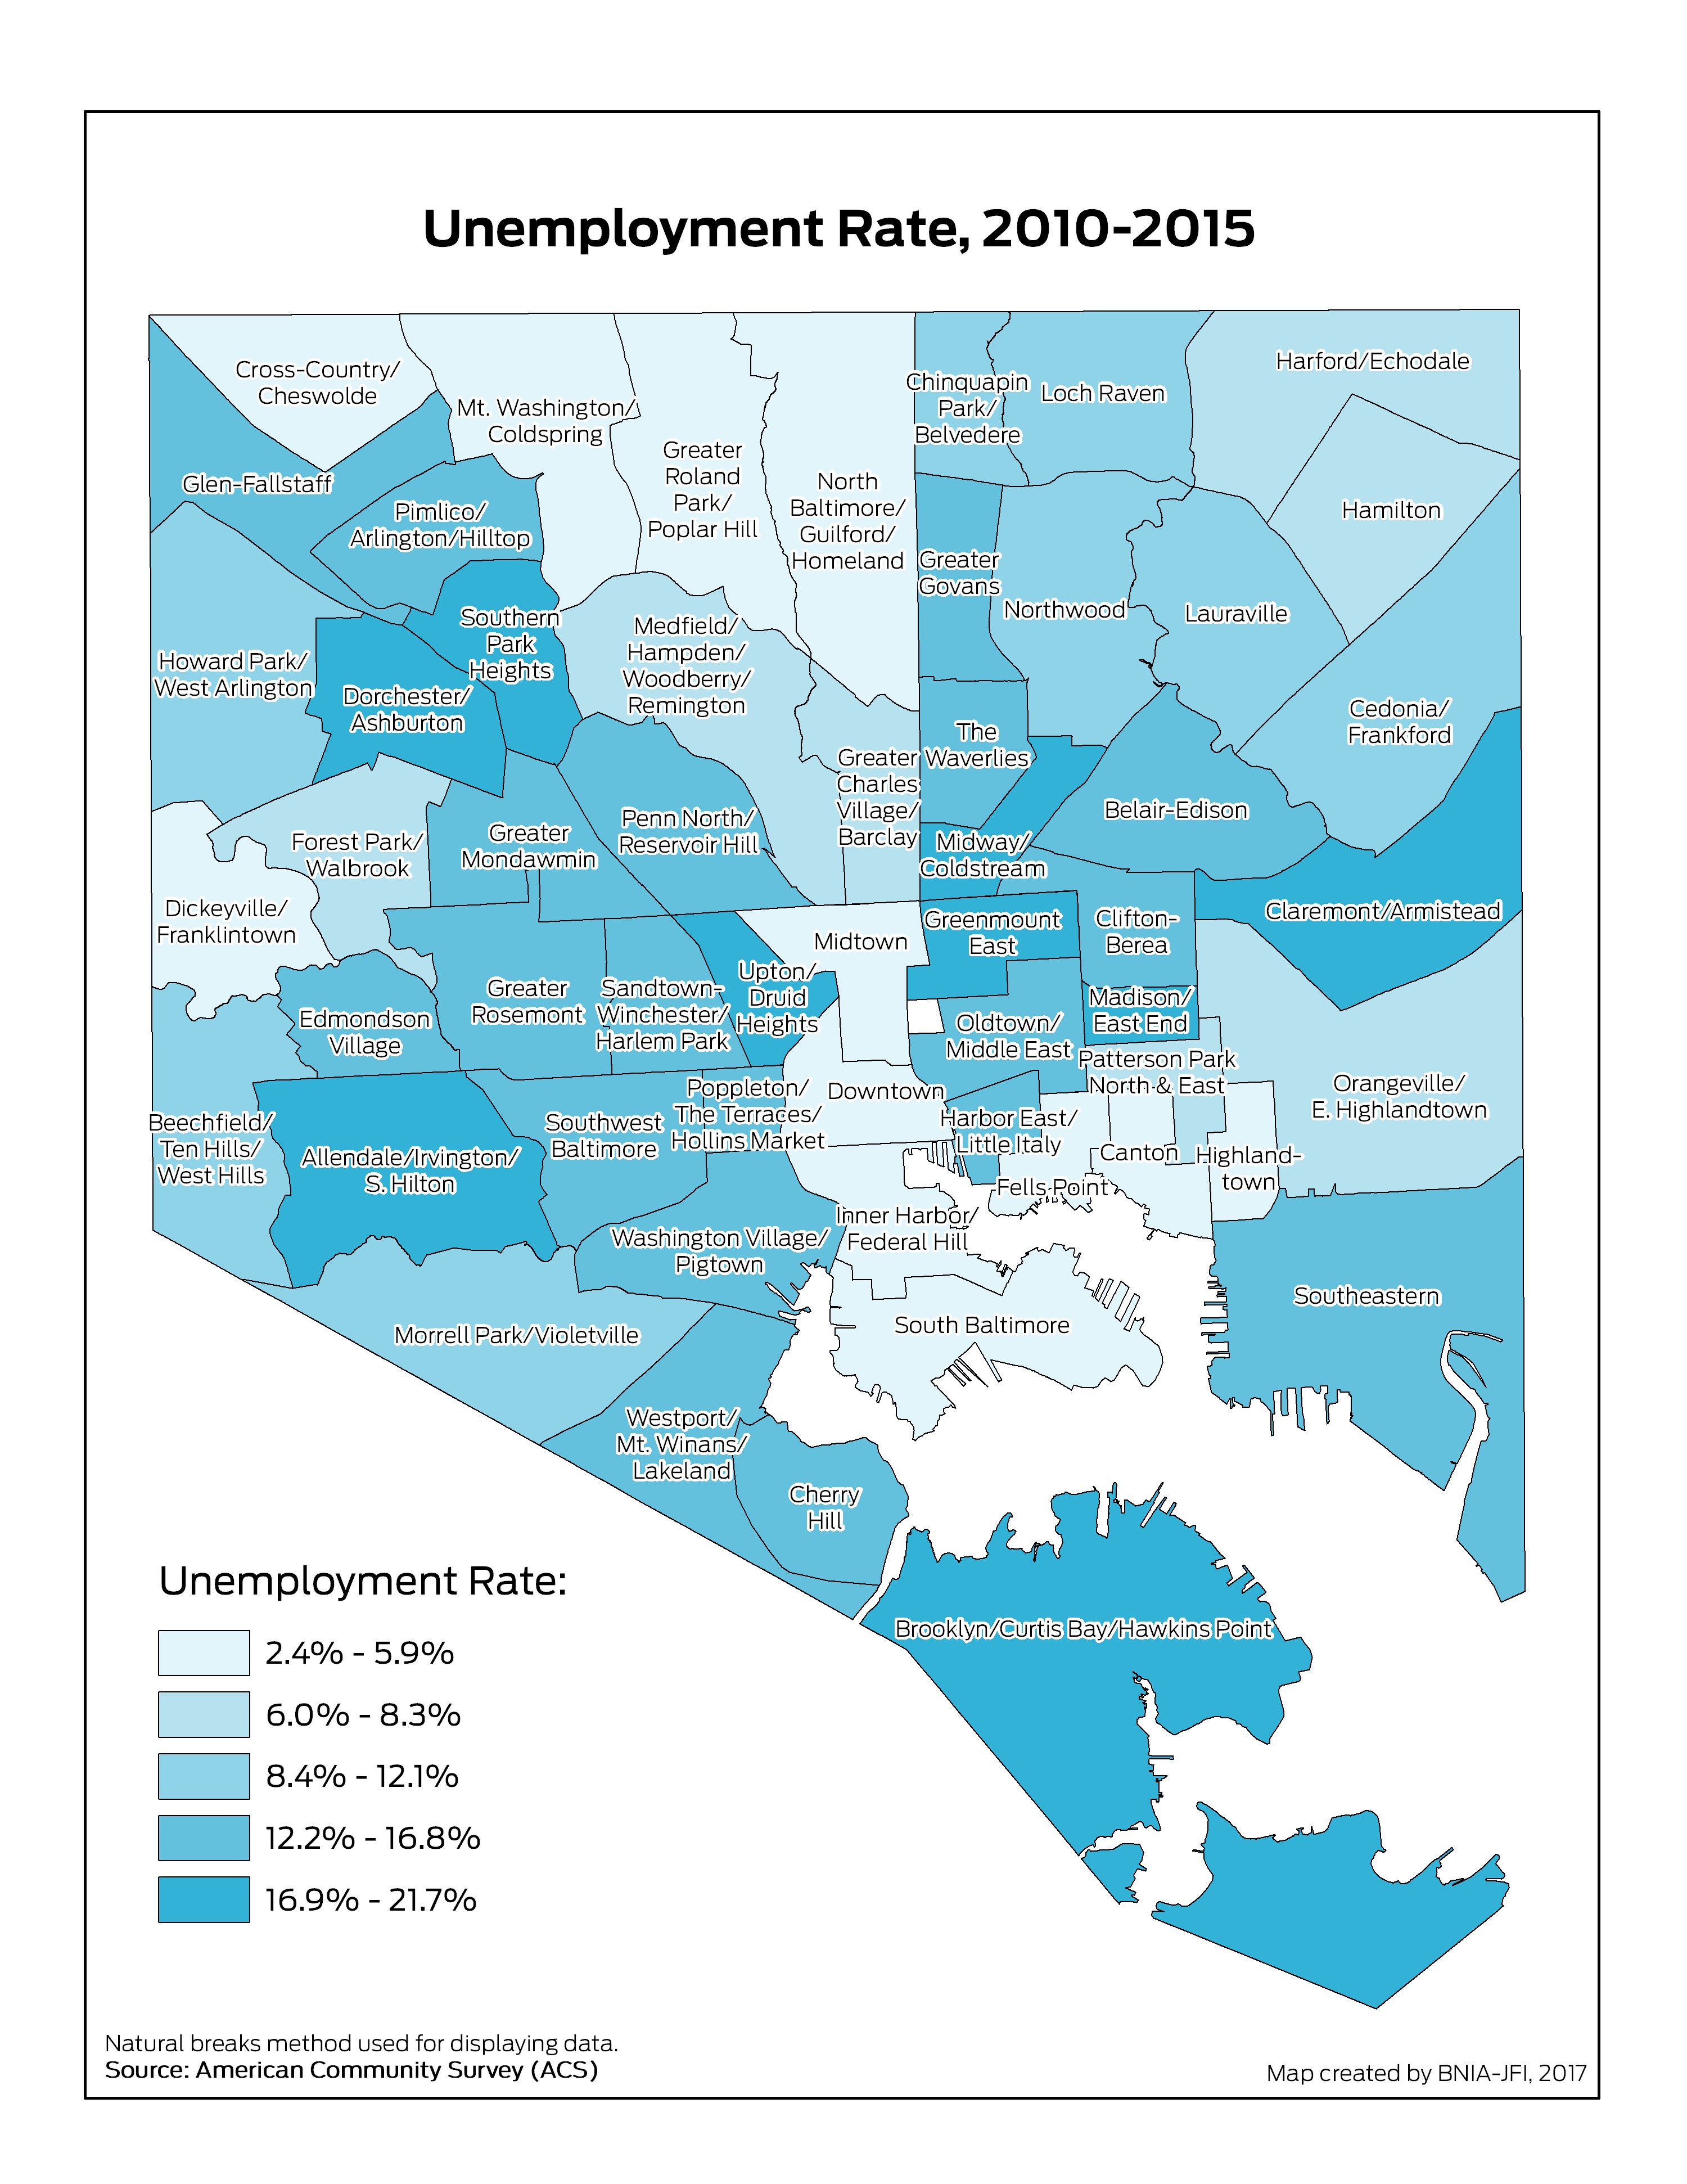
Unemployment Rate
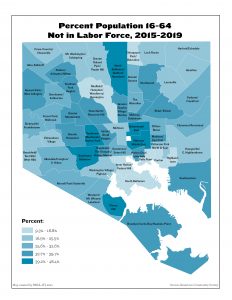
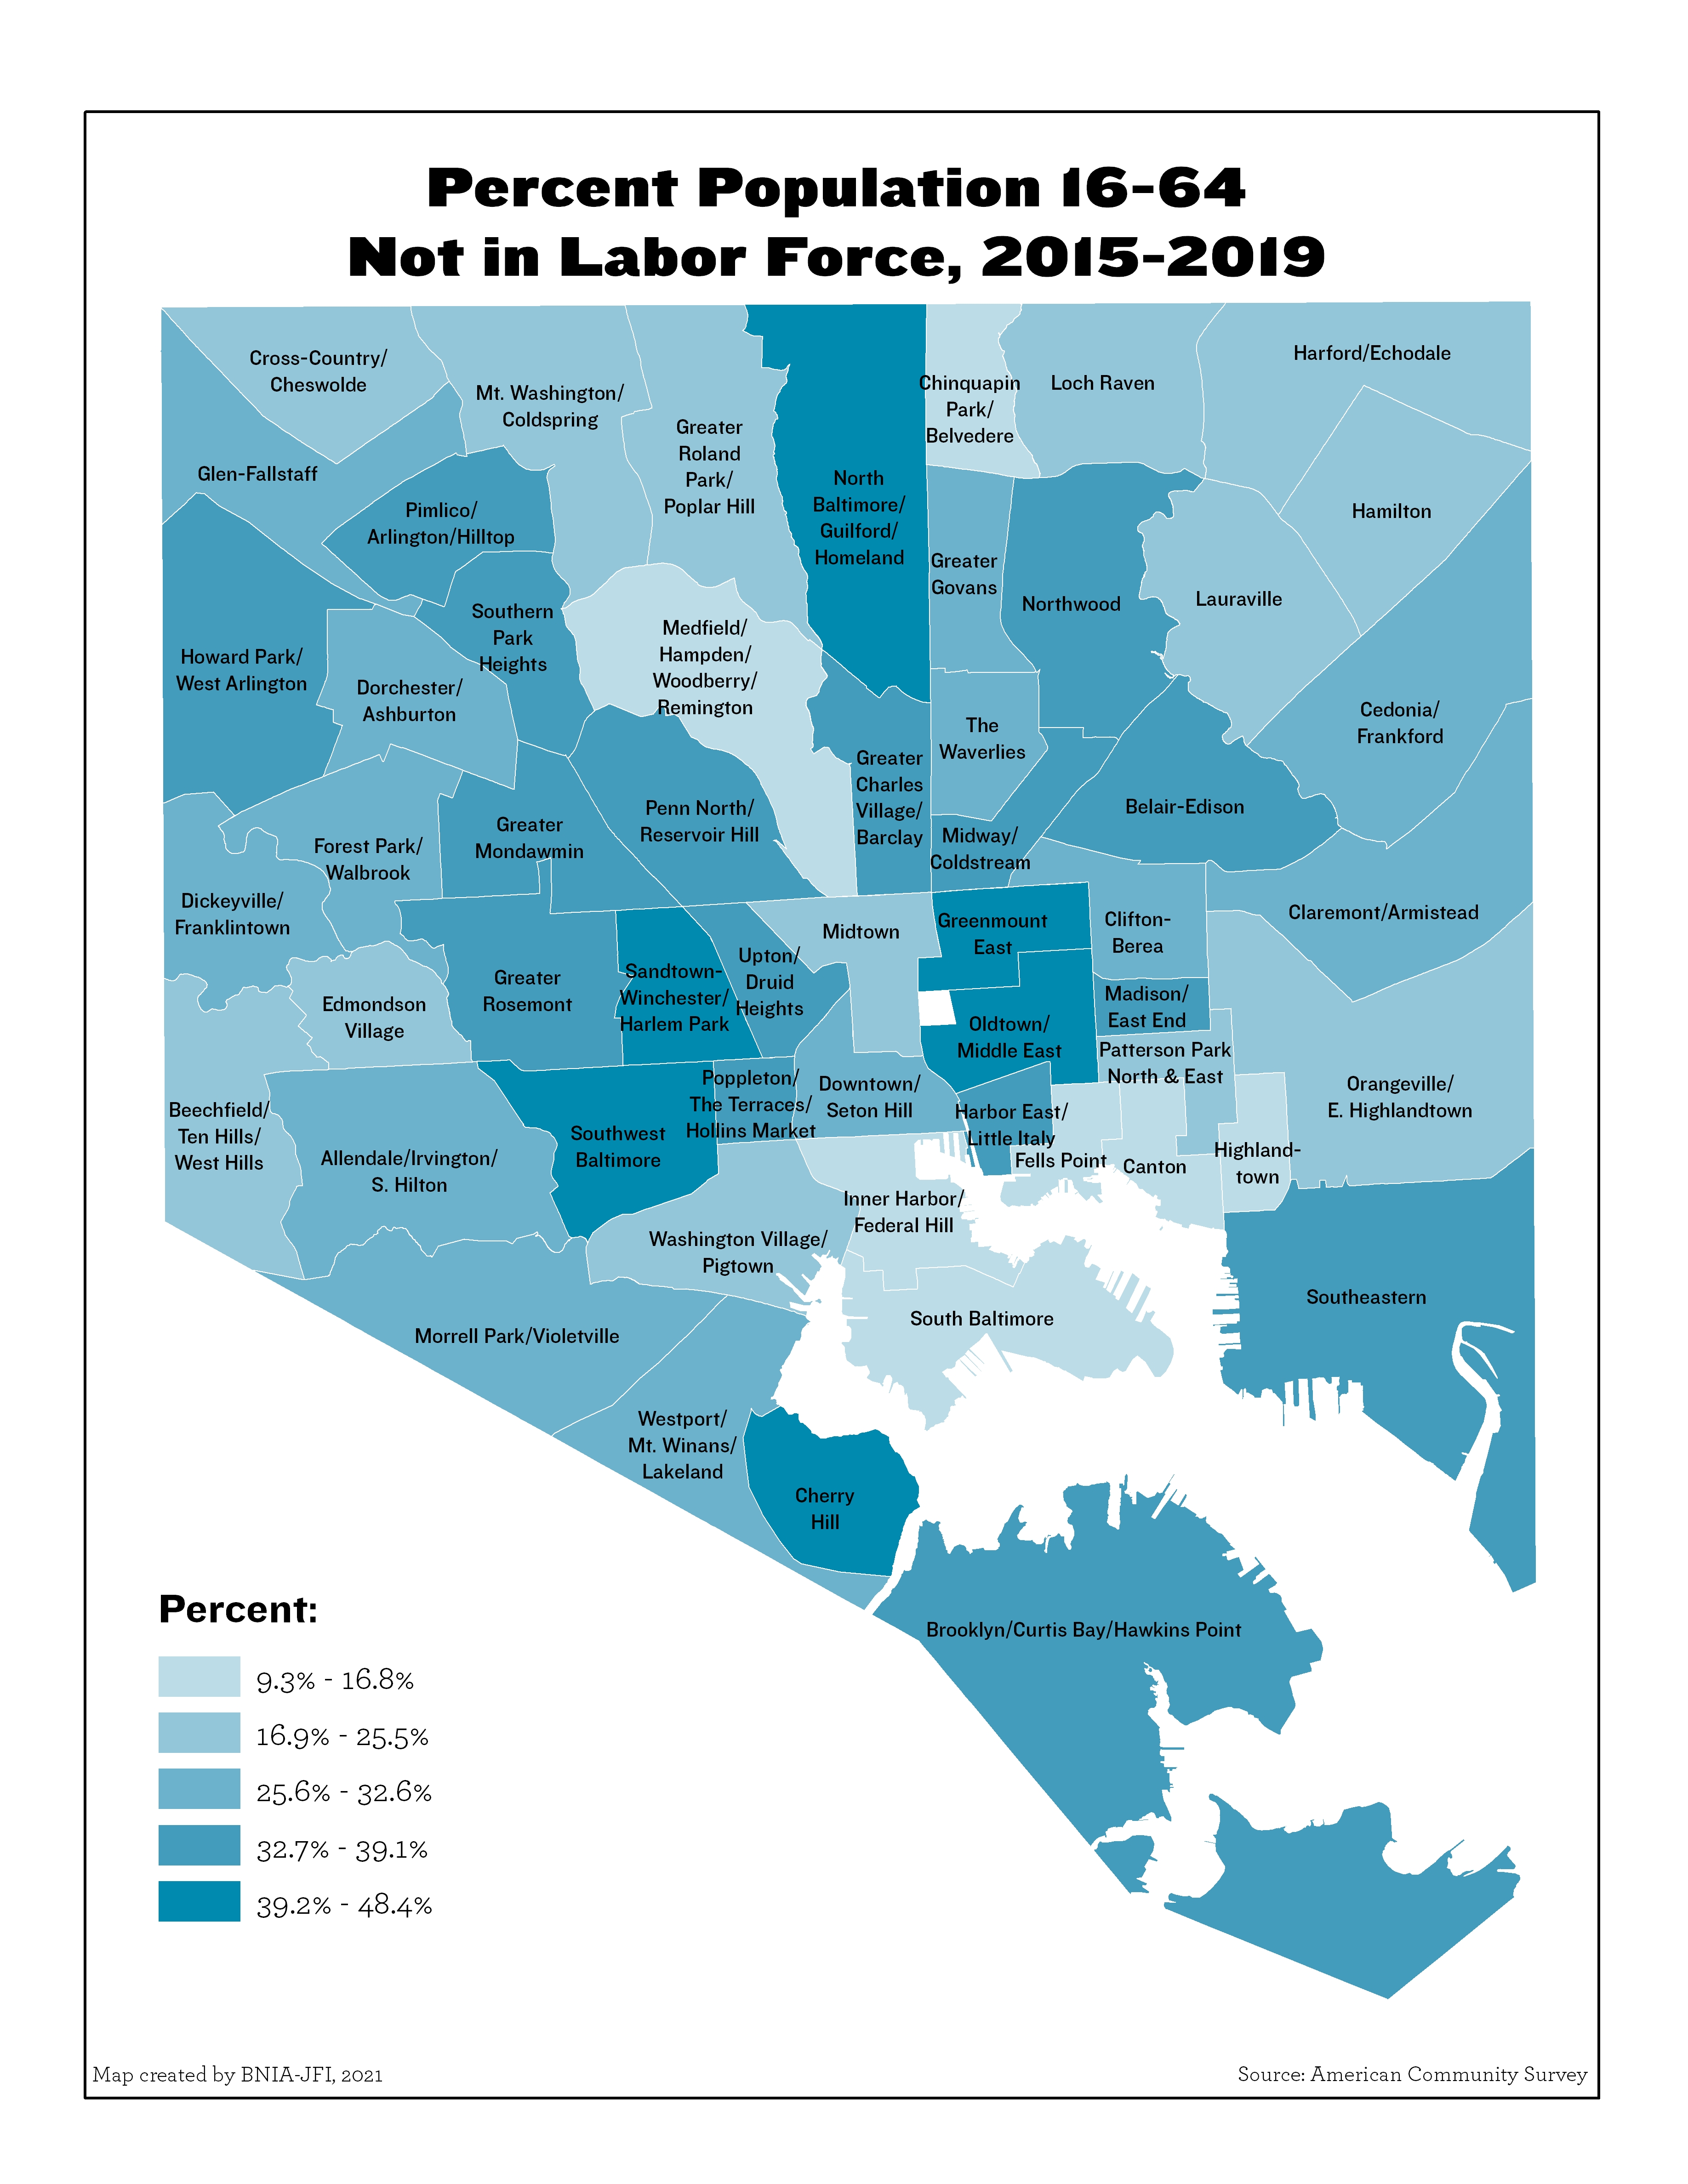
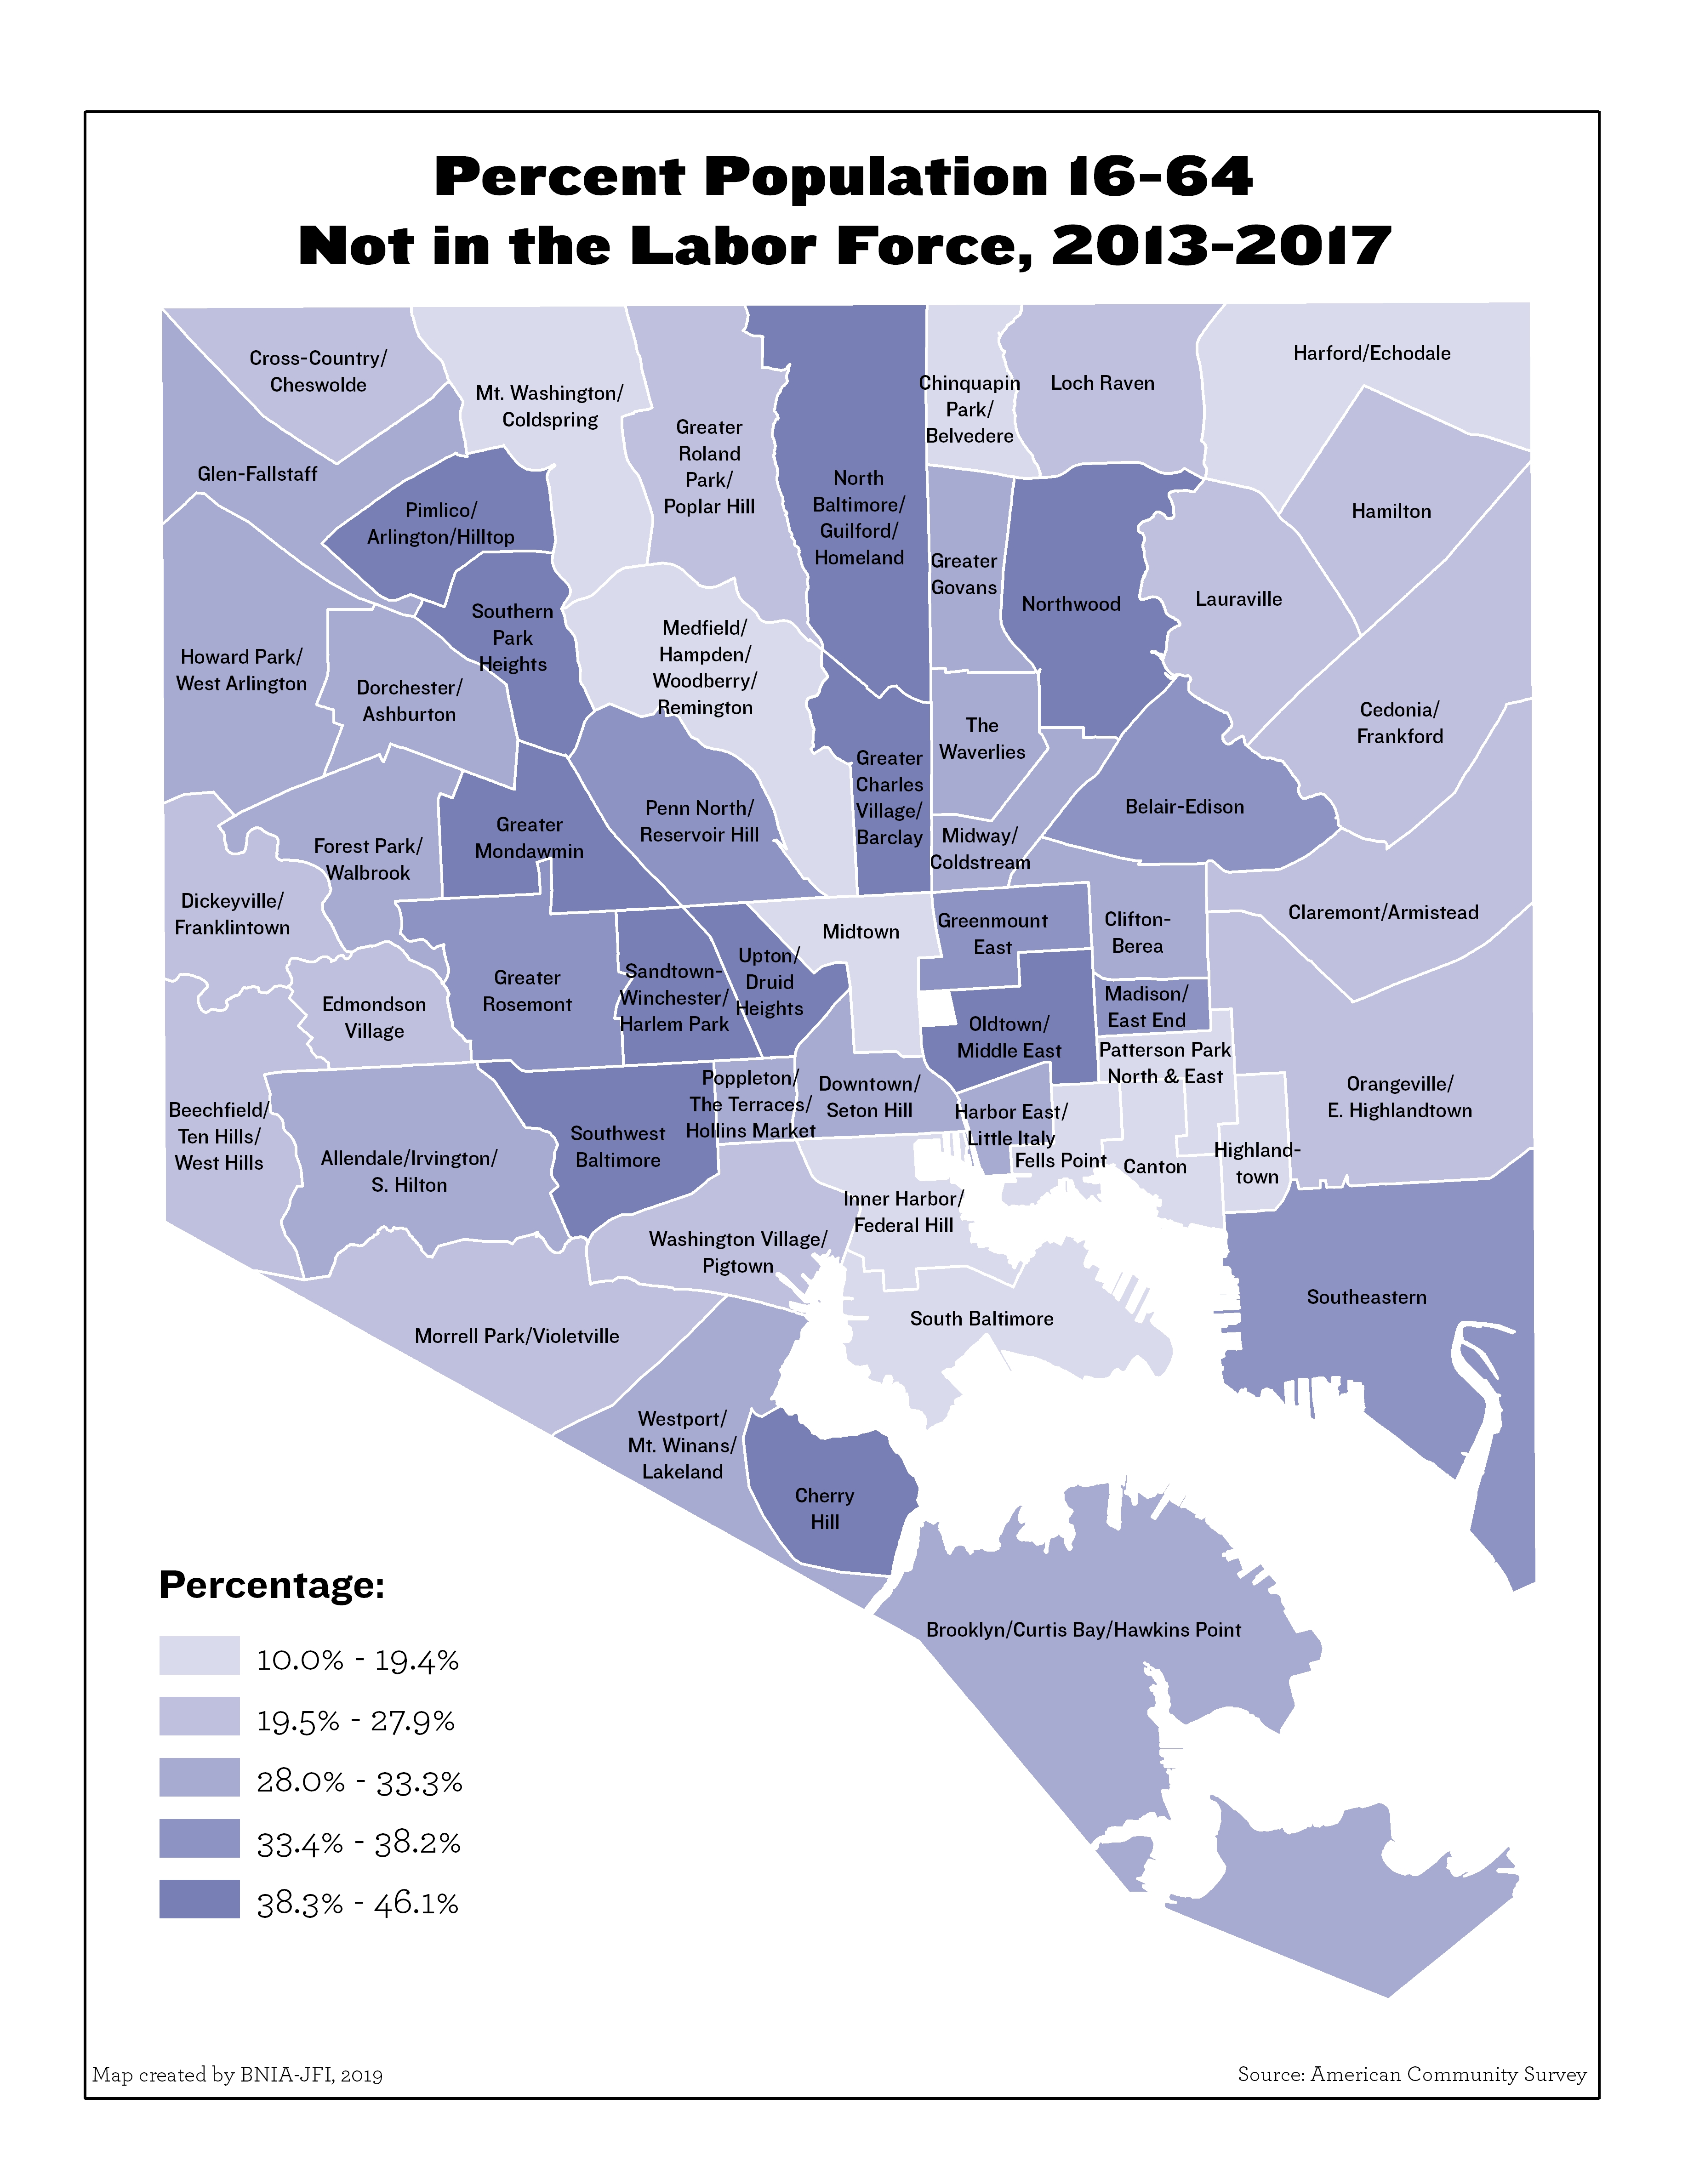
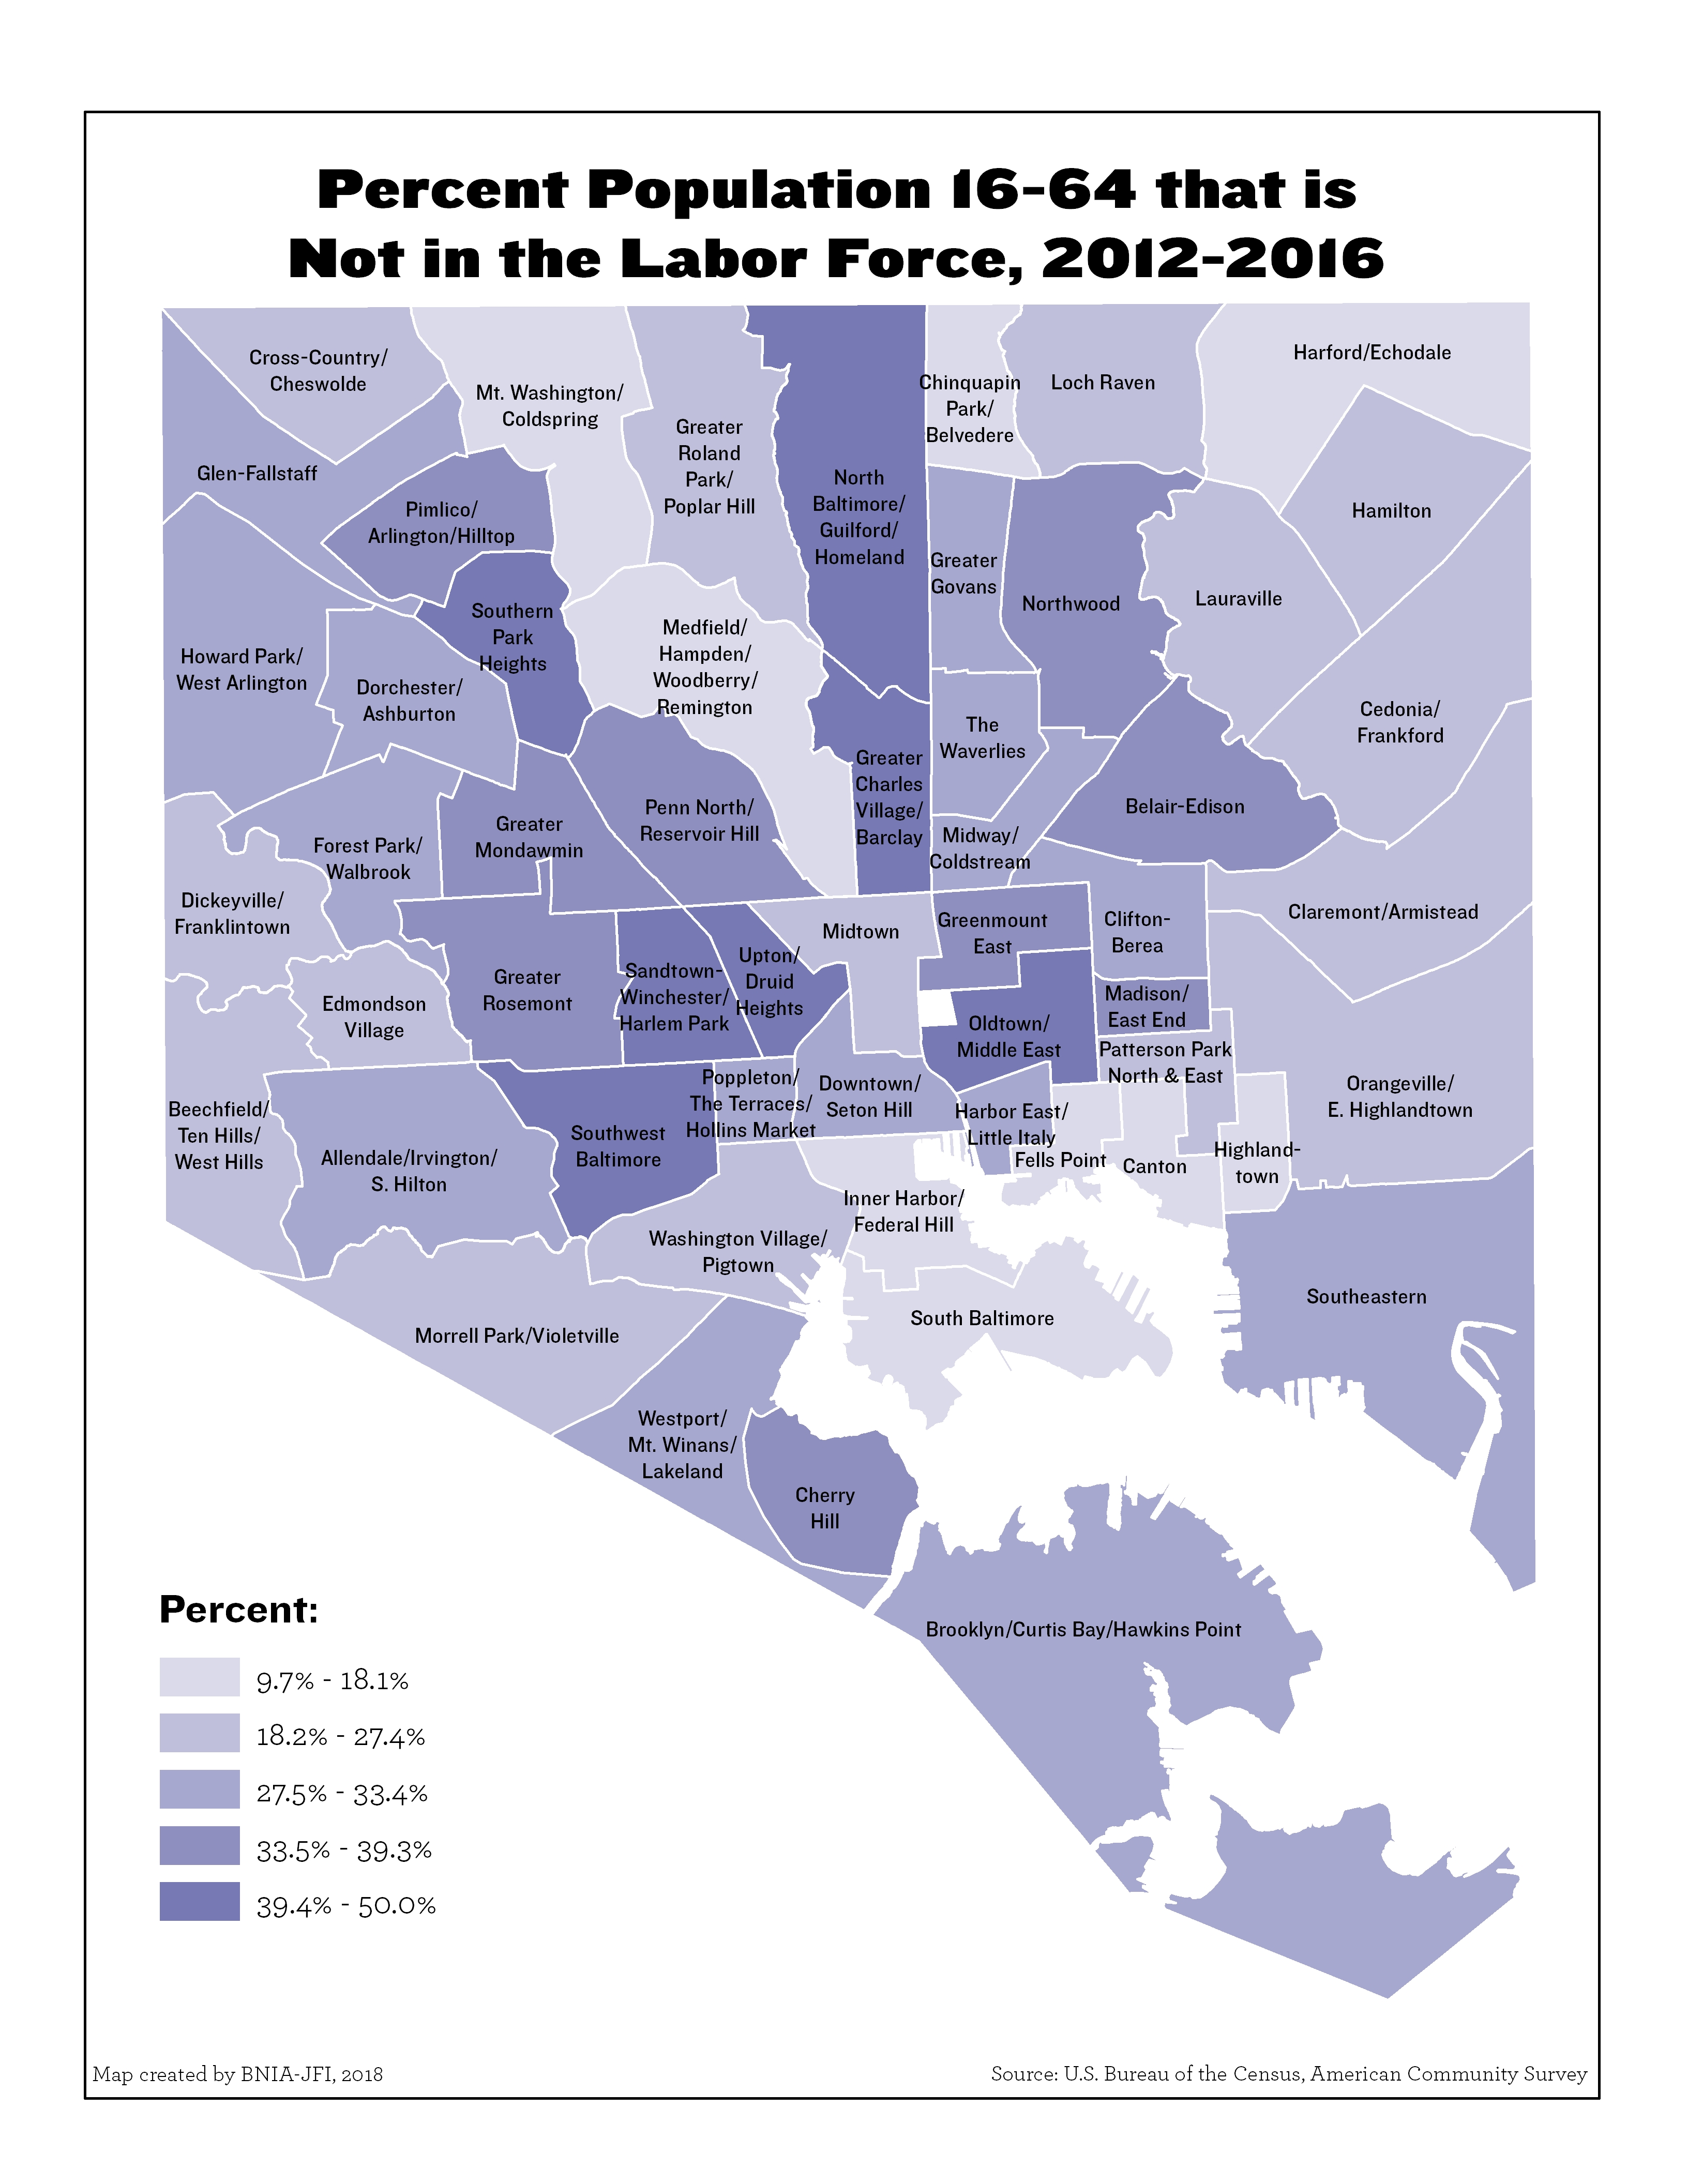
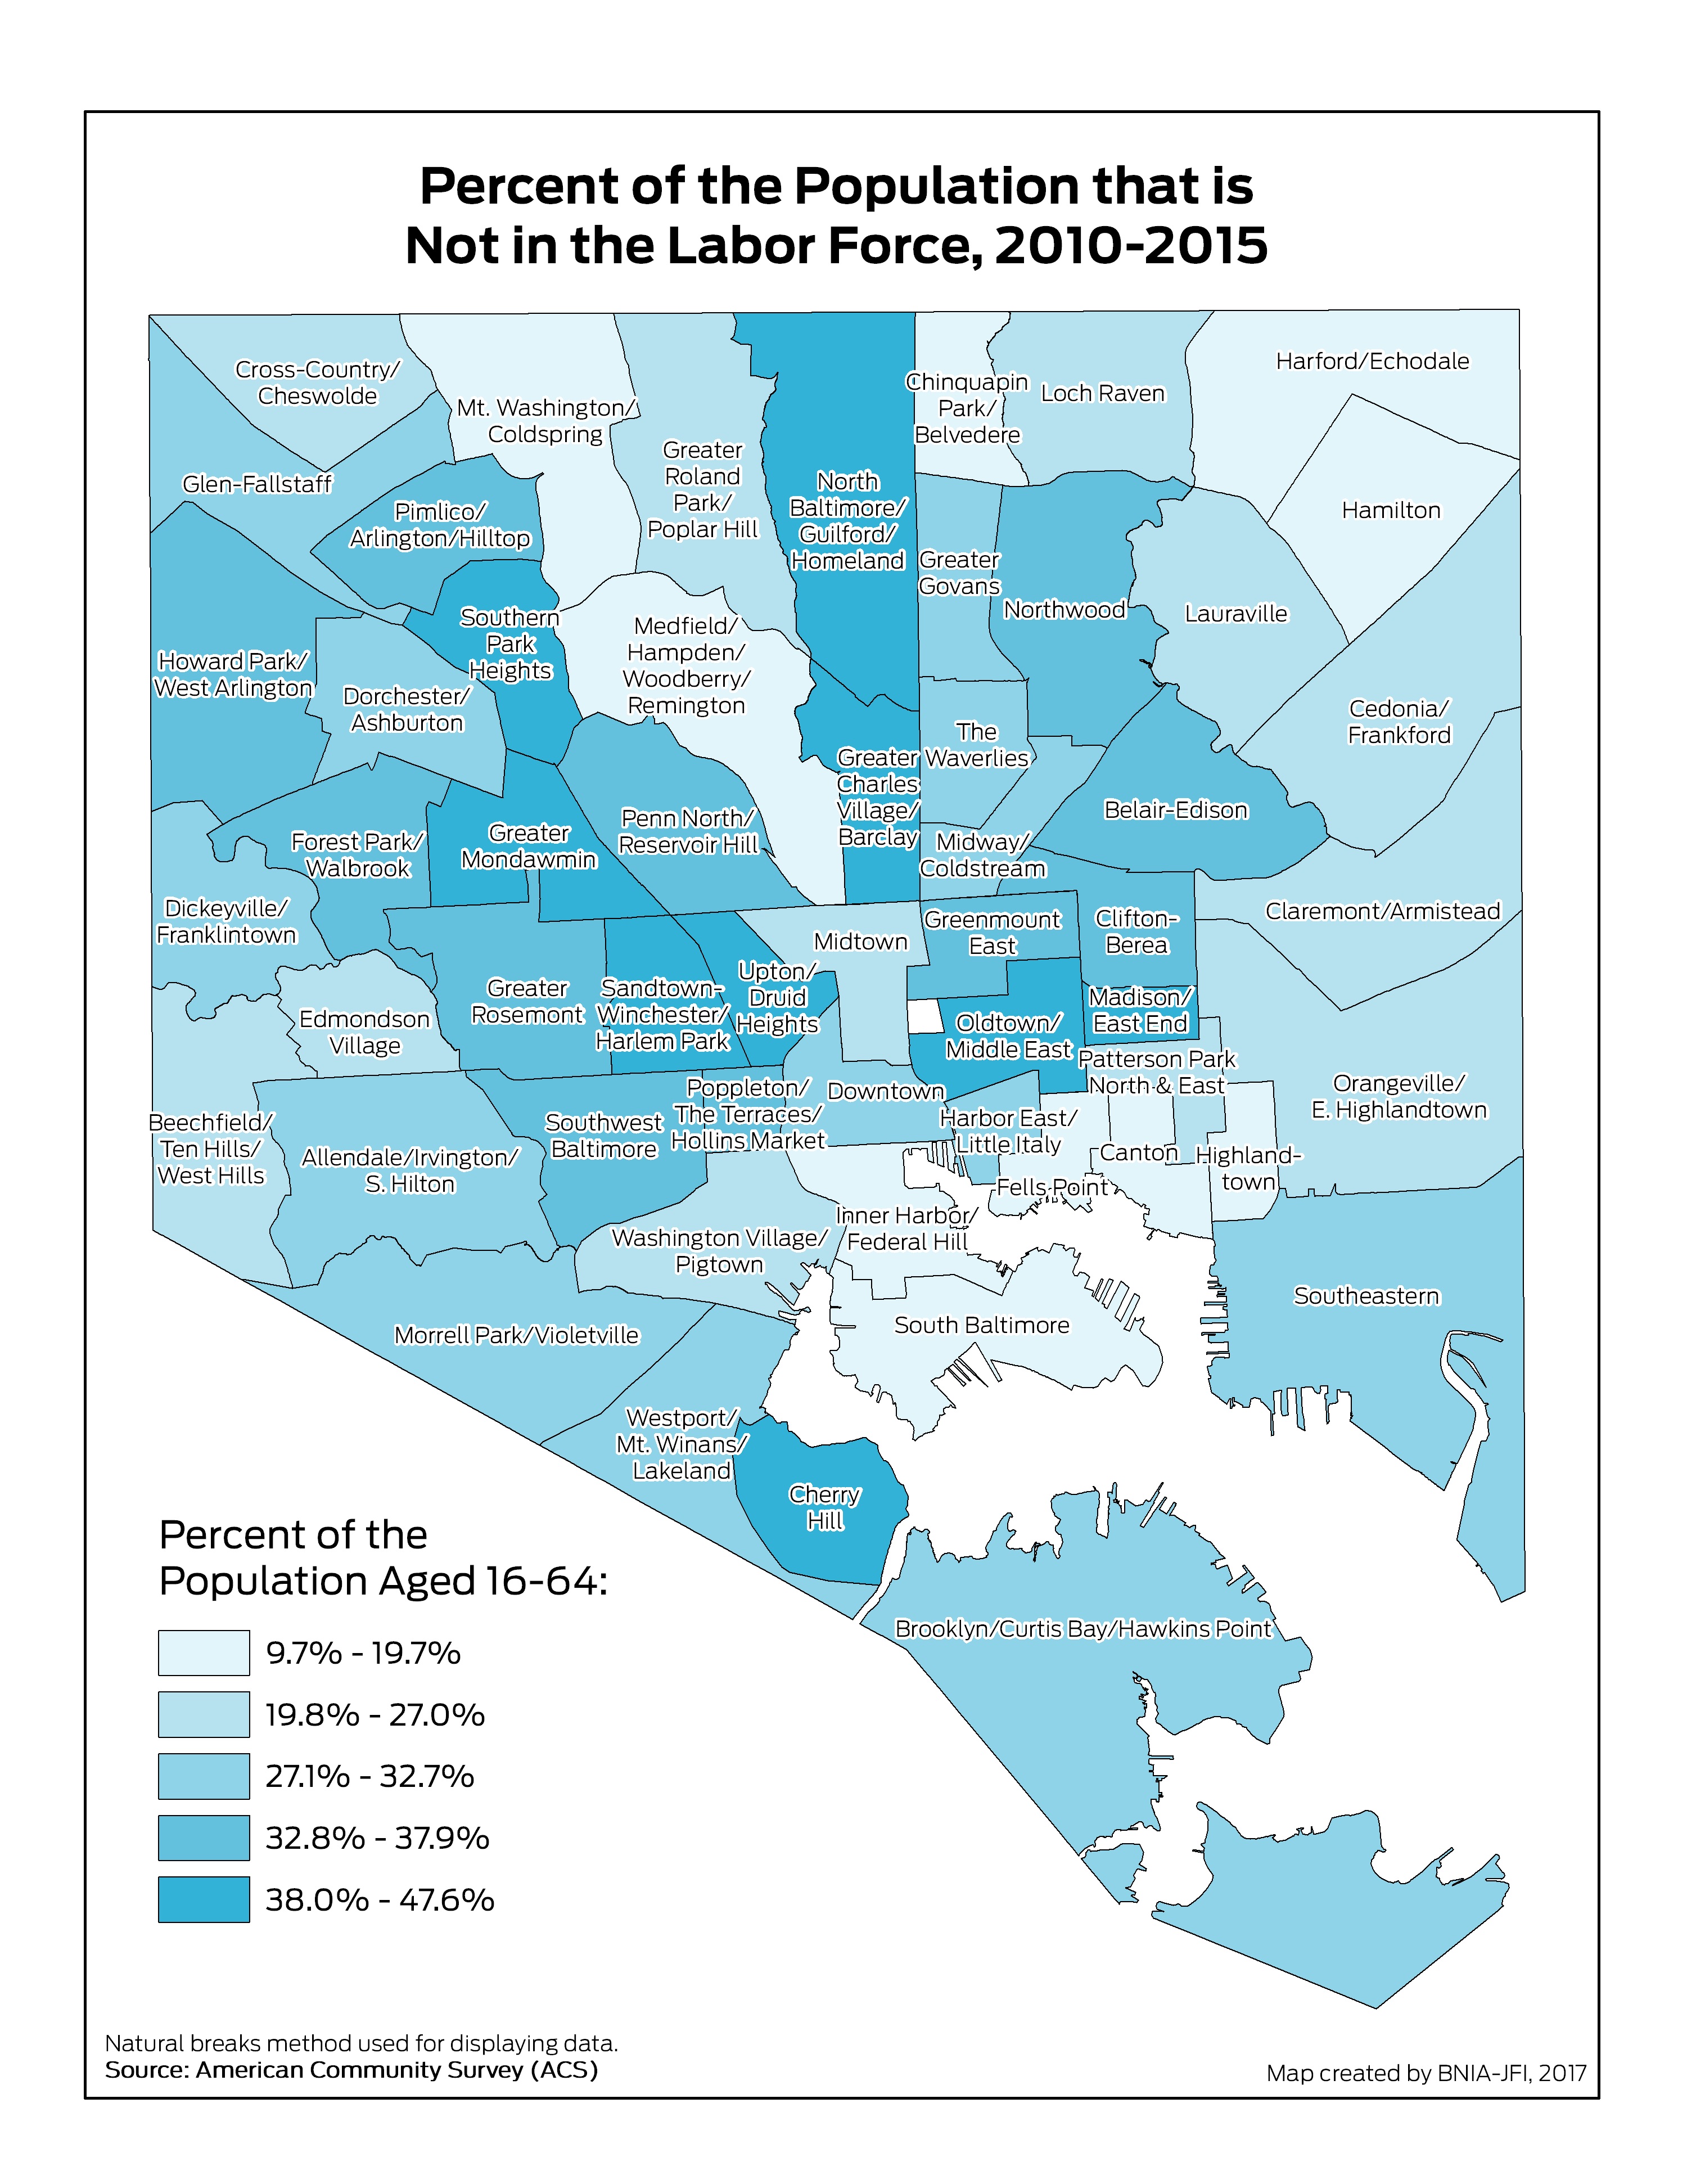
Percent Population 16-64 Not in Labor Force
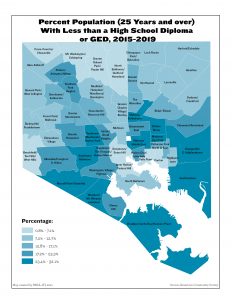
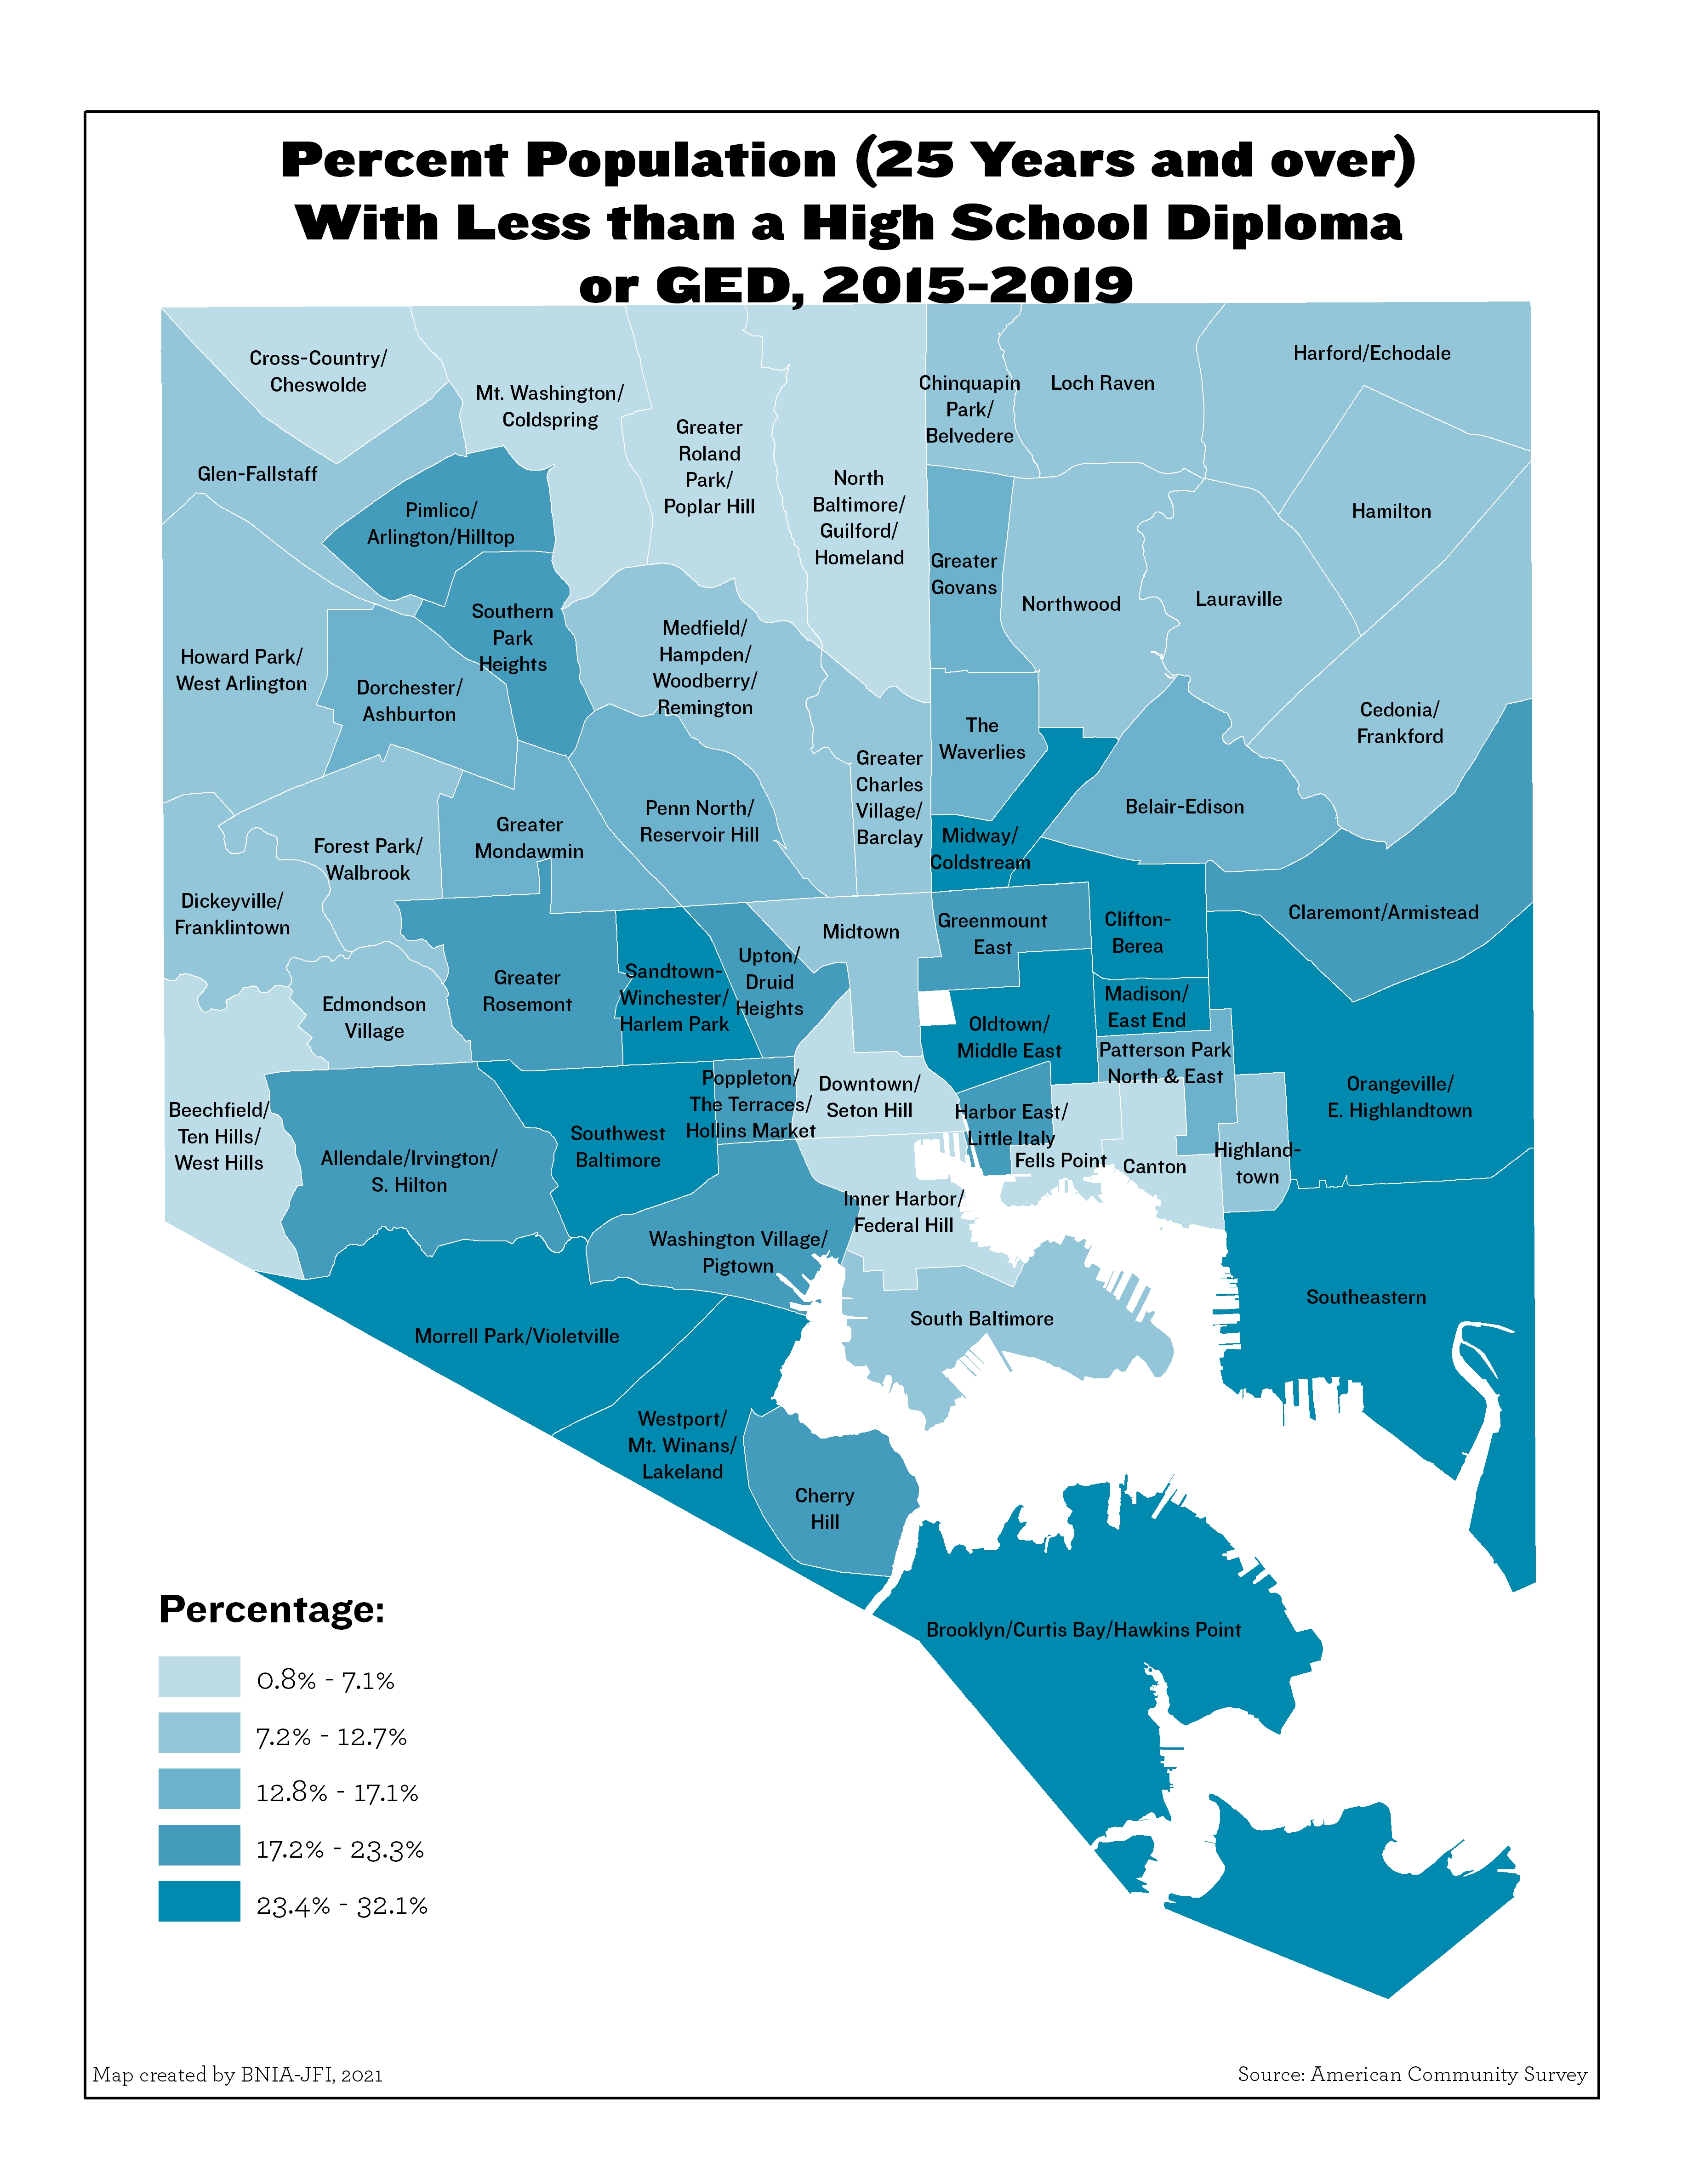
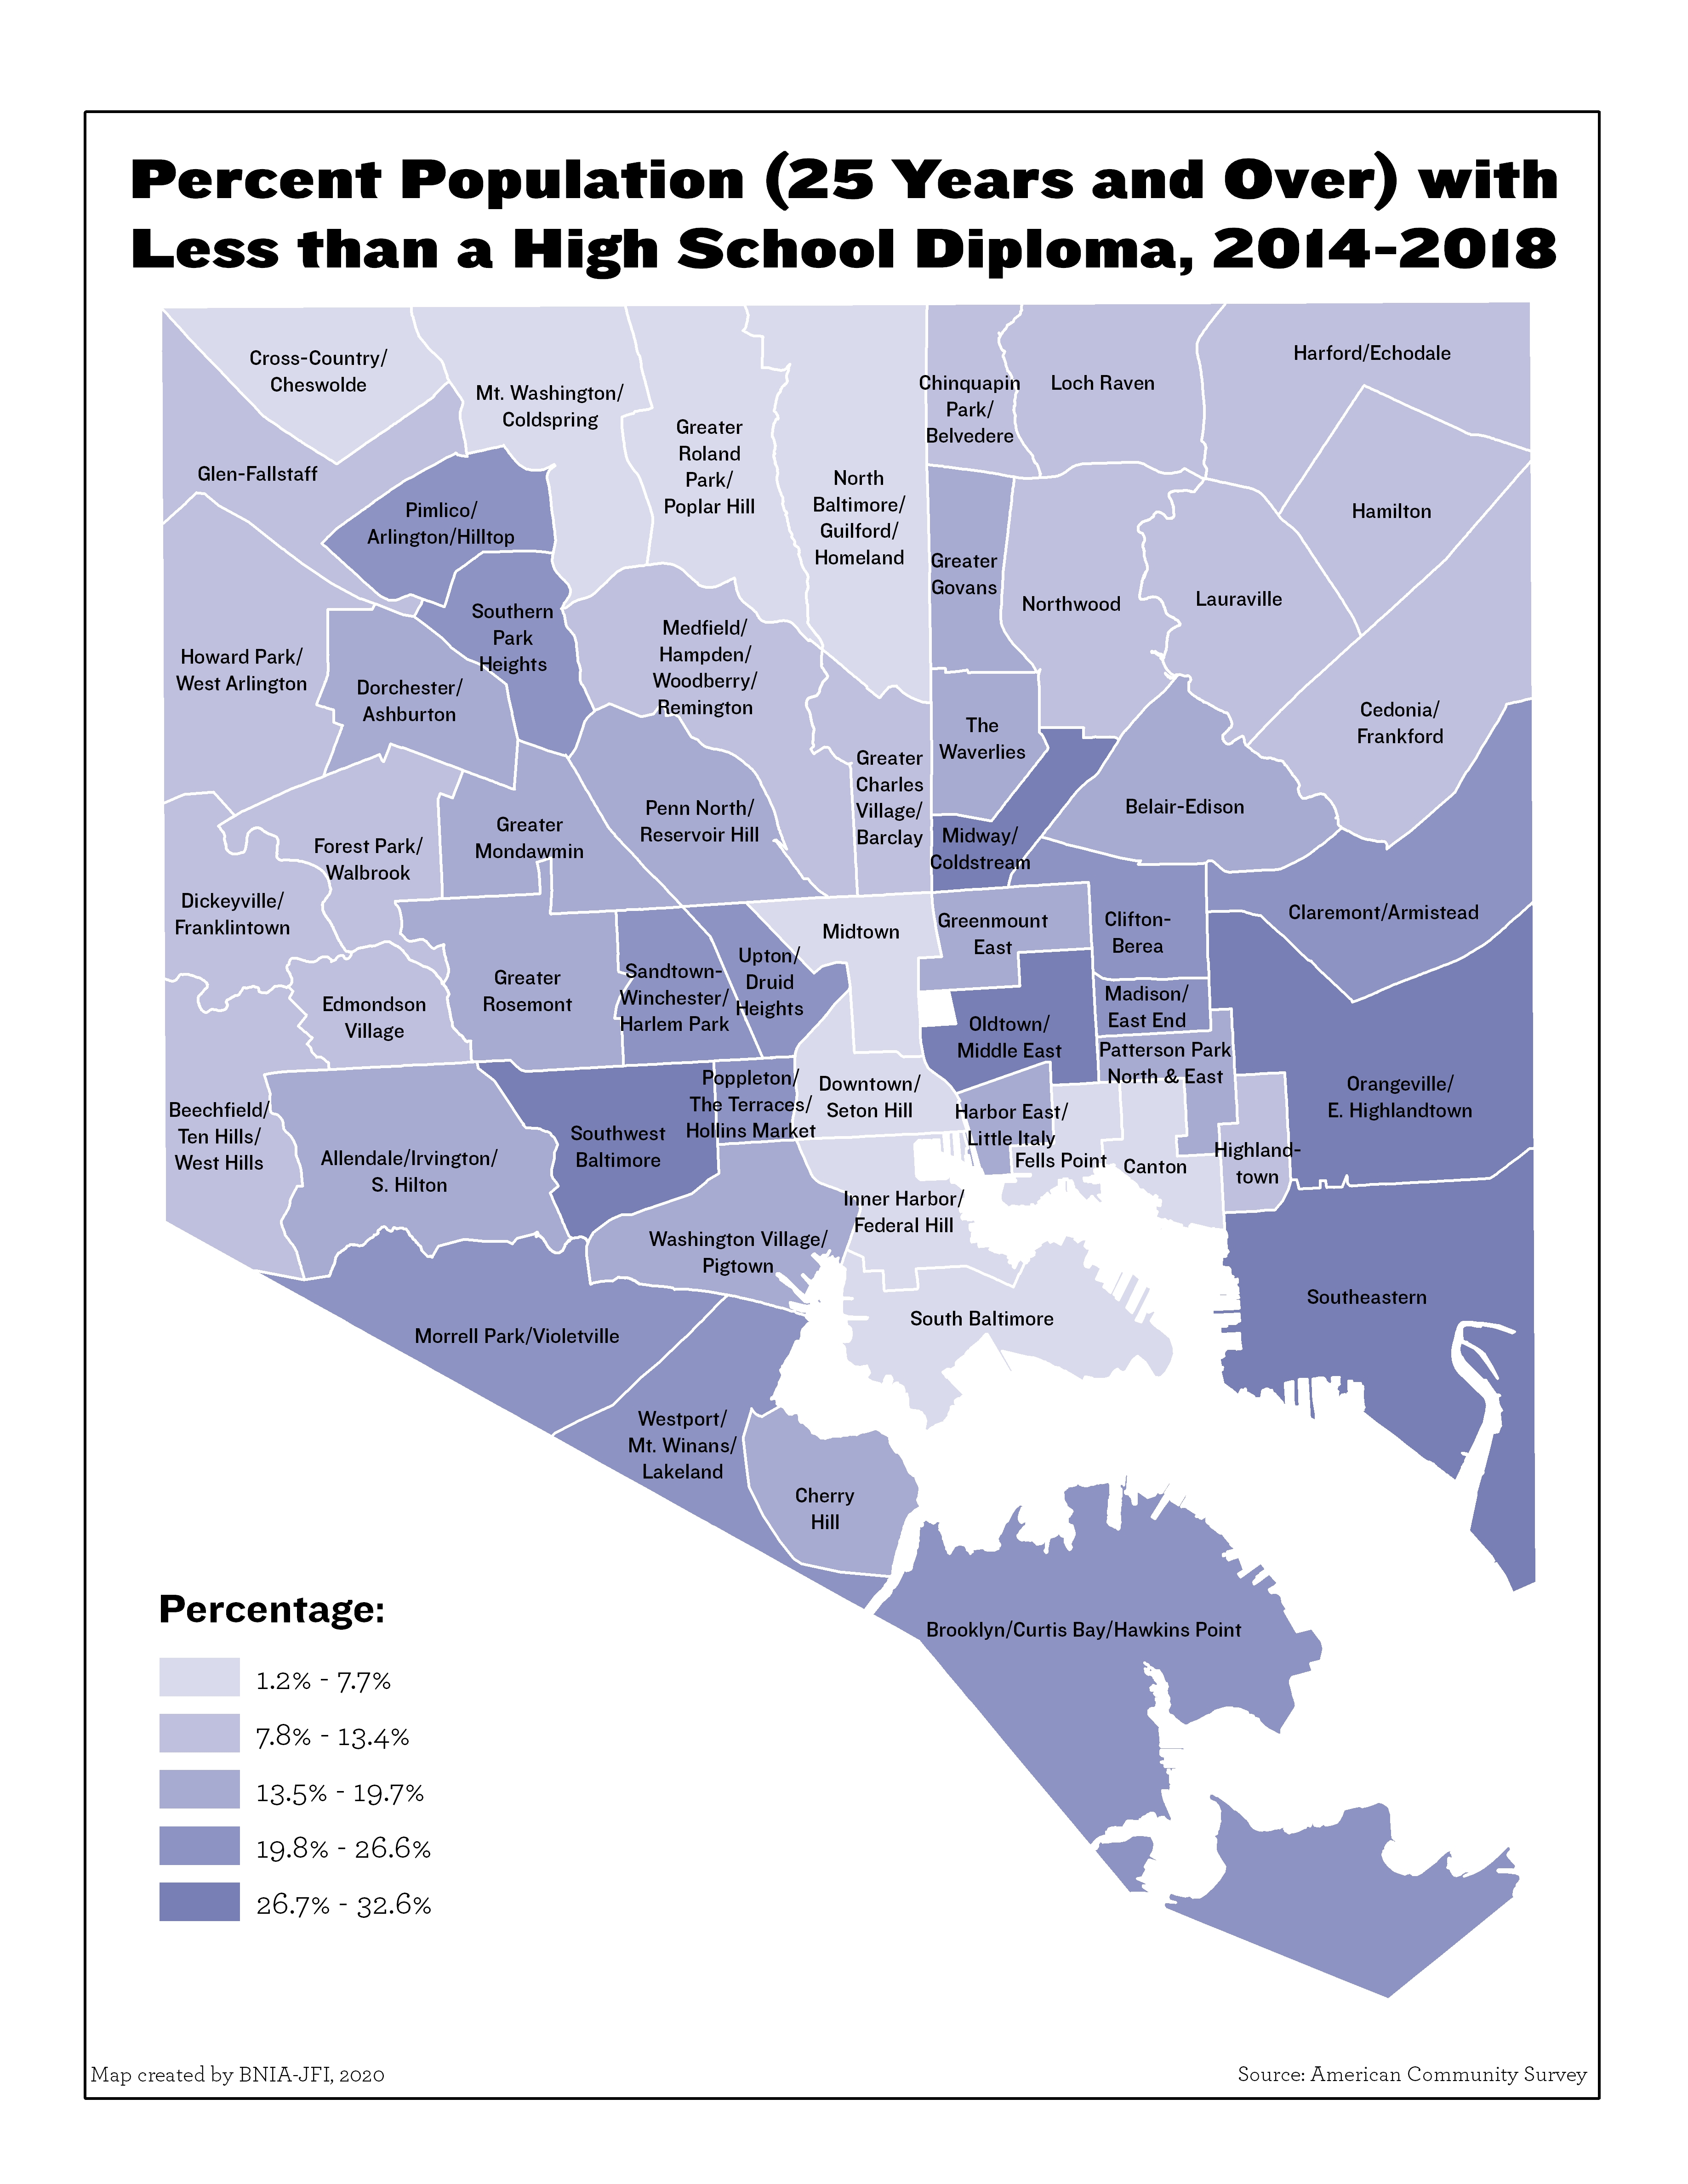
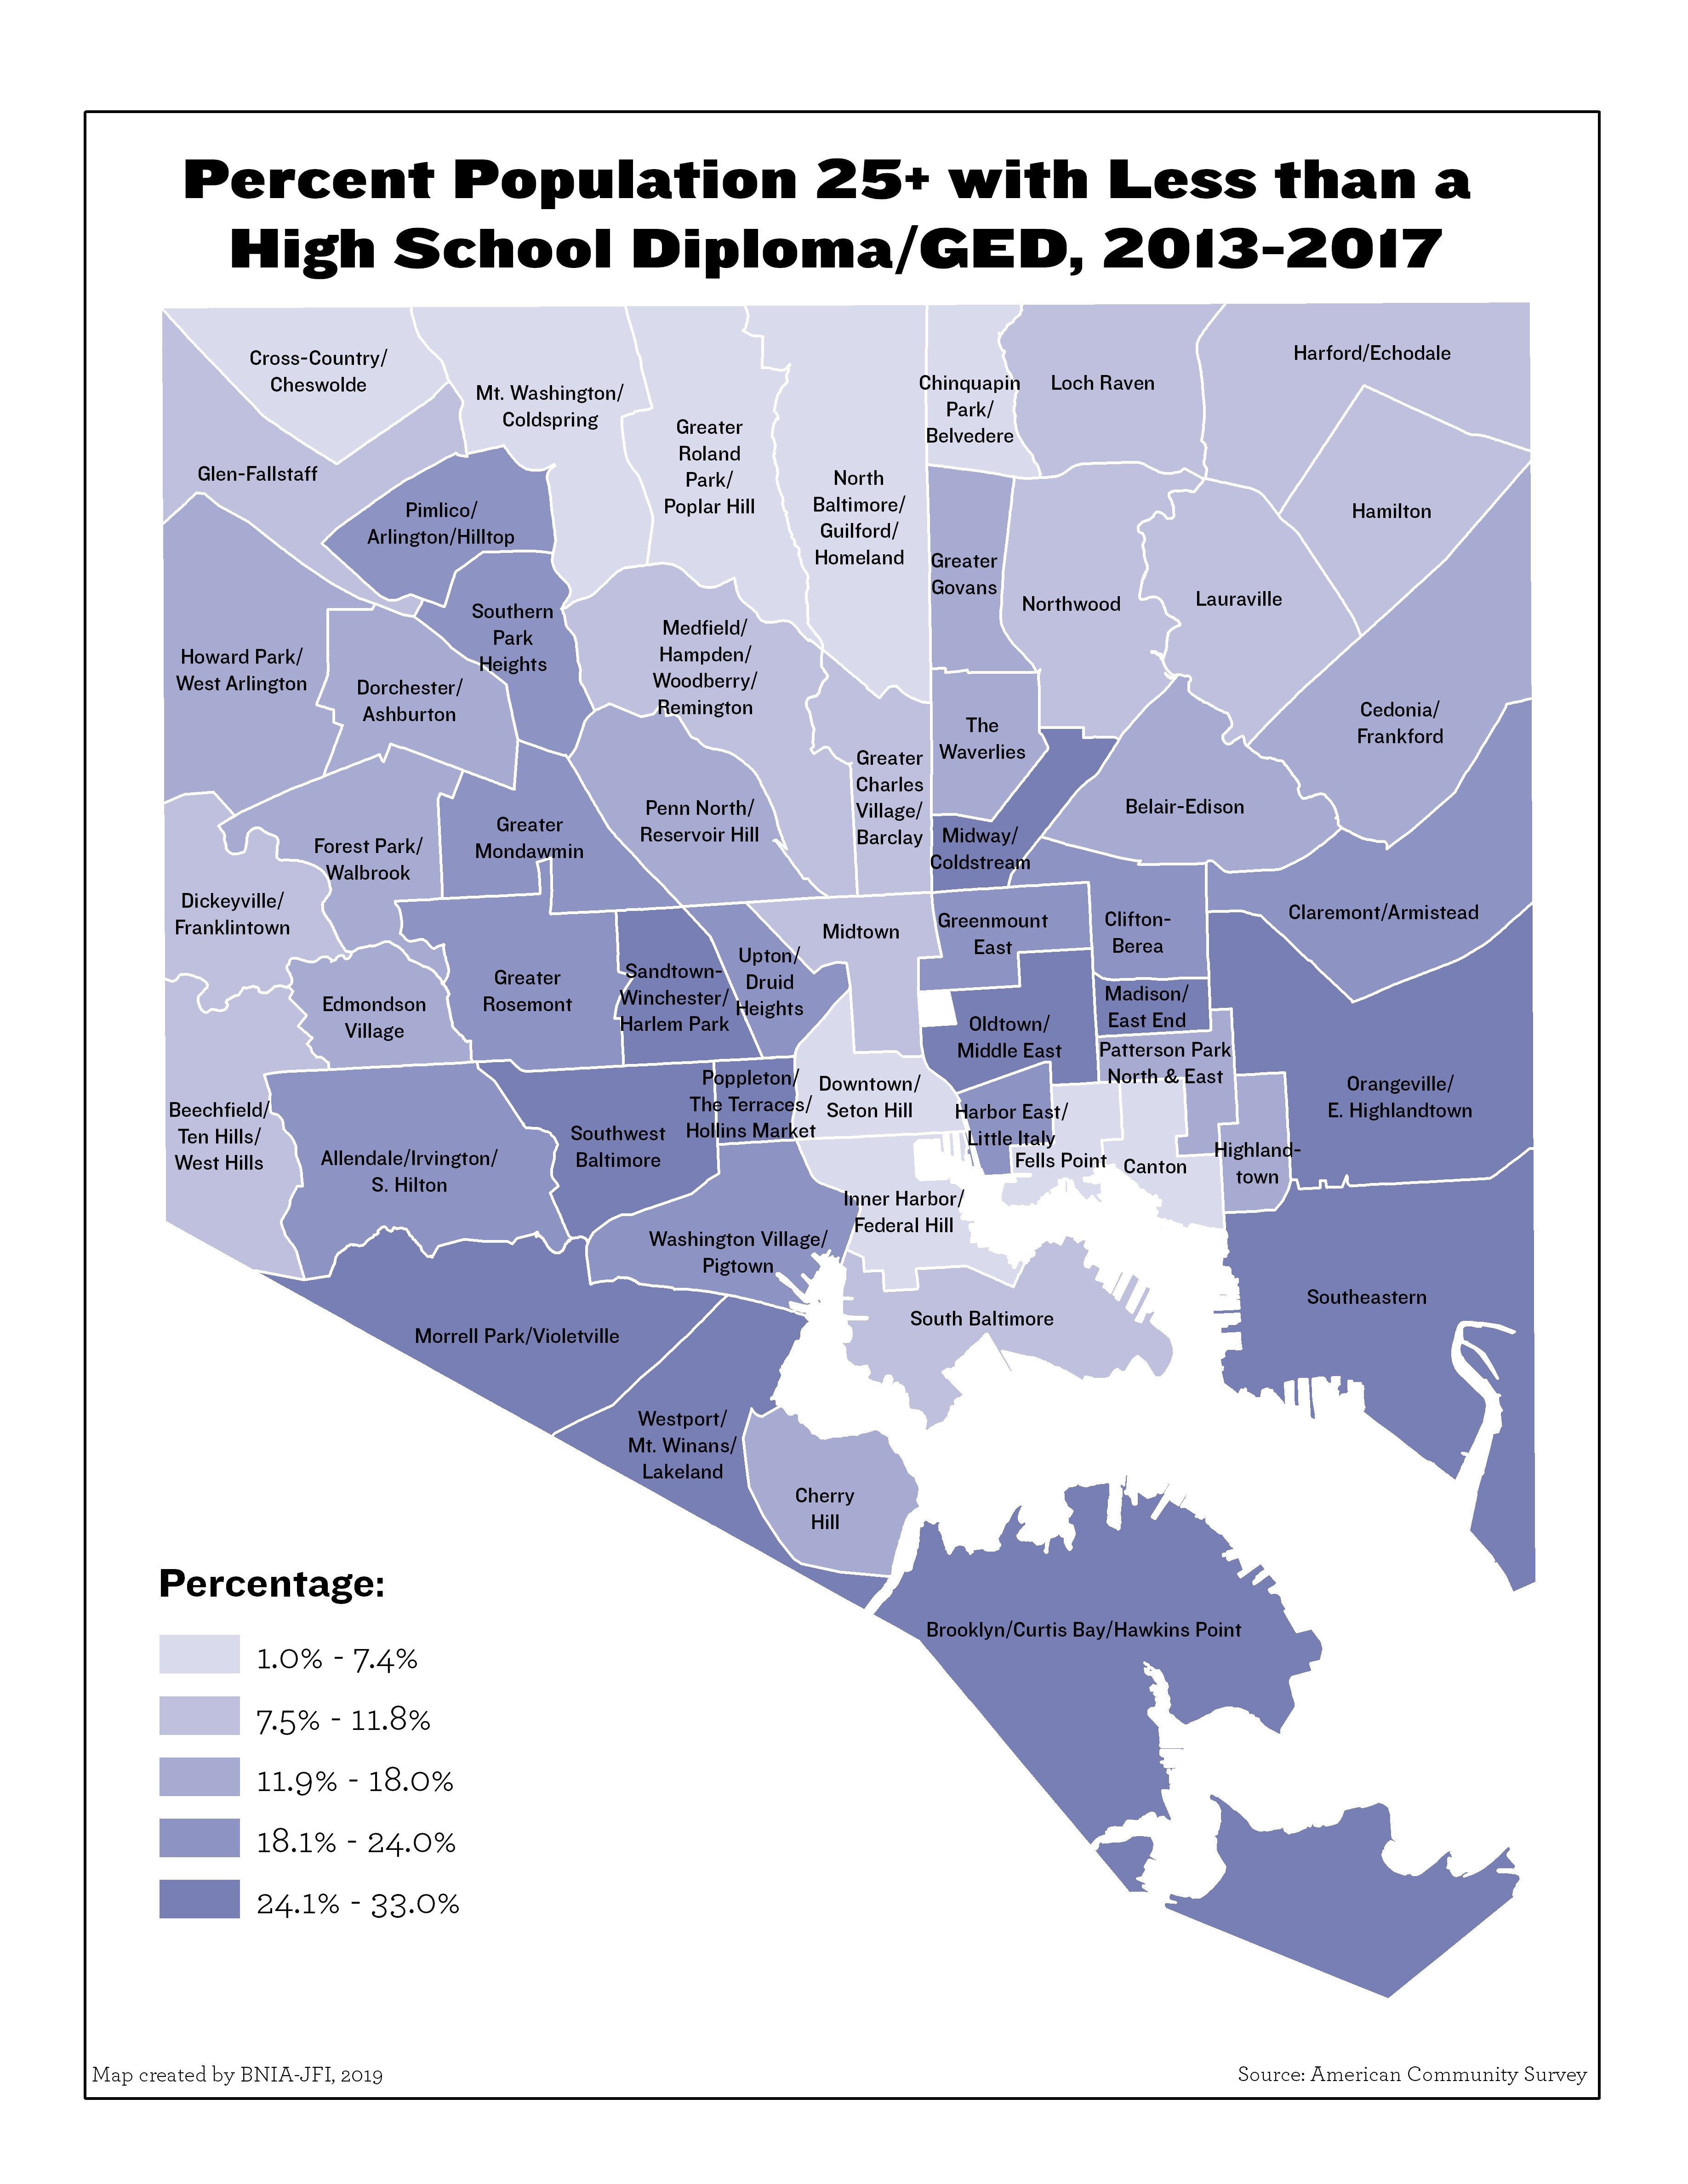
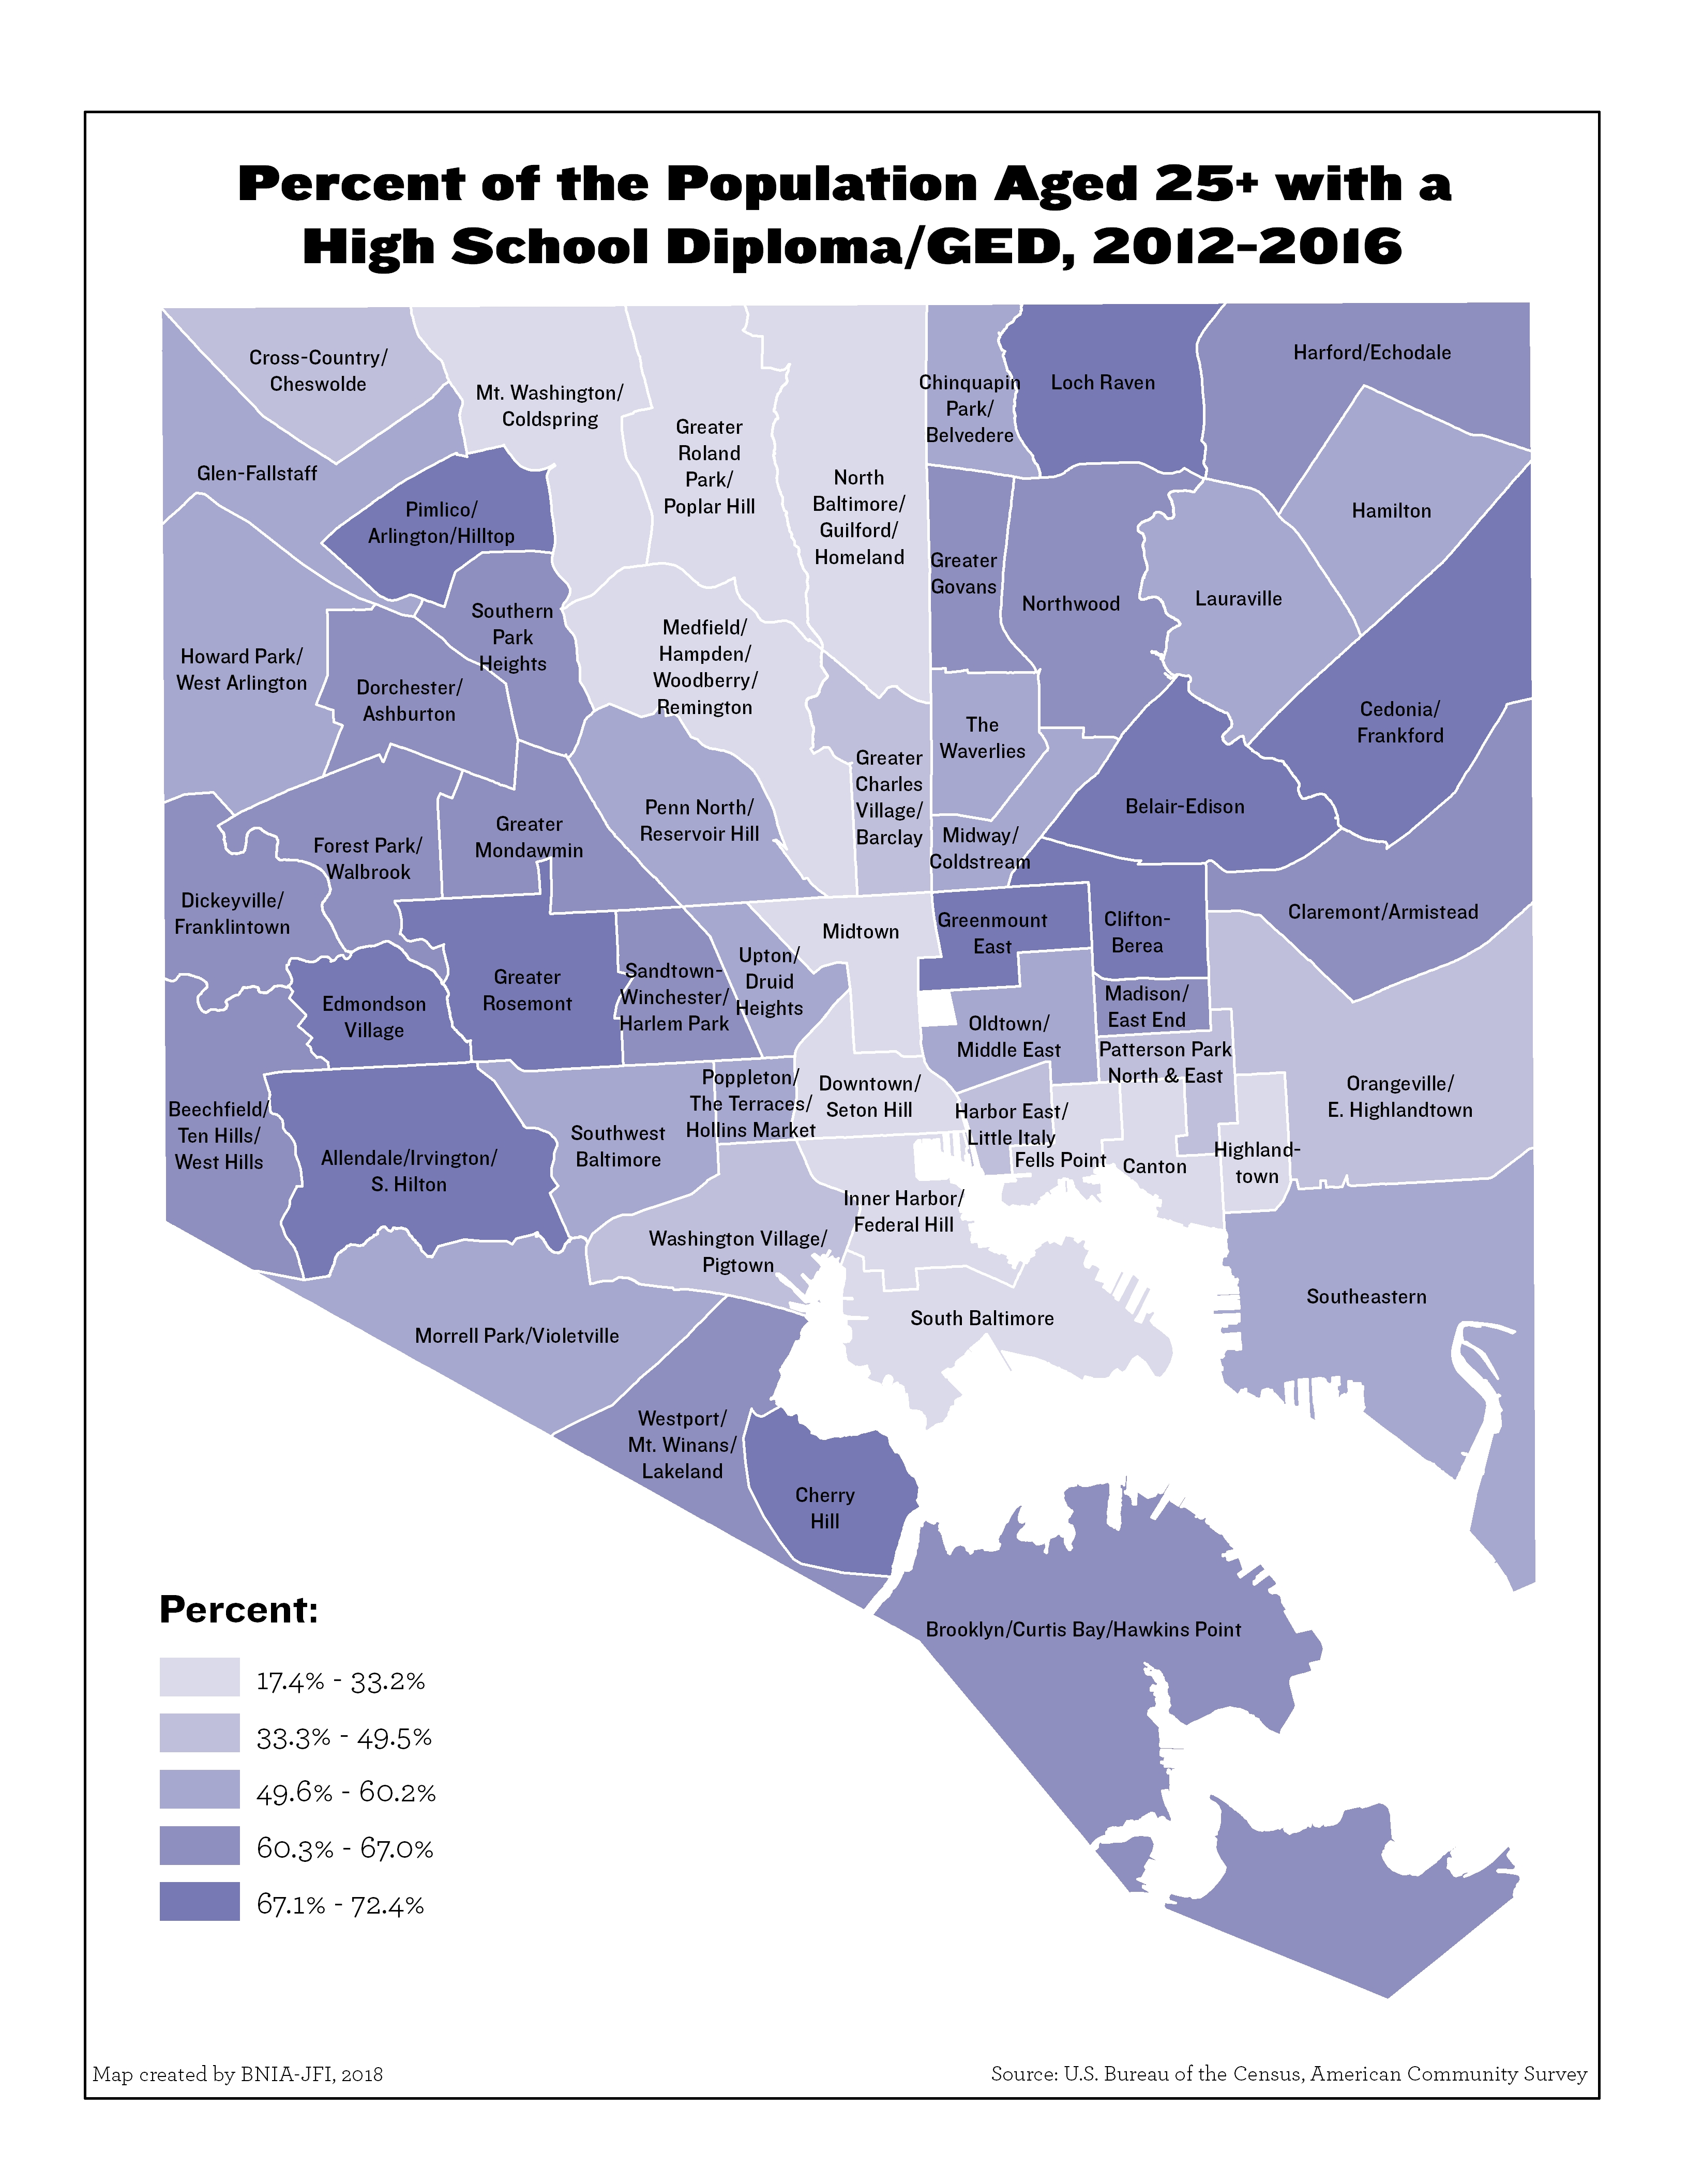
Percent Population (25 Years and over) With Less Than a High School Diploma or GED
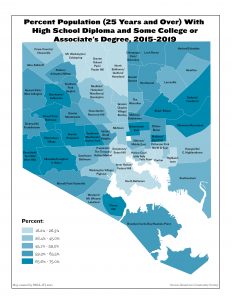
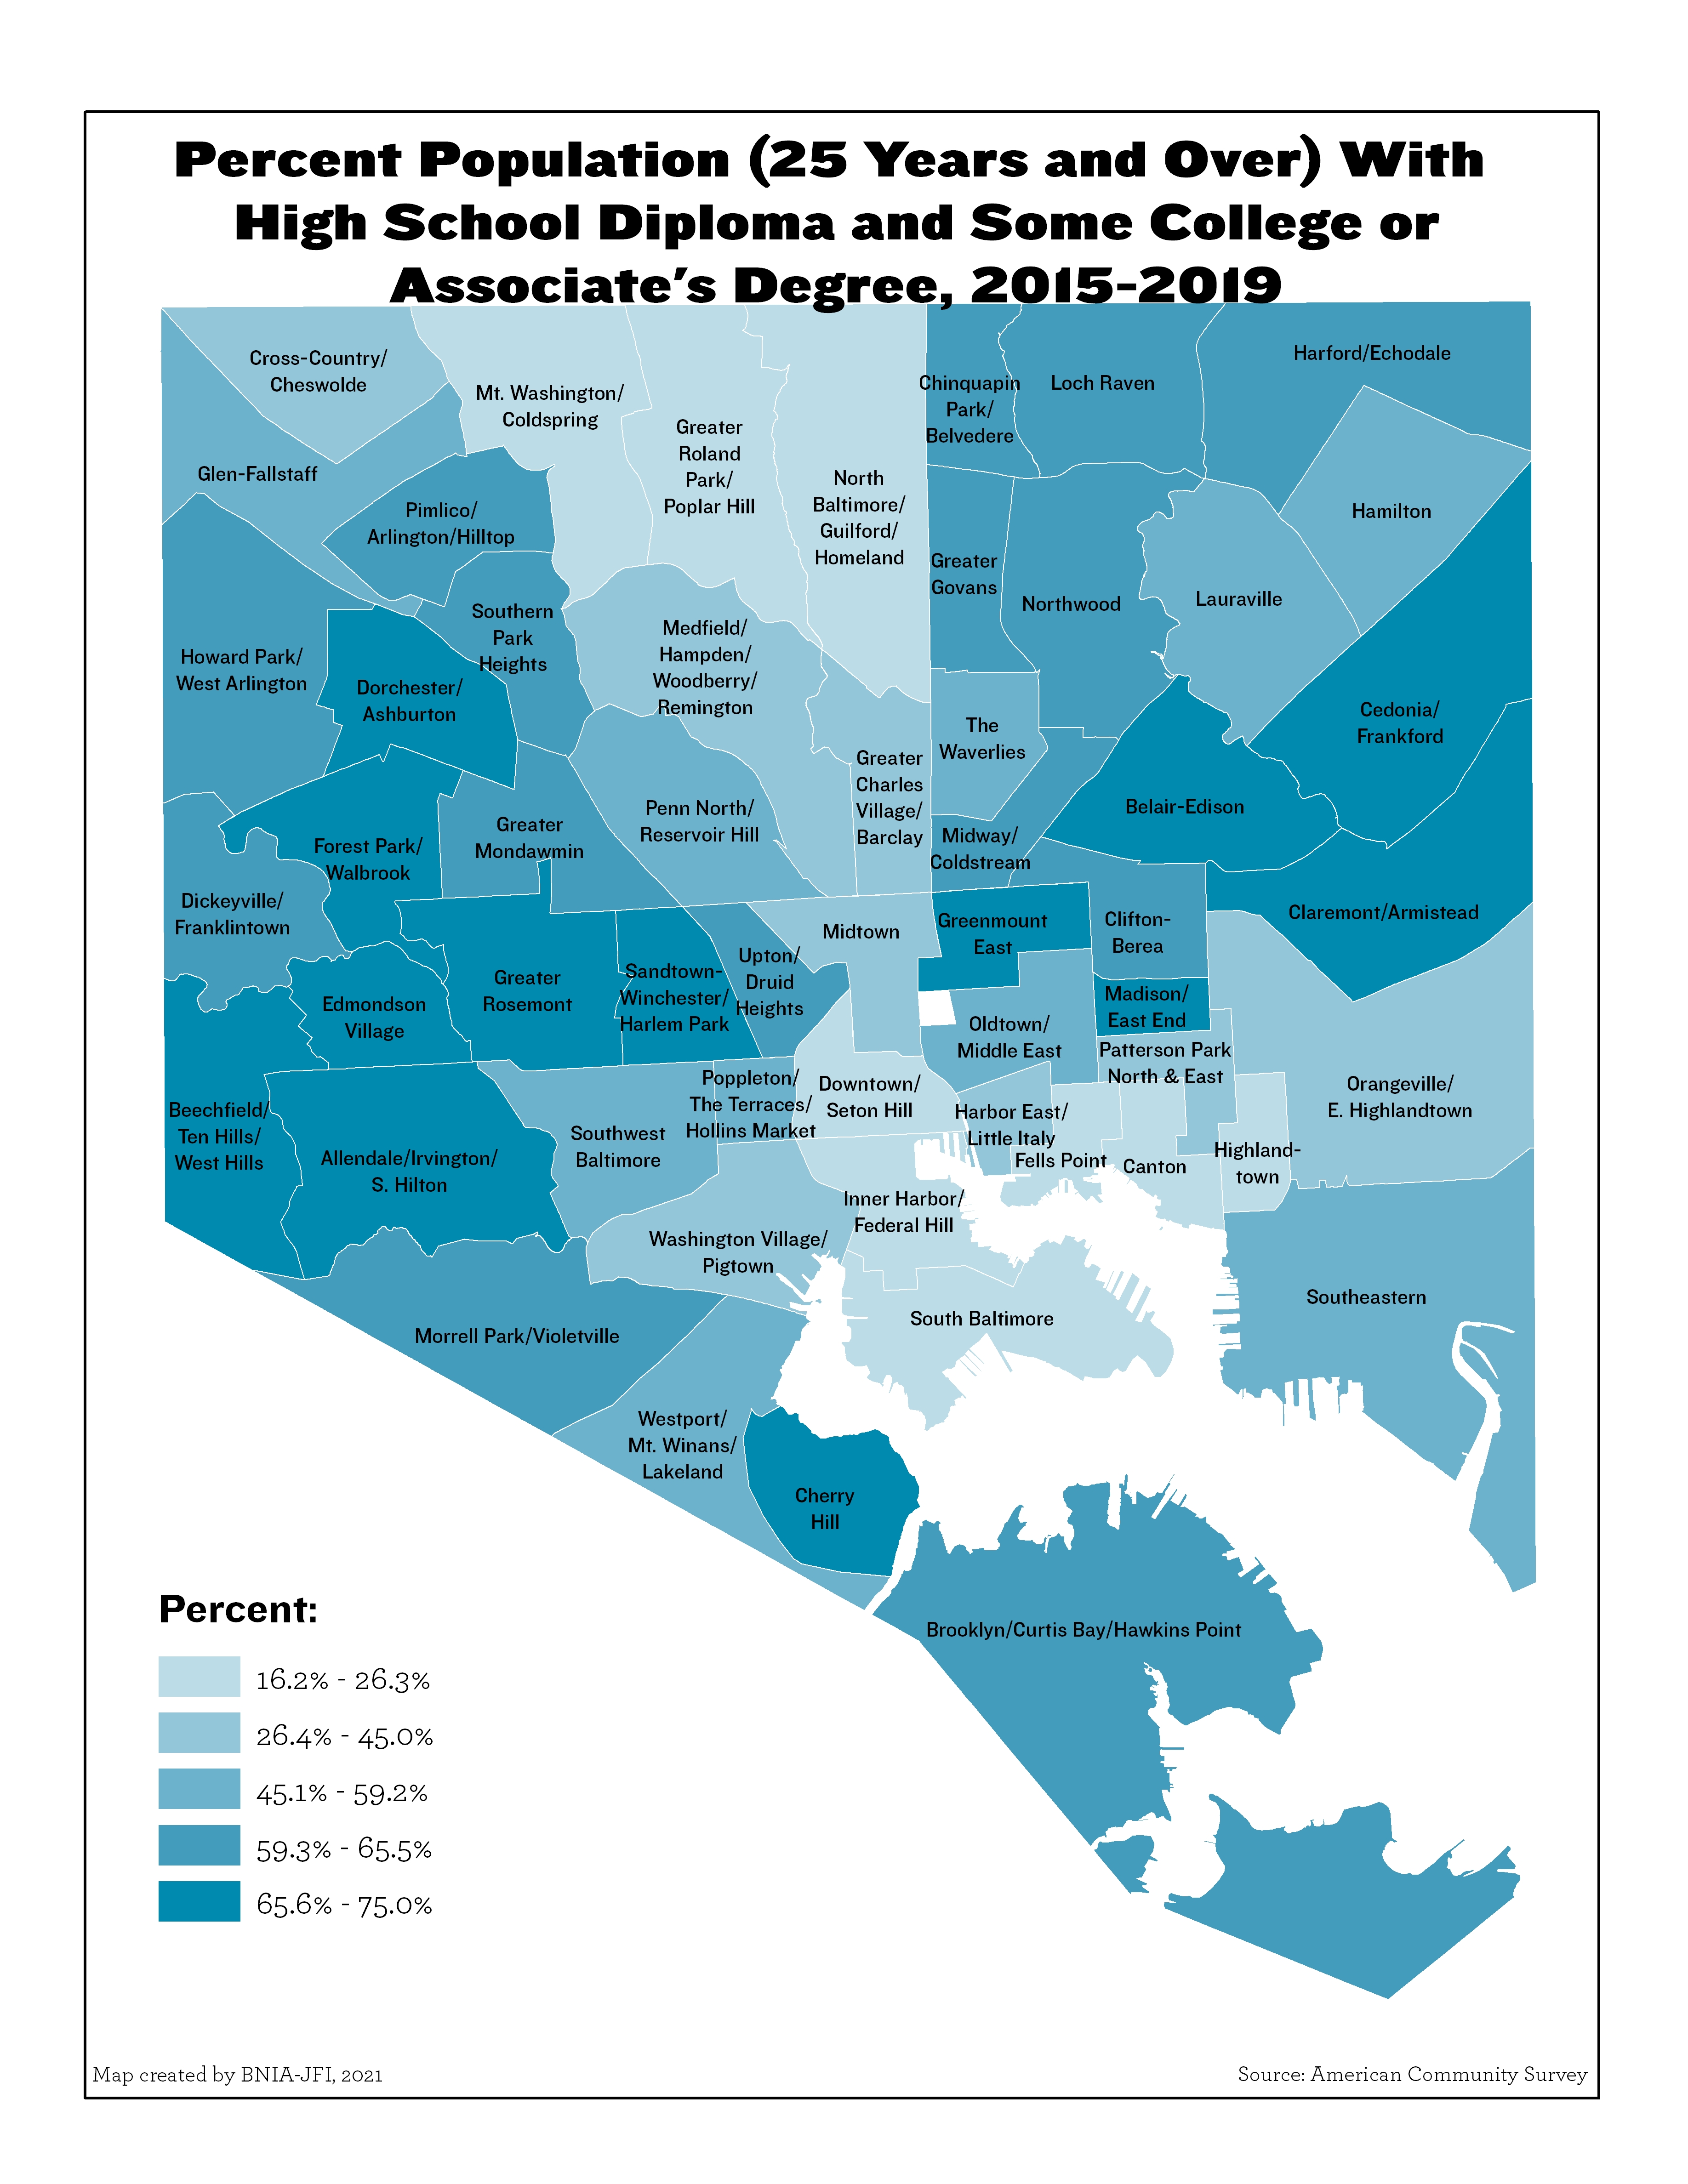
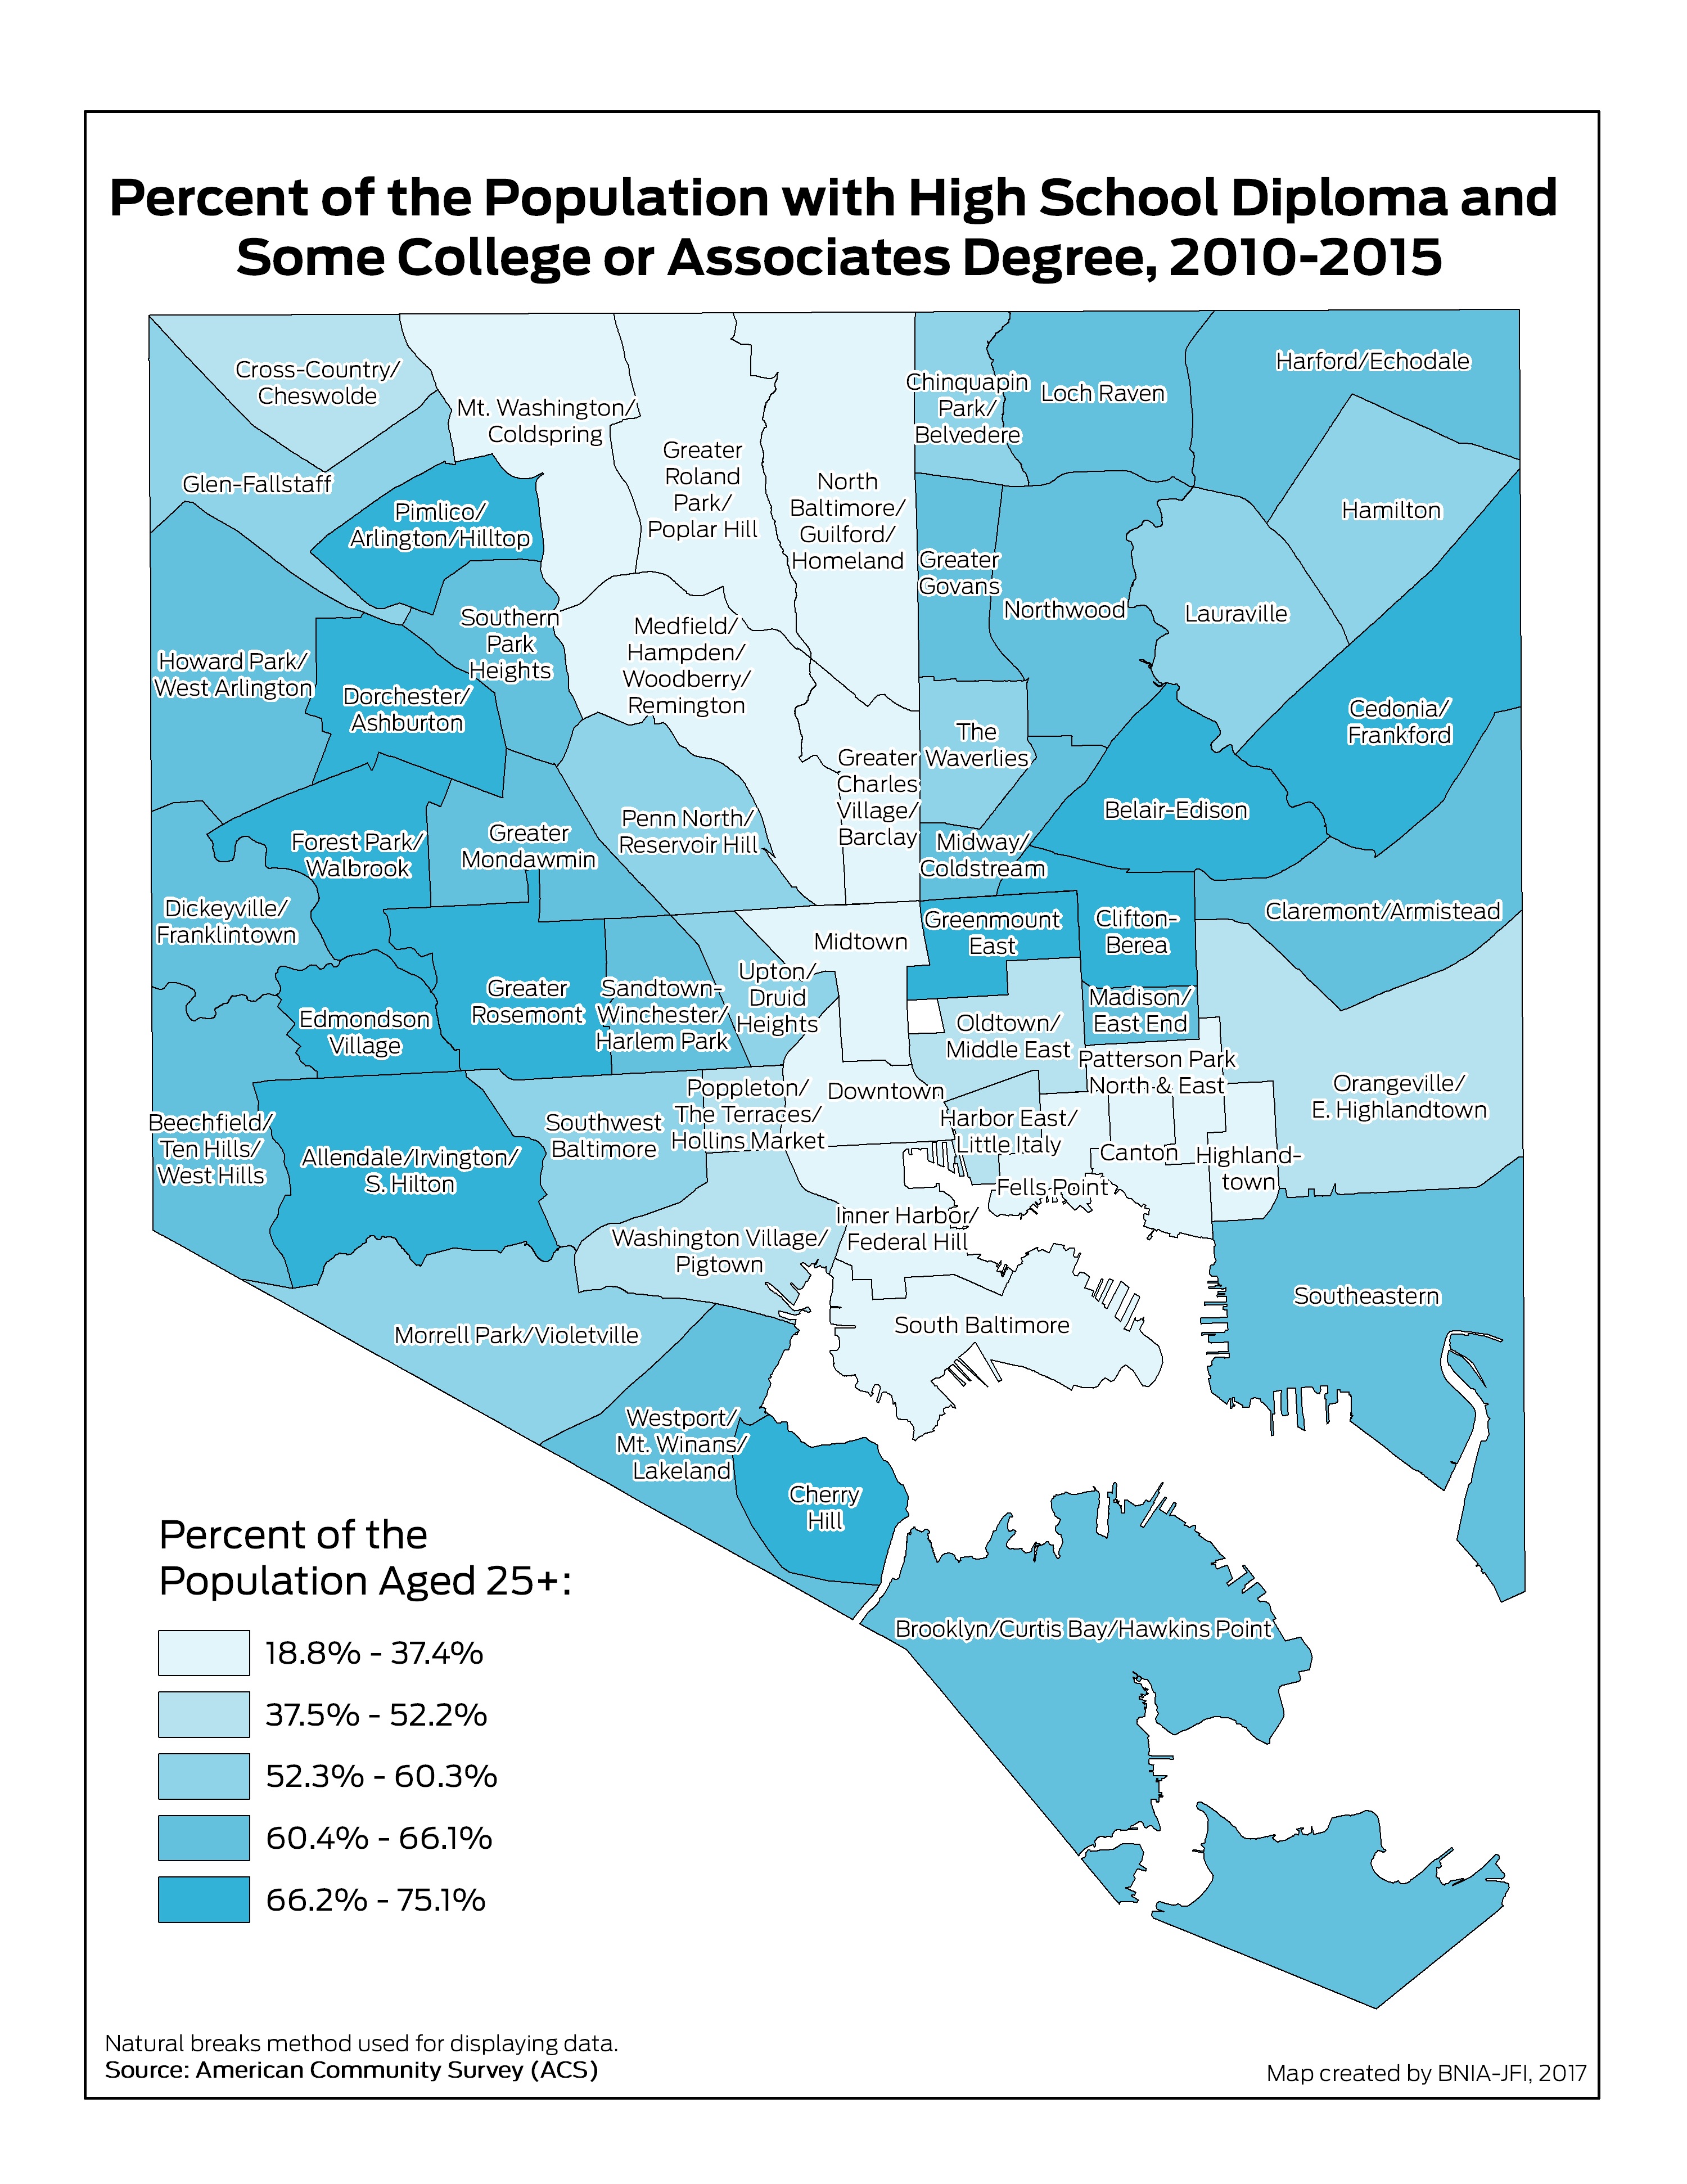
Percent Population (25 Years and over) With High School Diploma and Some College or Associates Degree
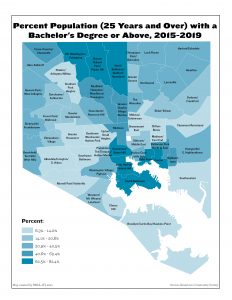
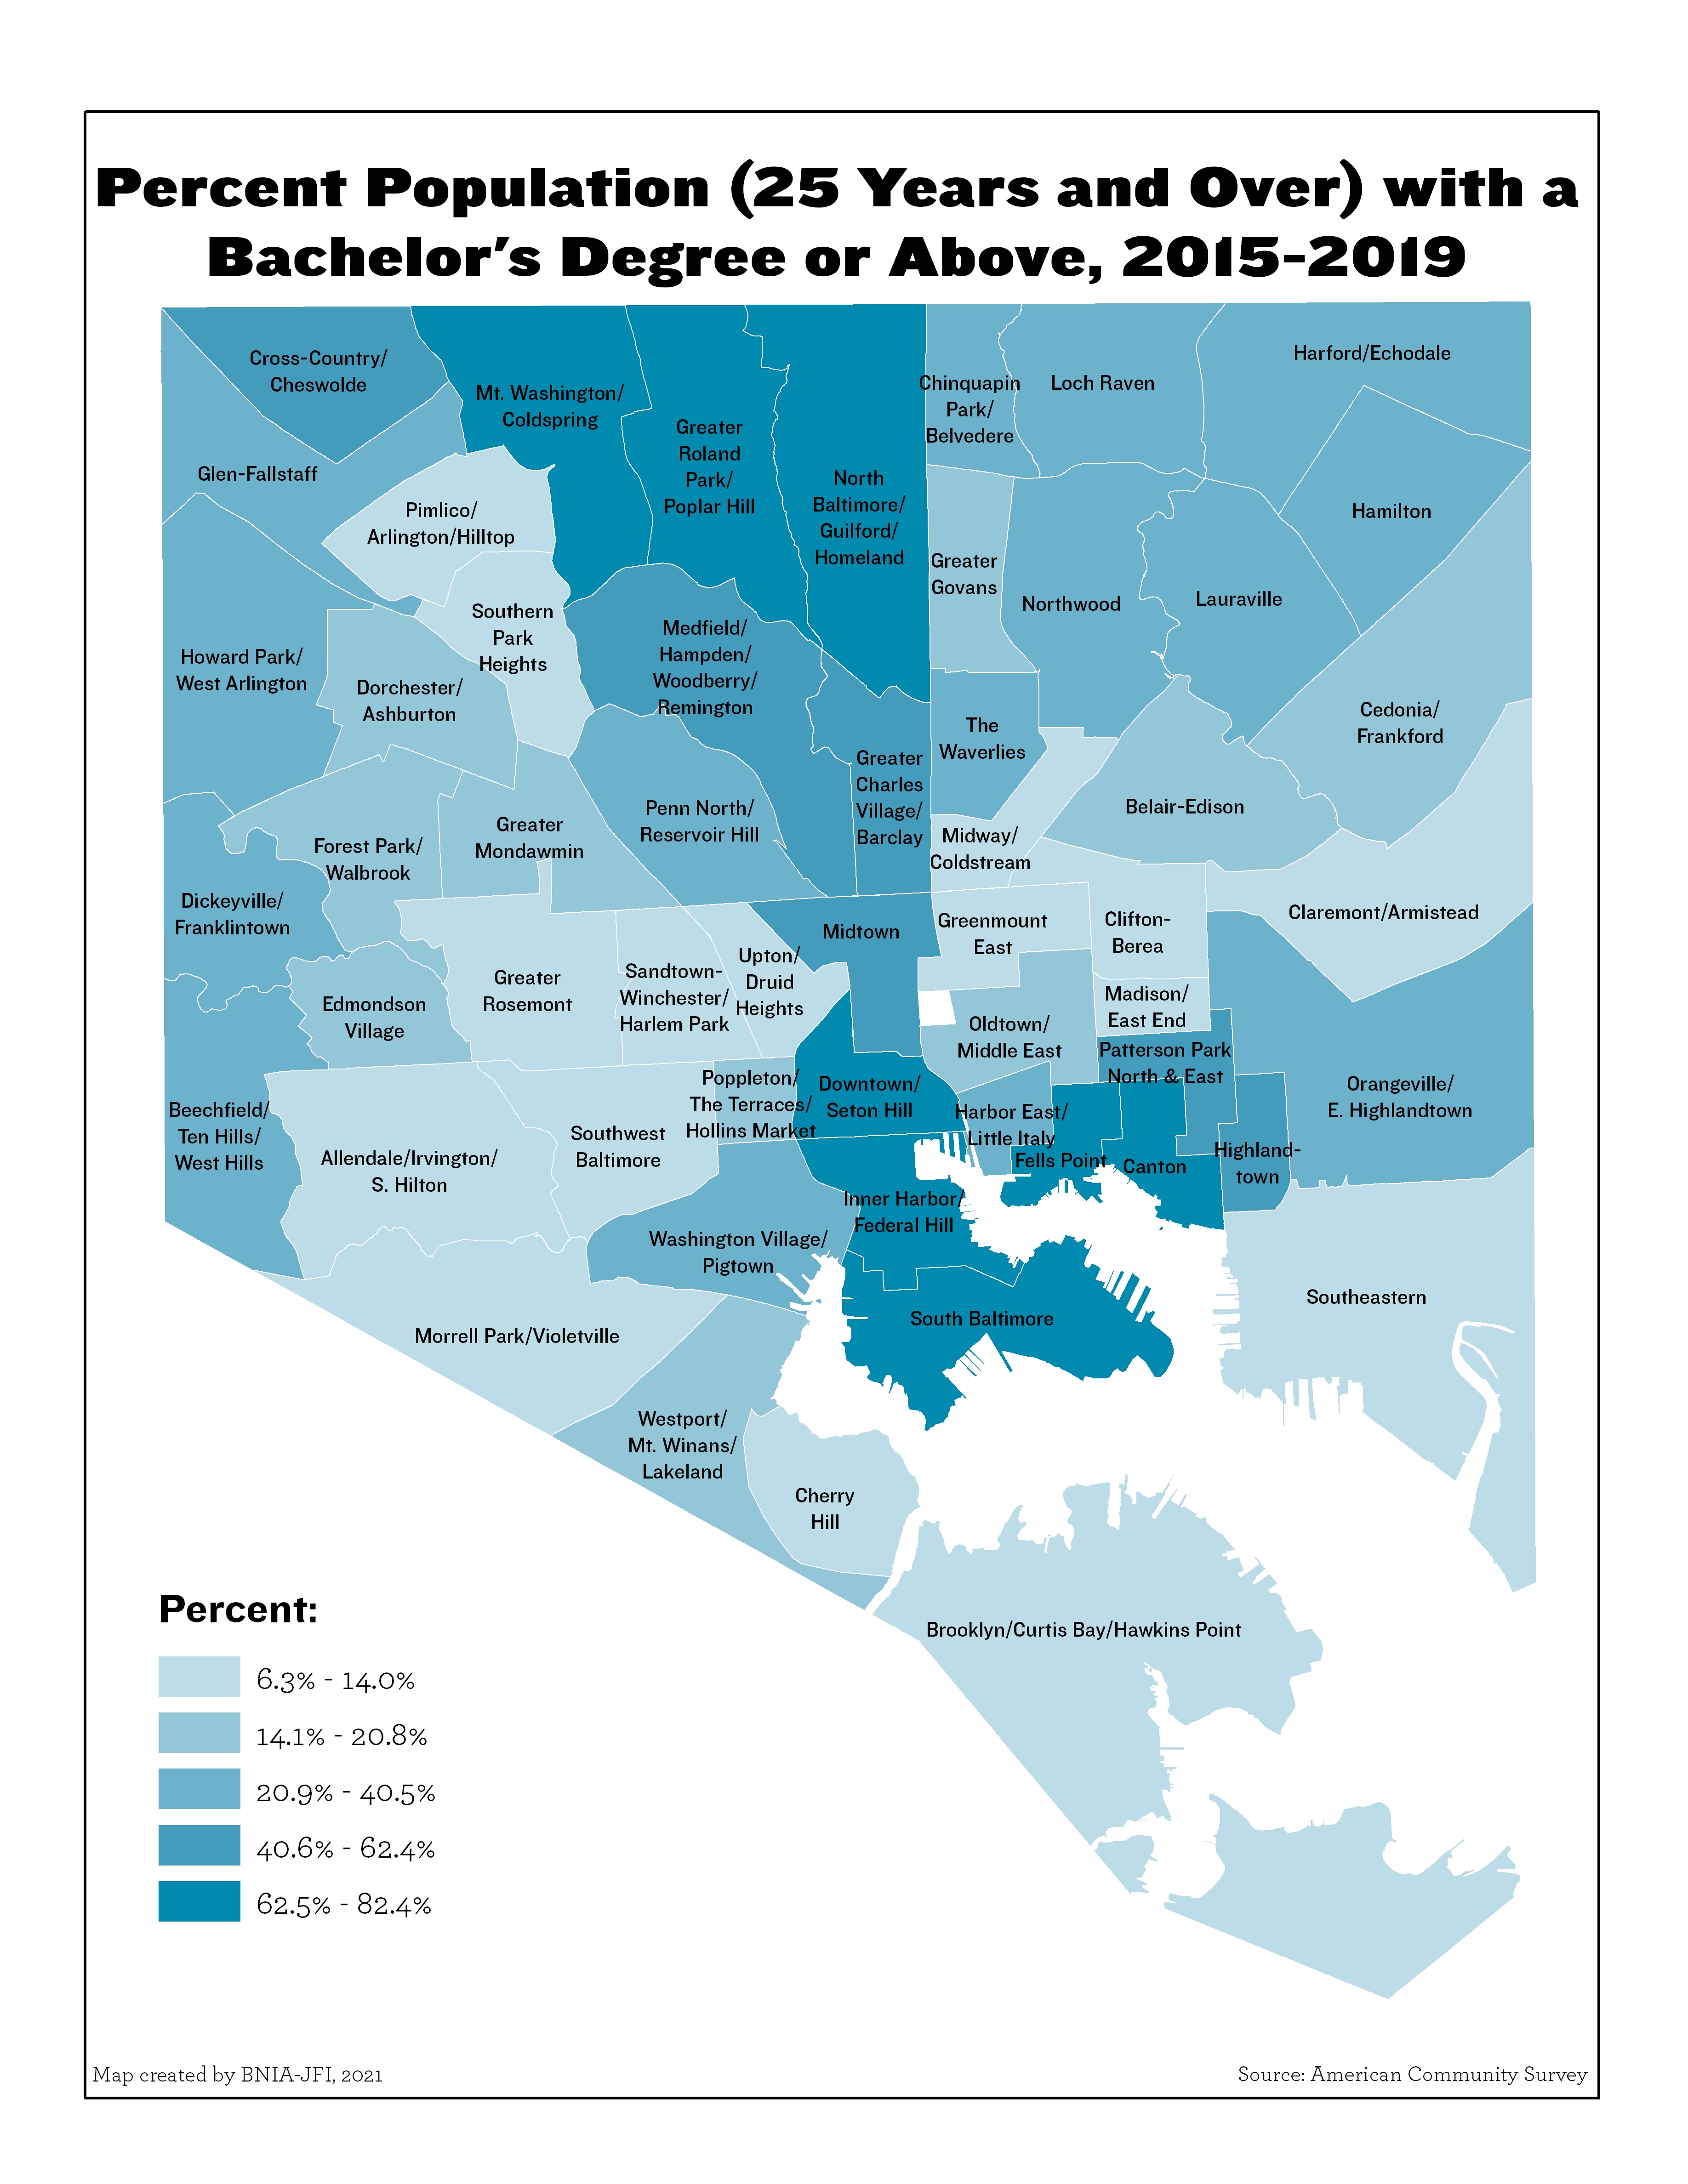
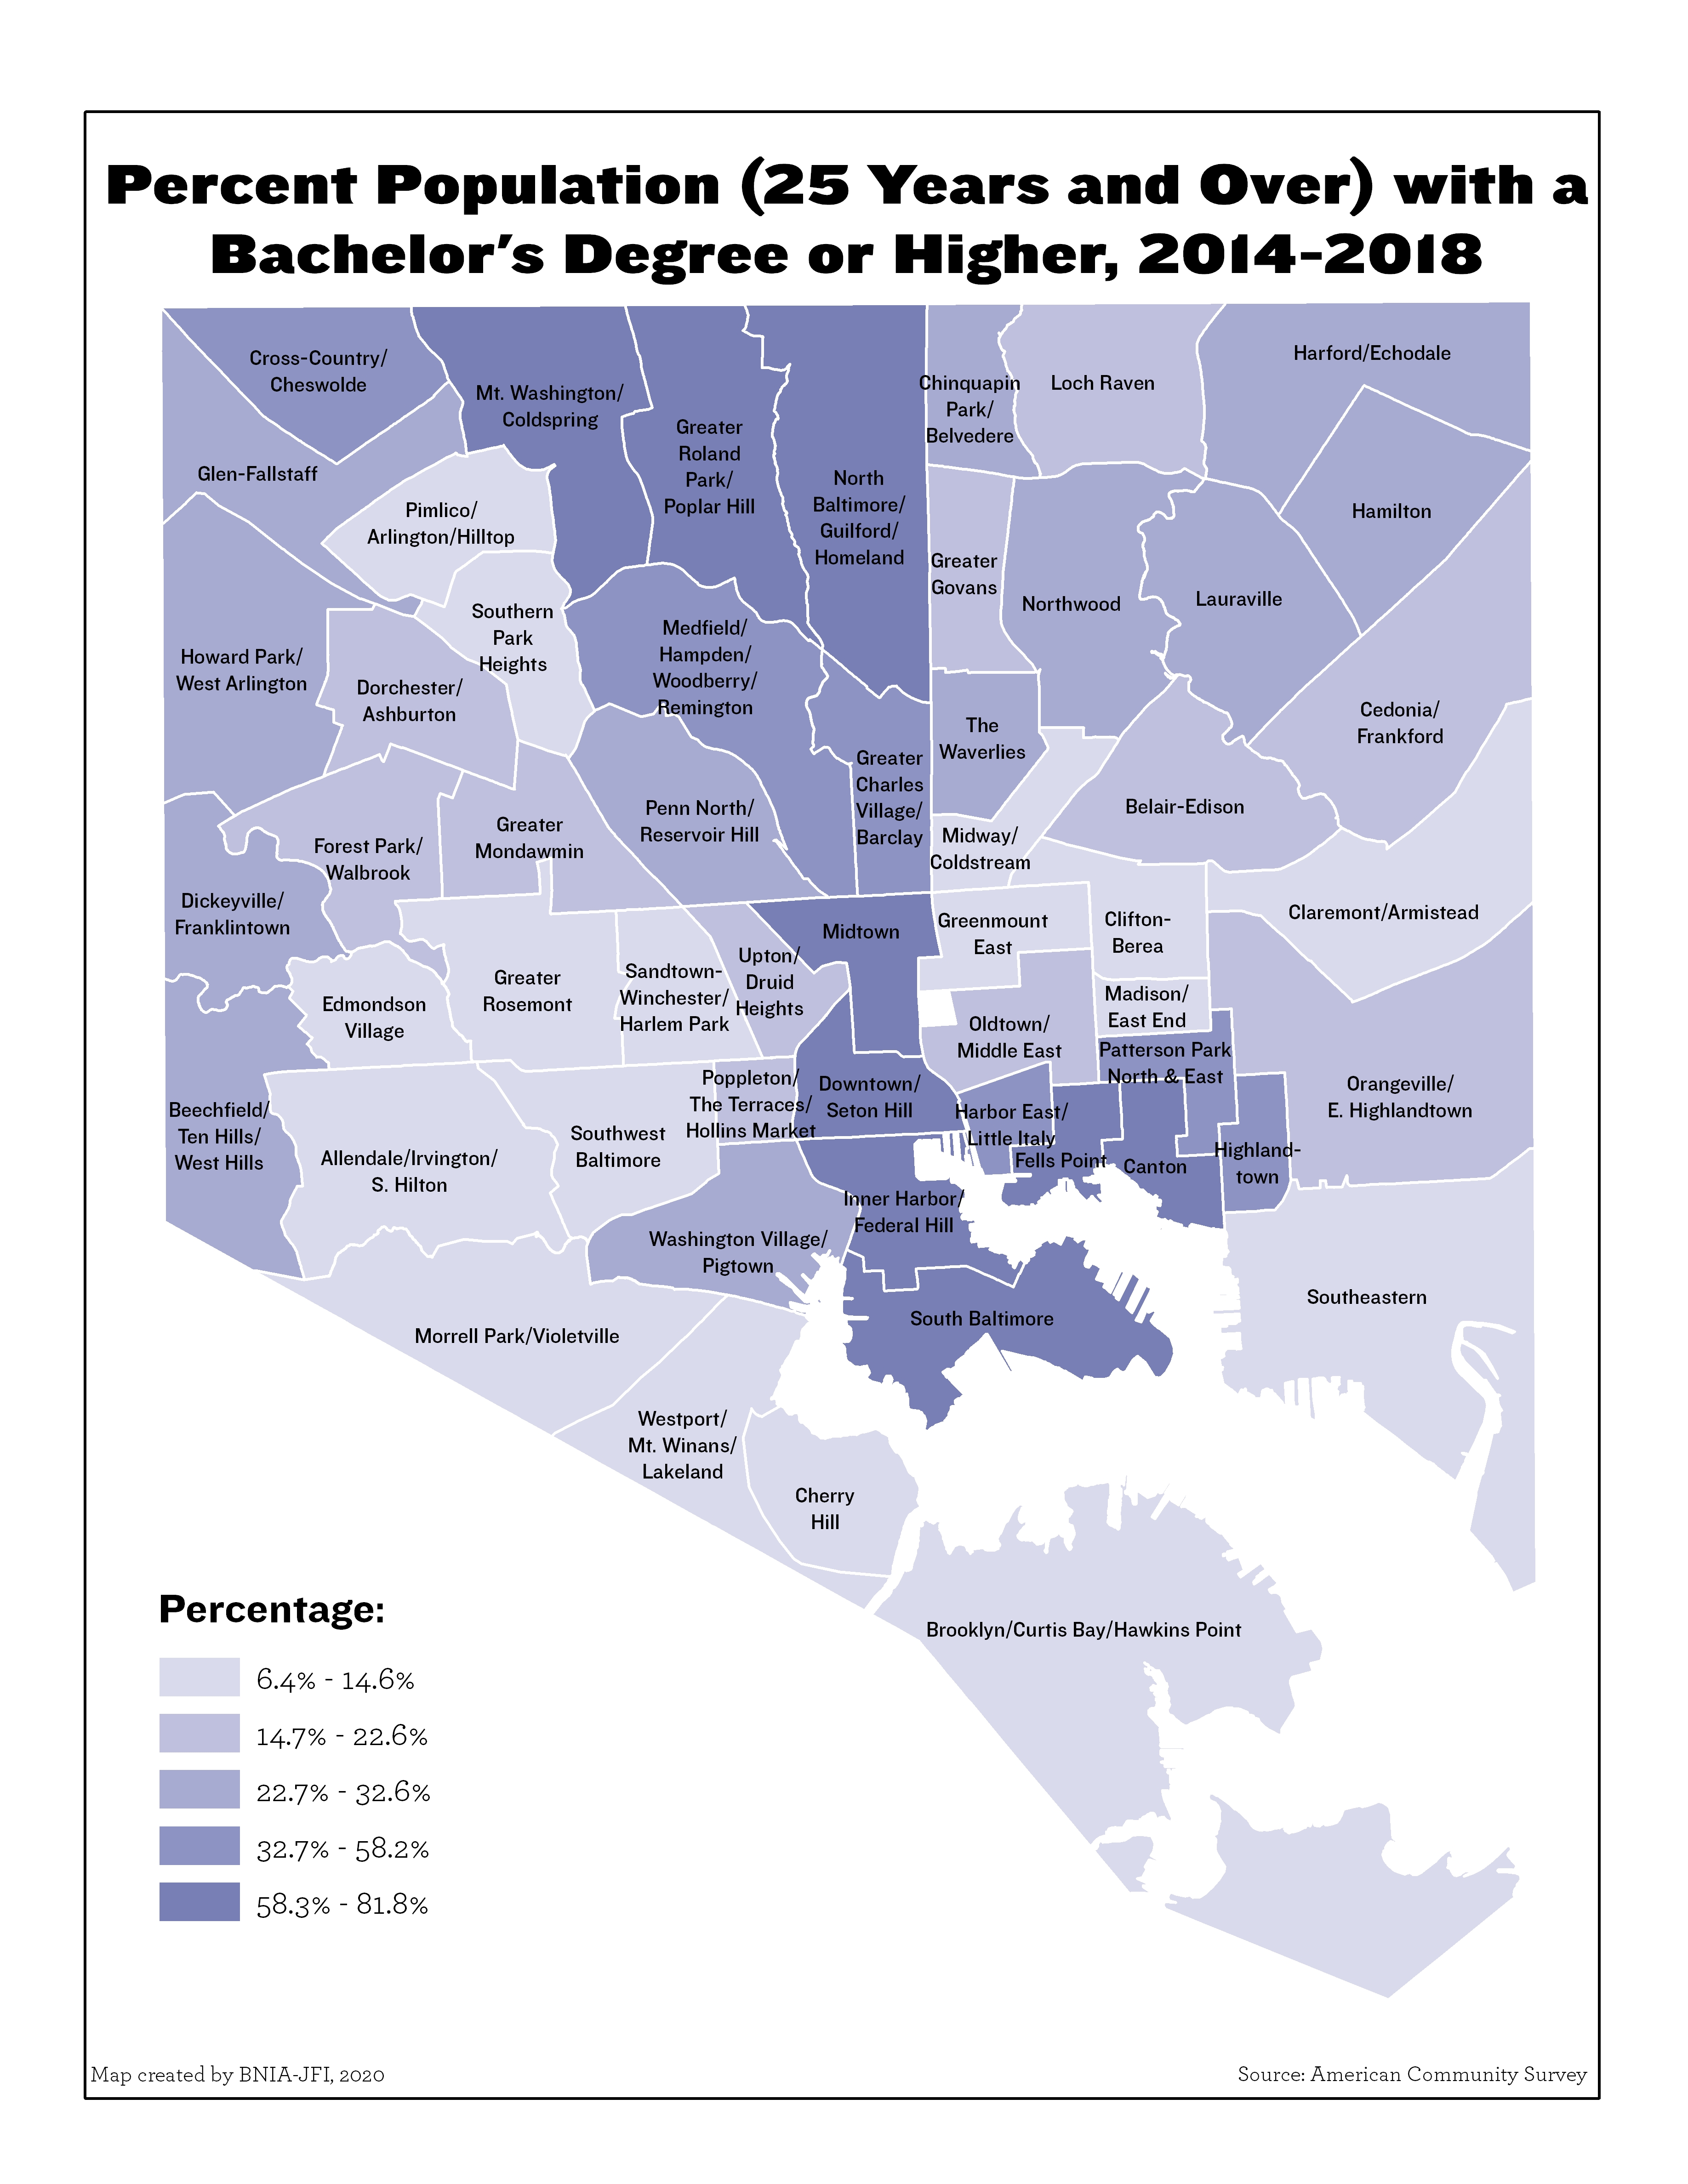
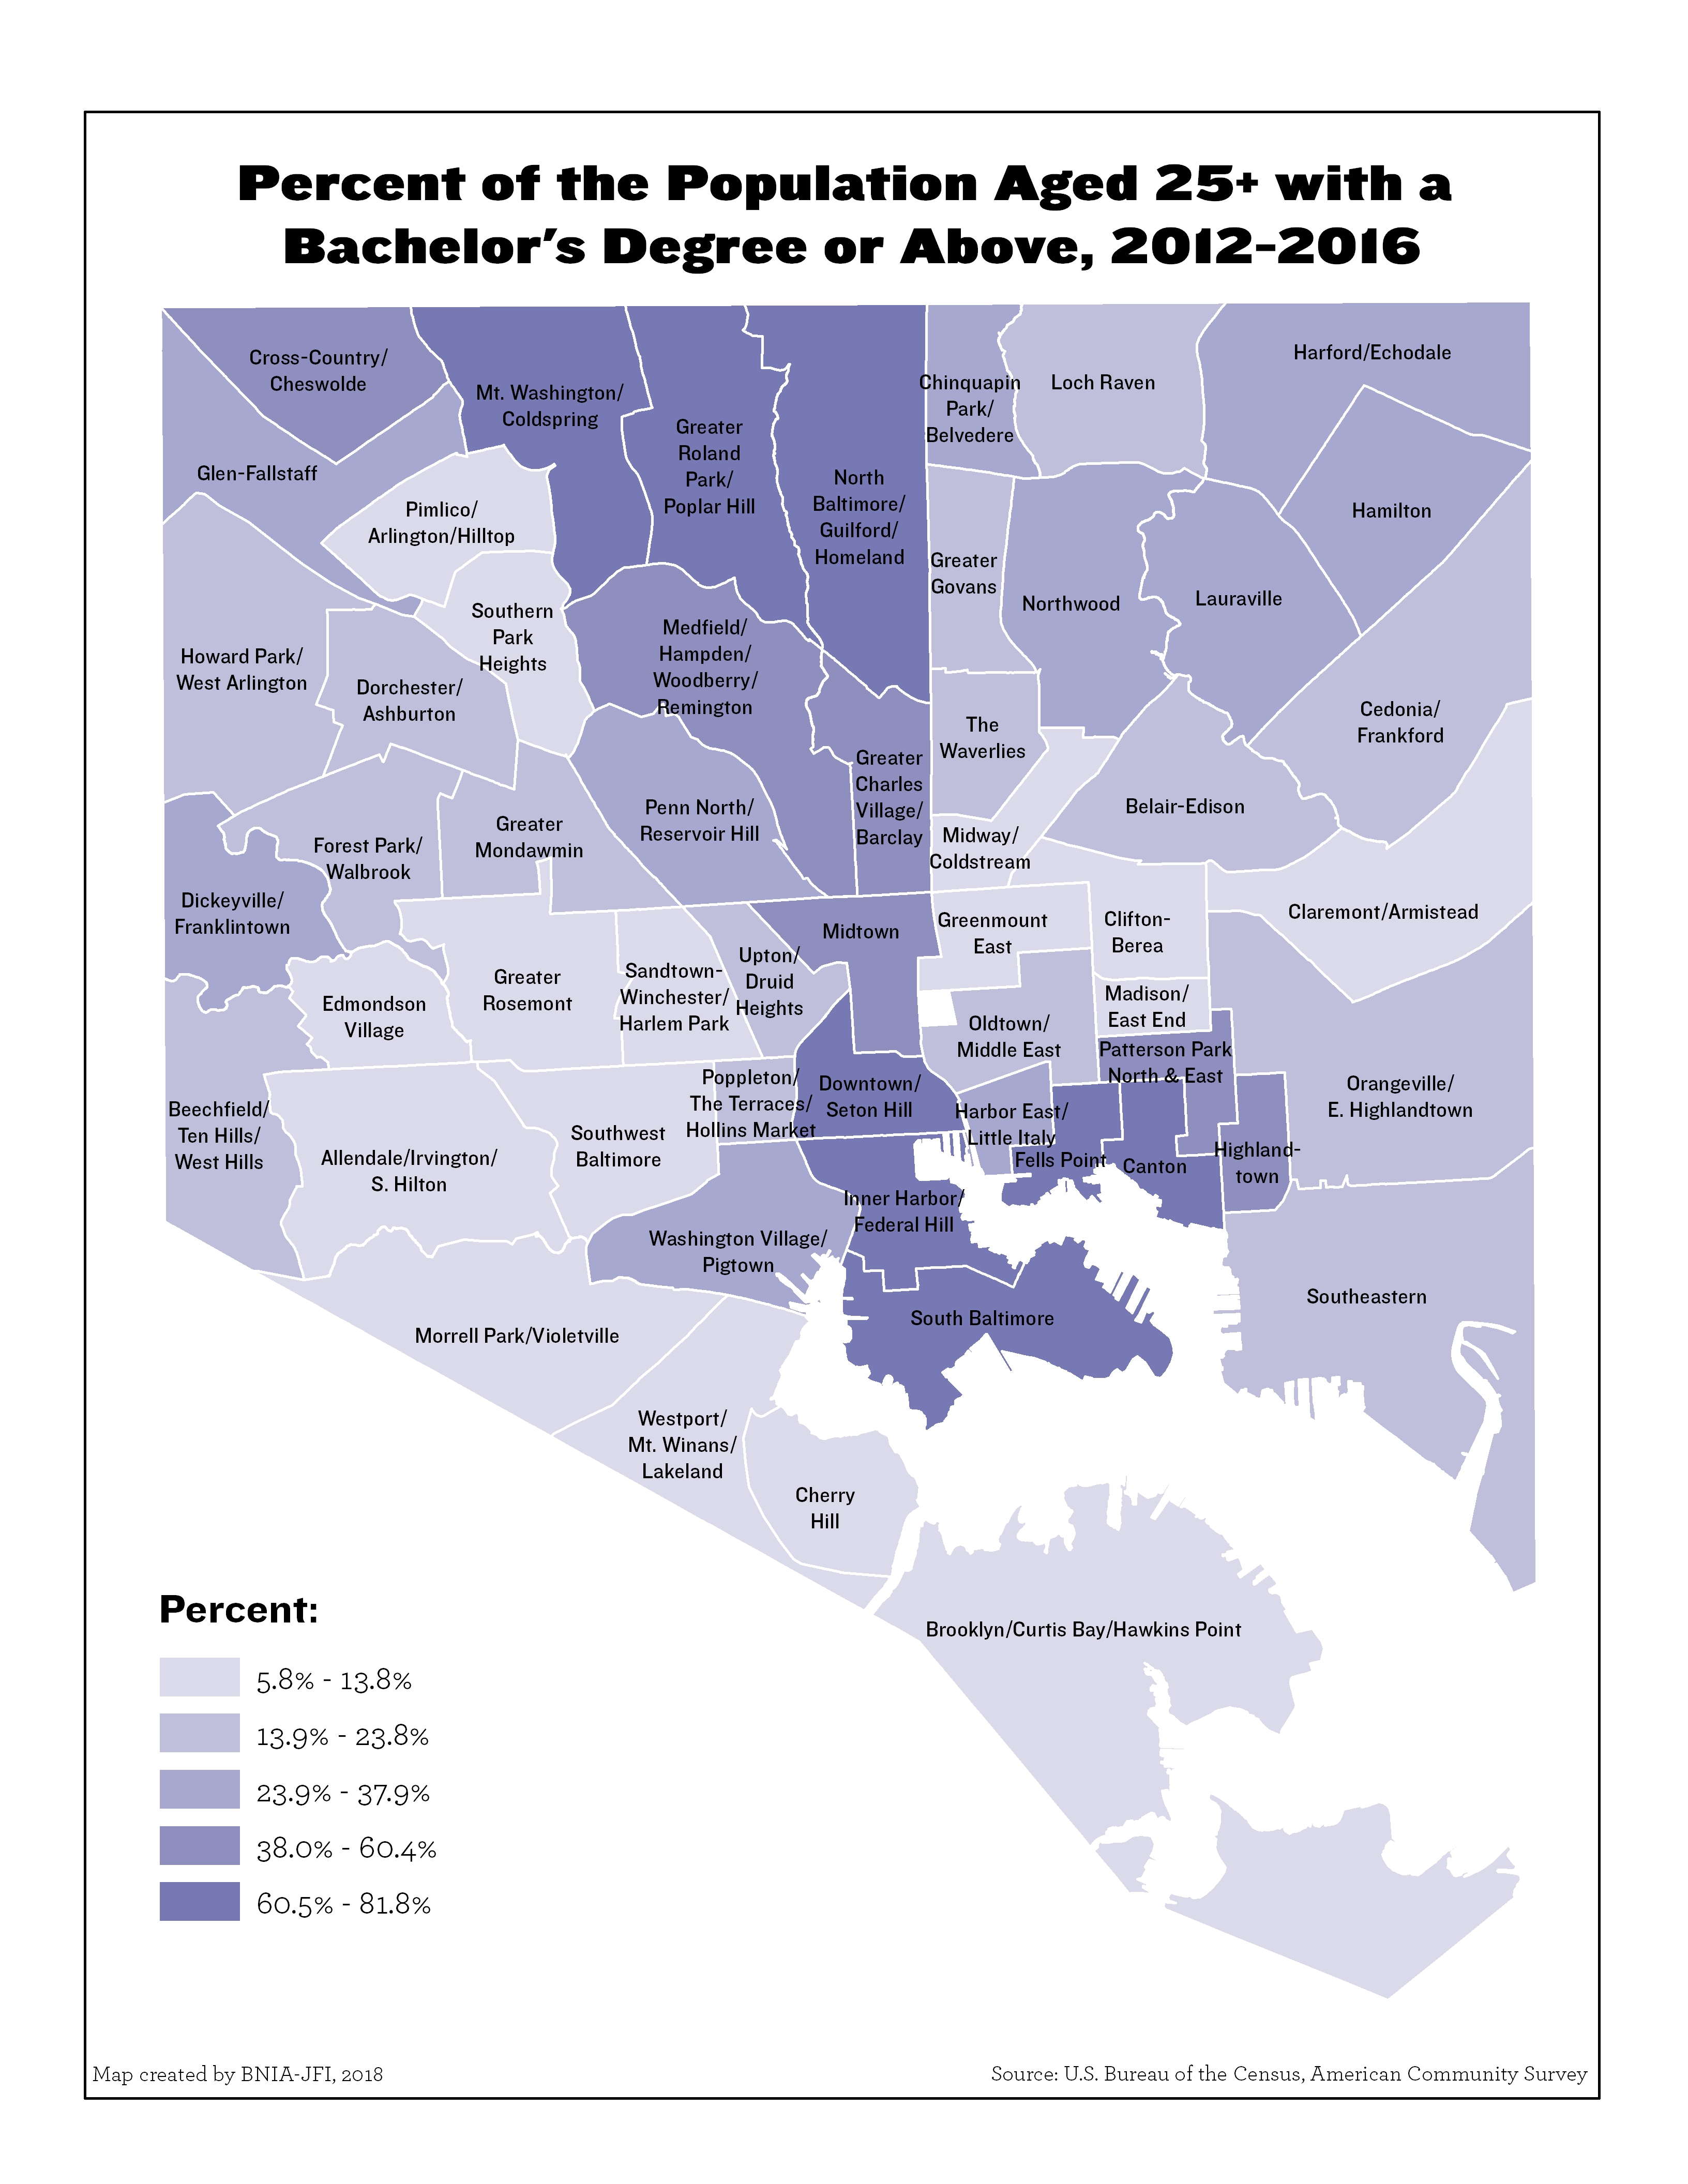
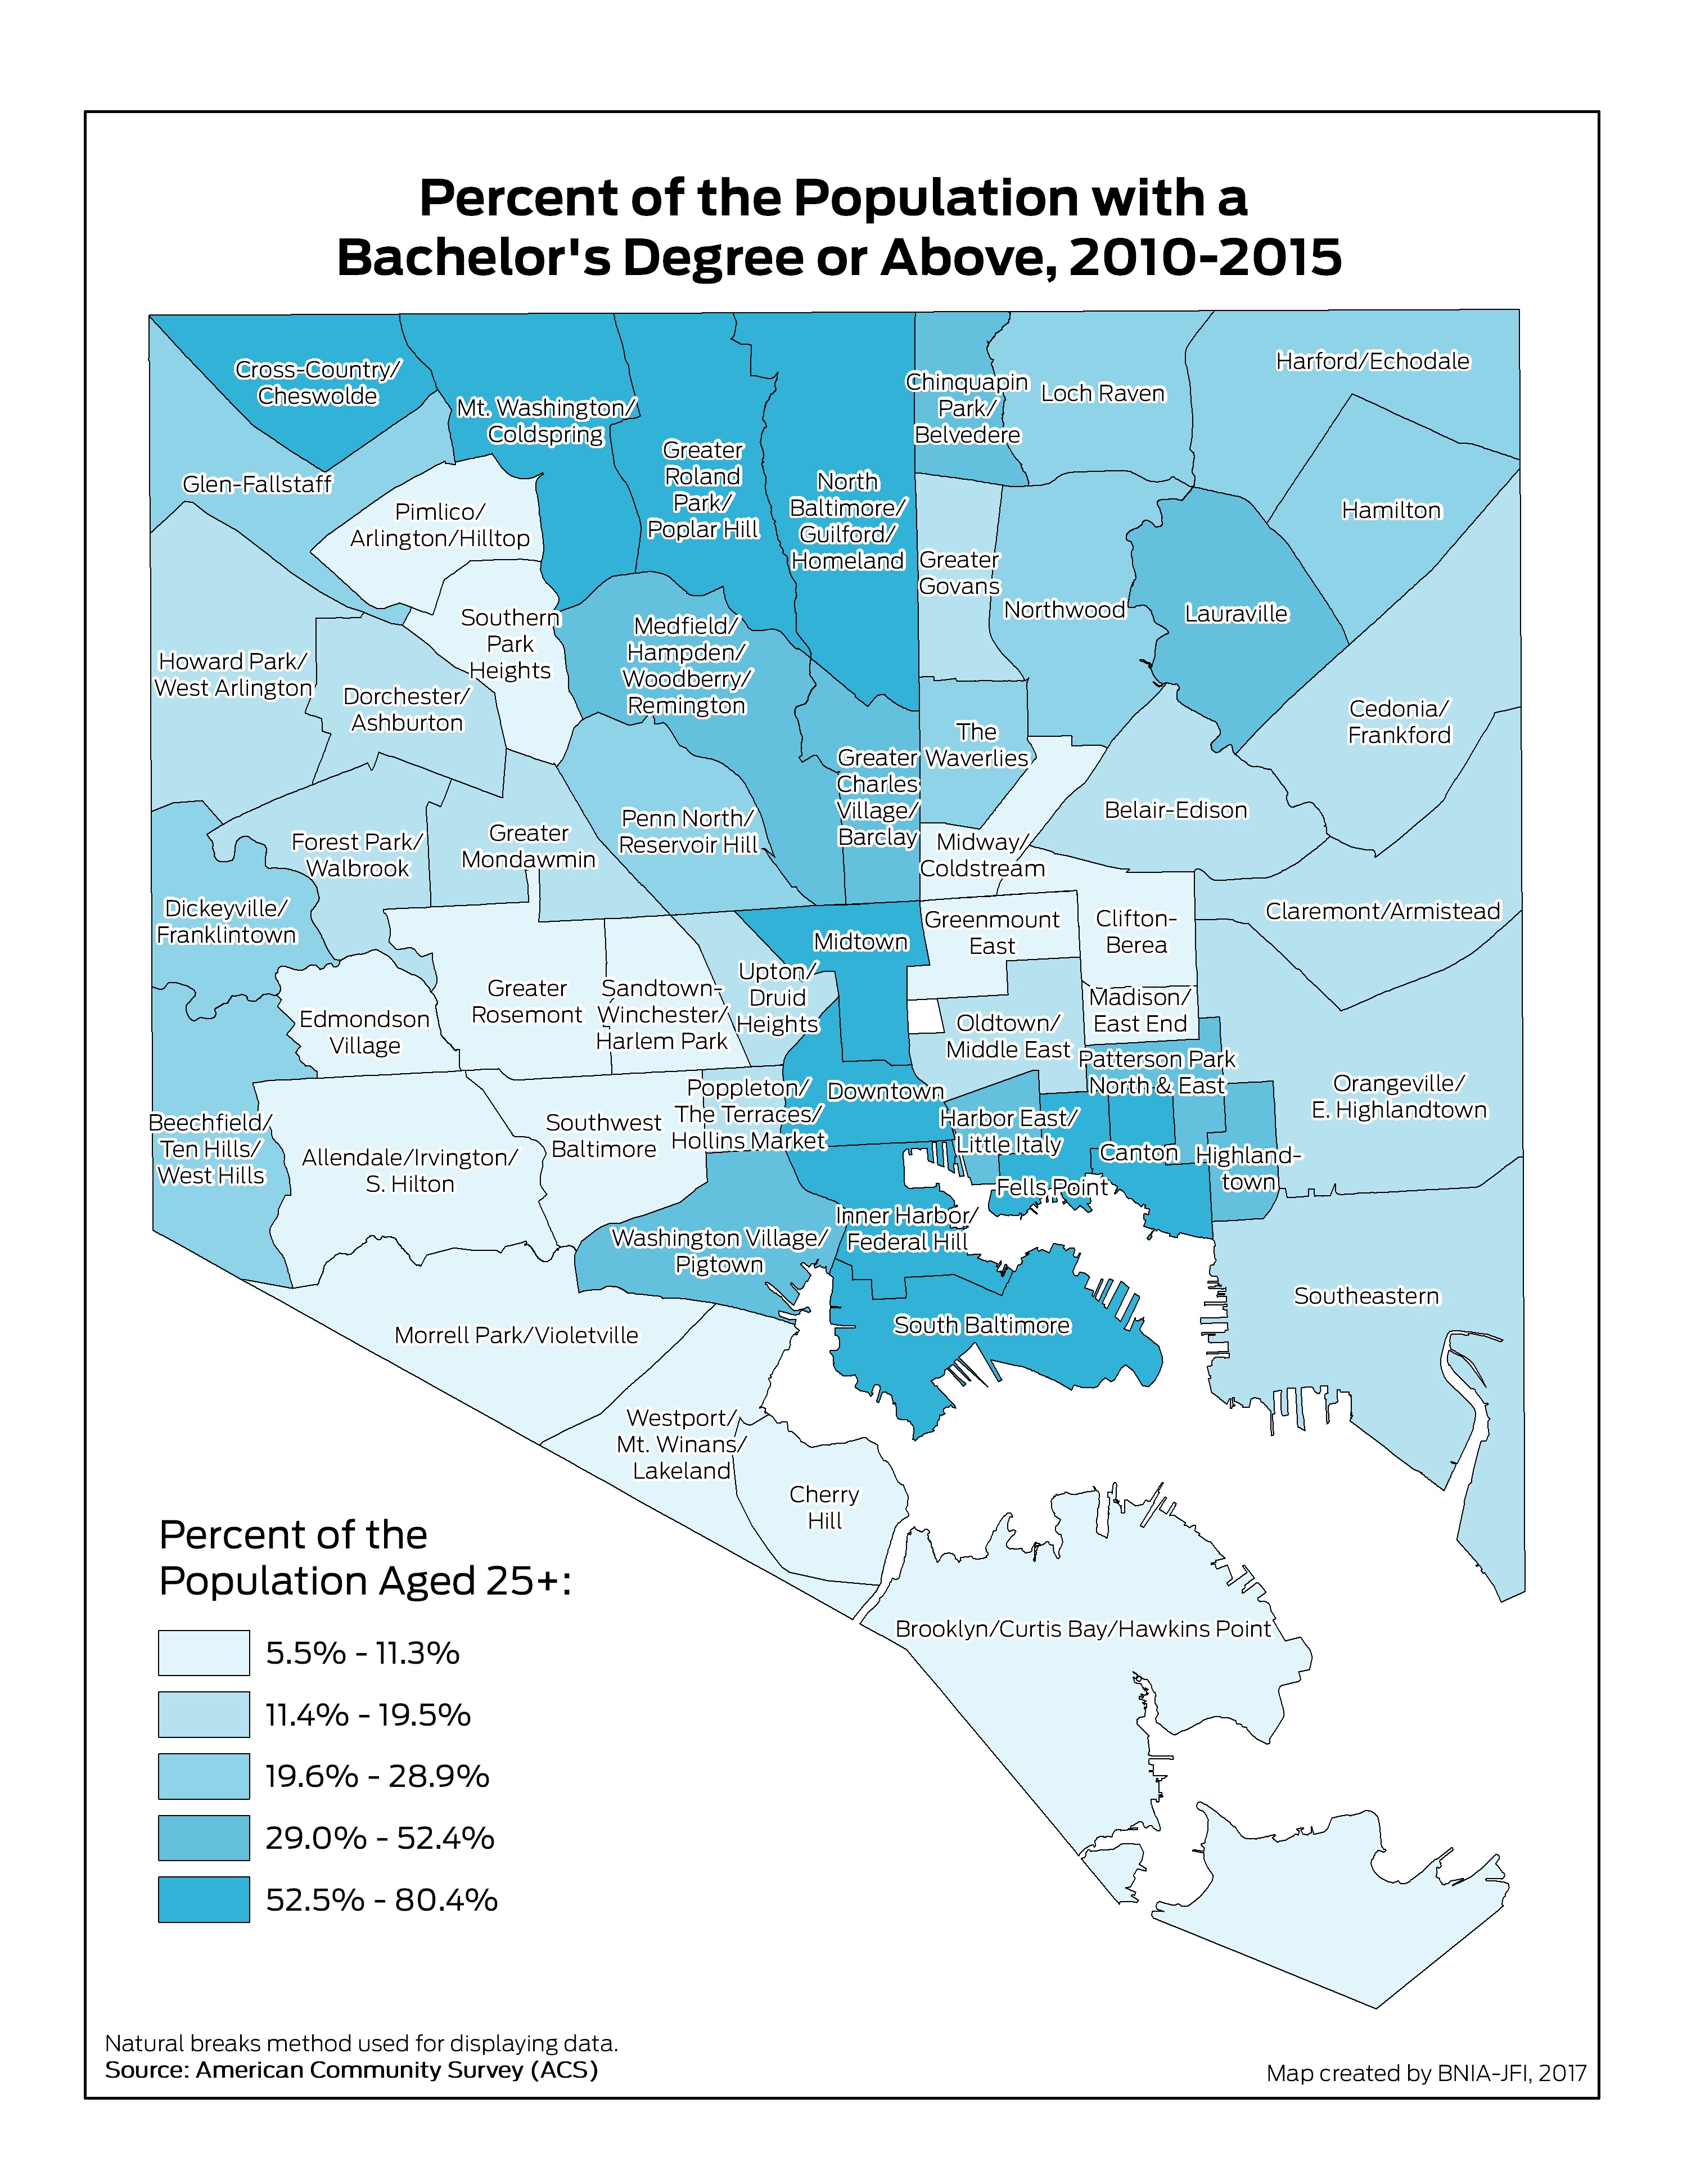
Percent Population (25 Years and over) with a Bachelors Degree or Above
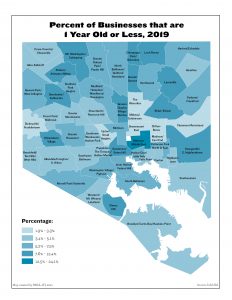
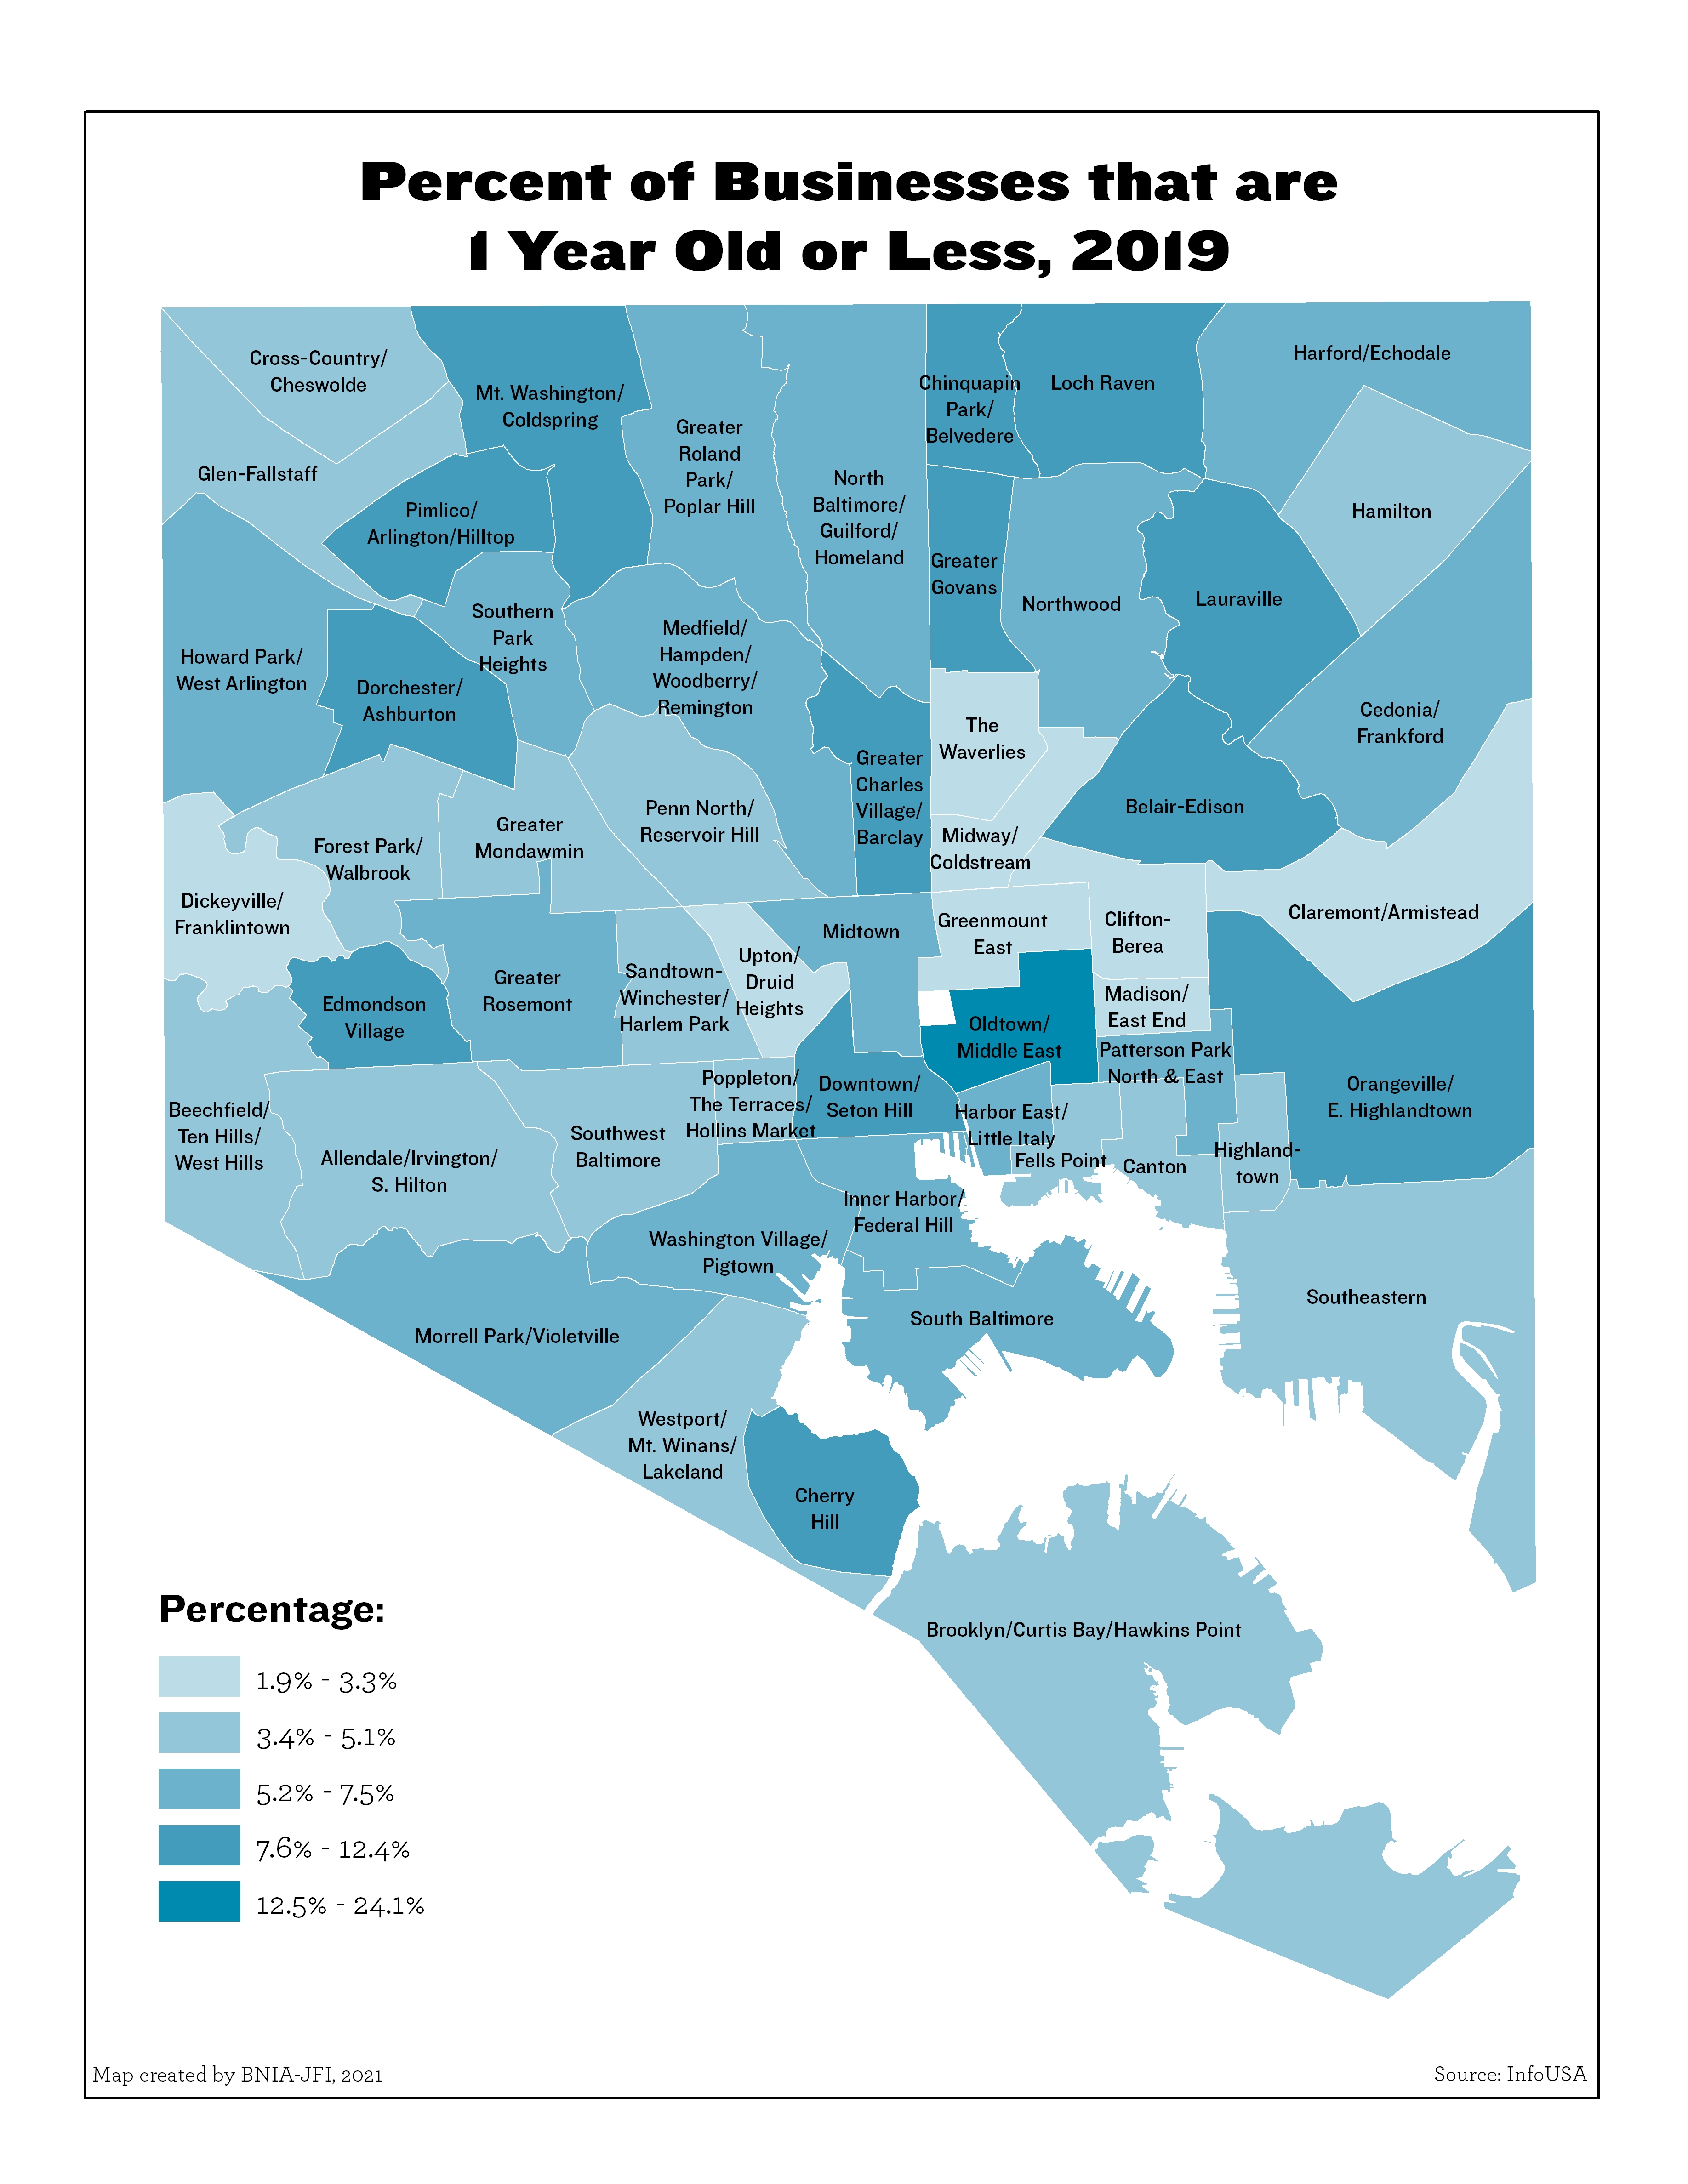
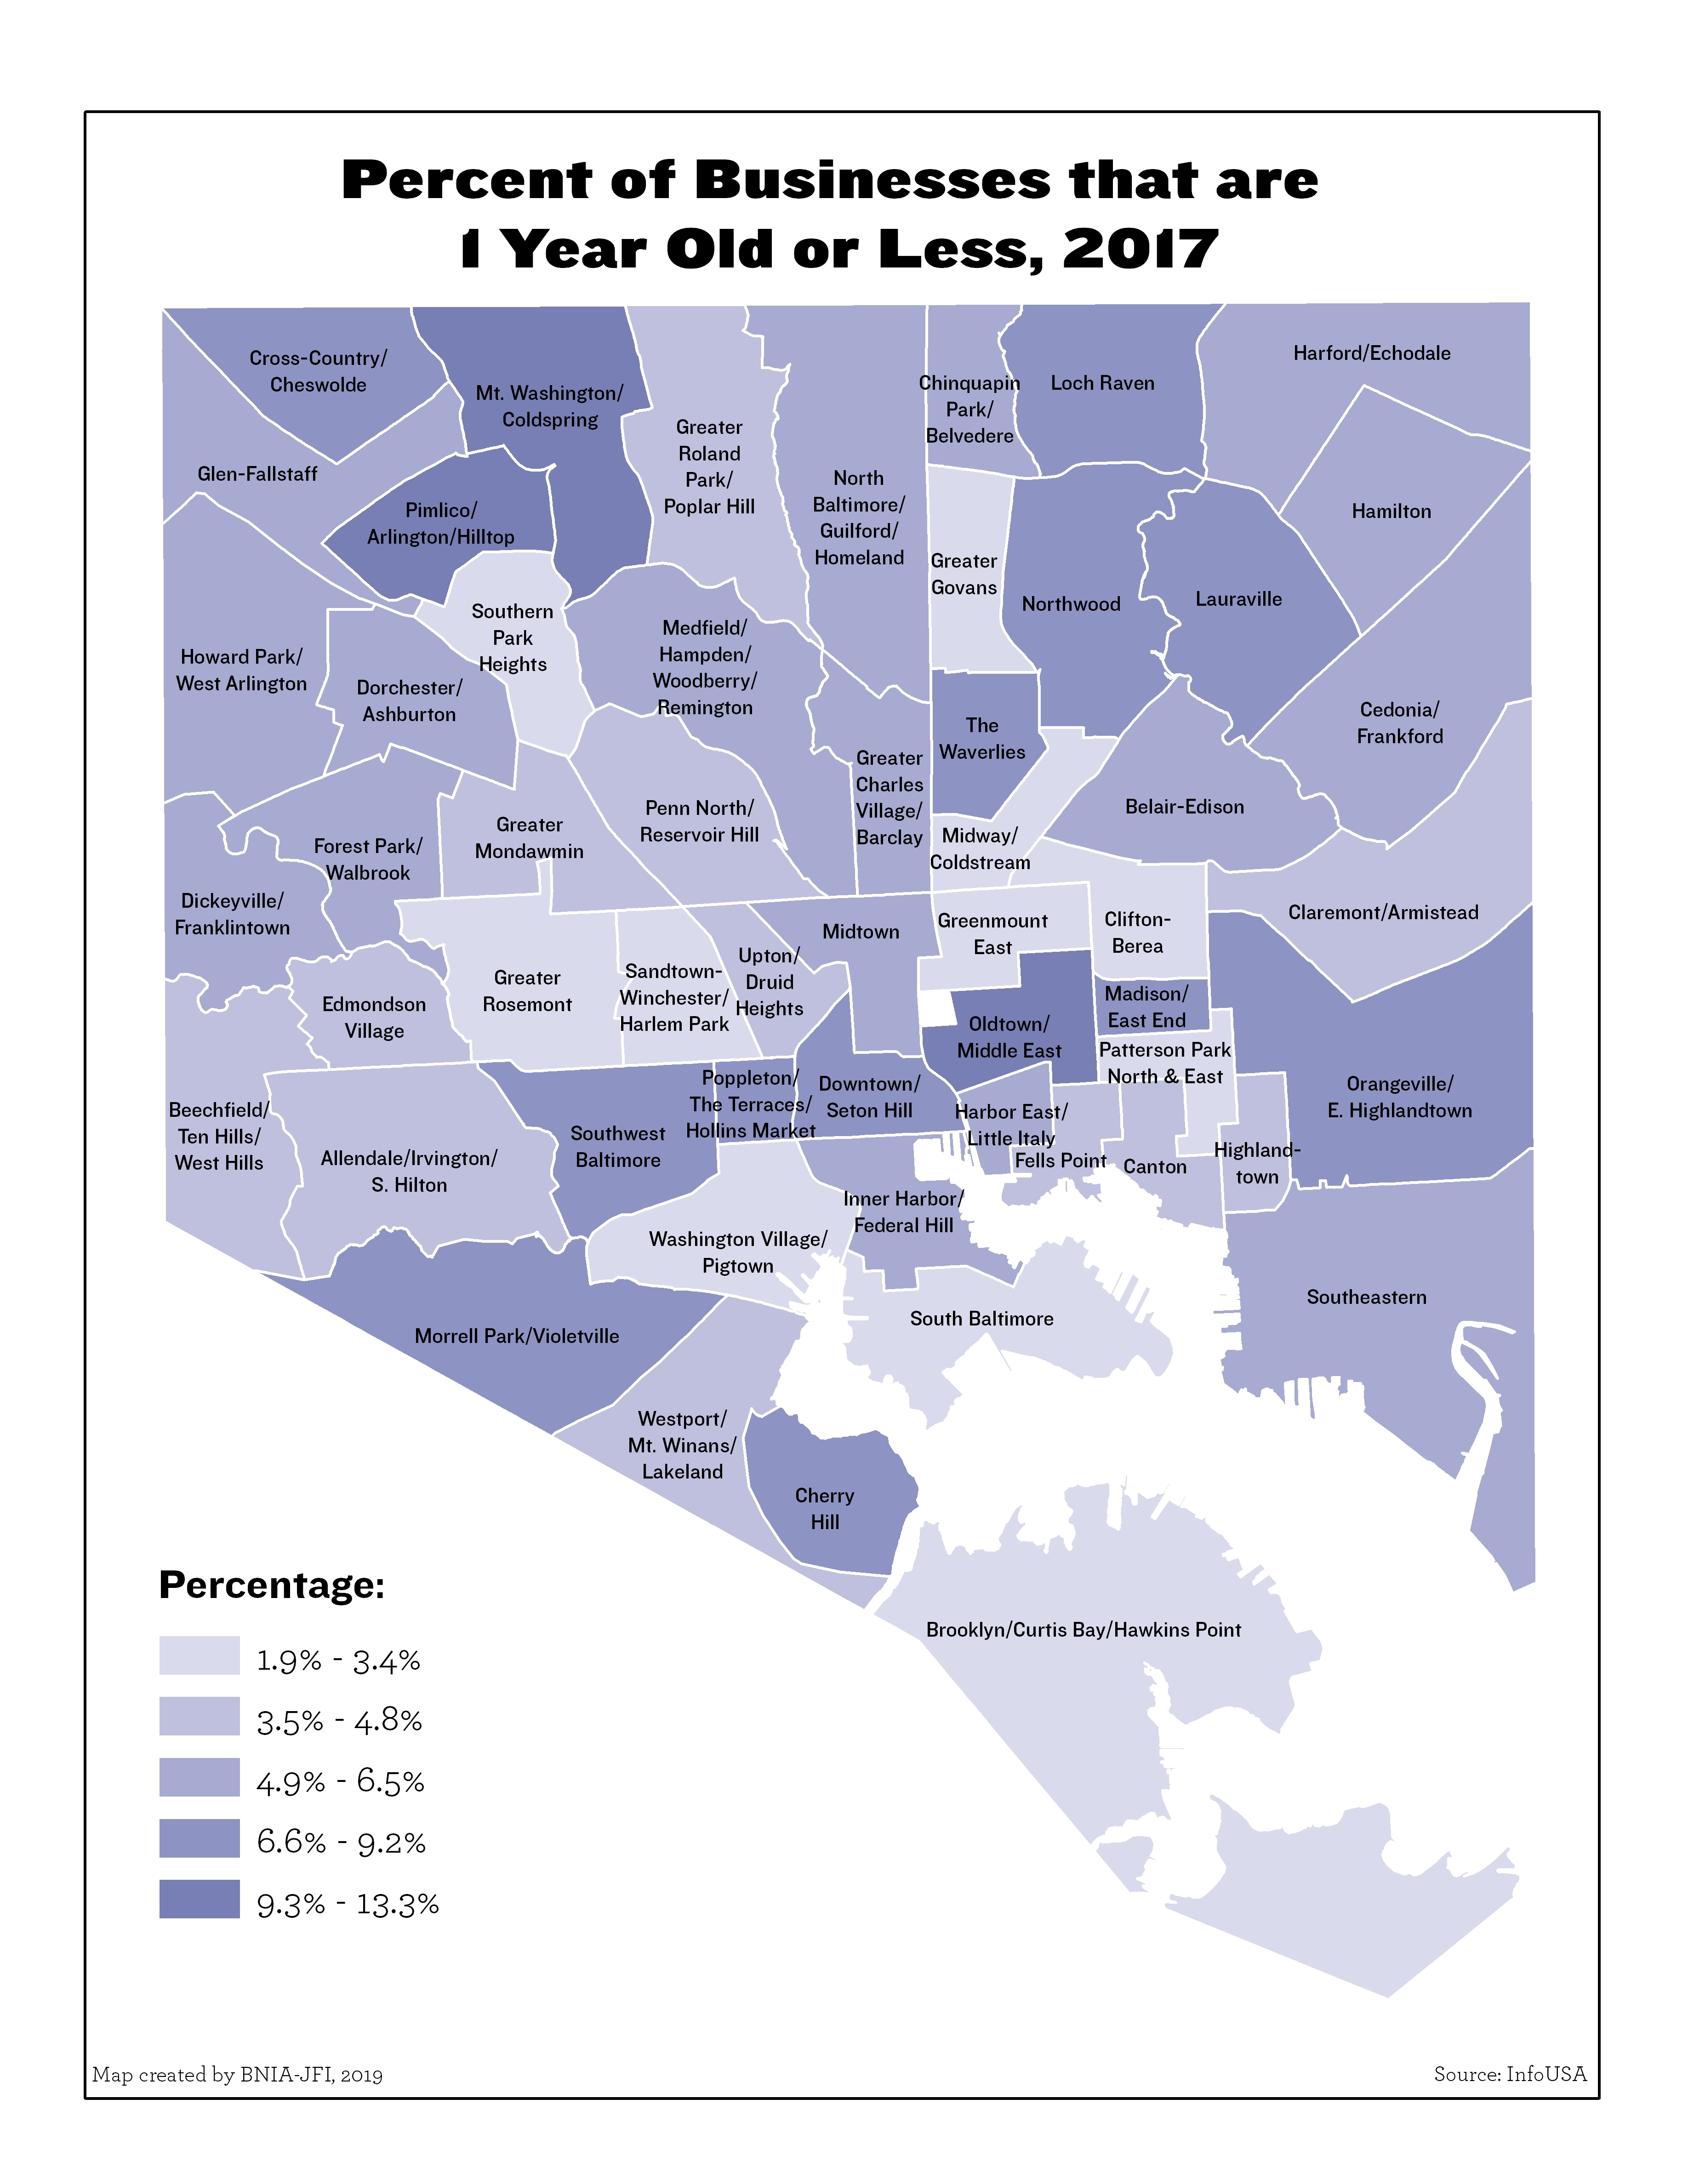
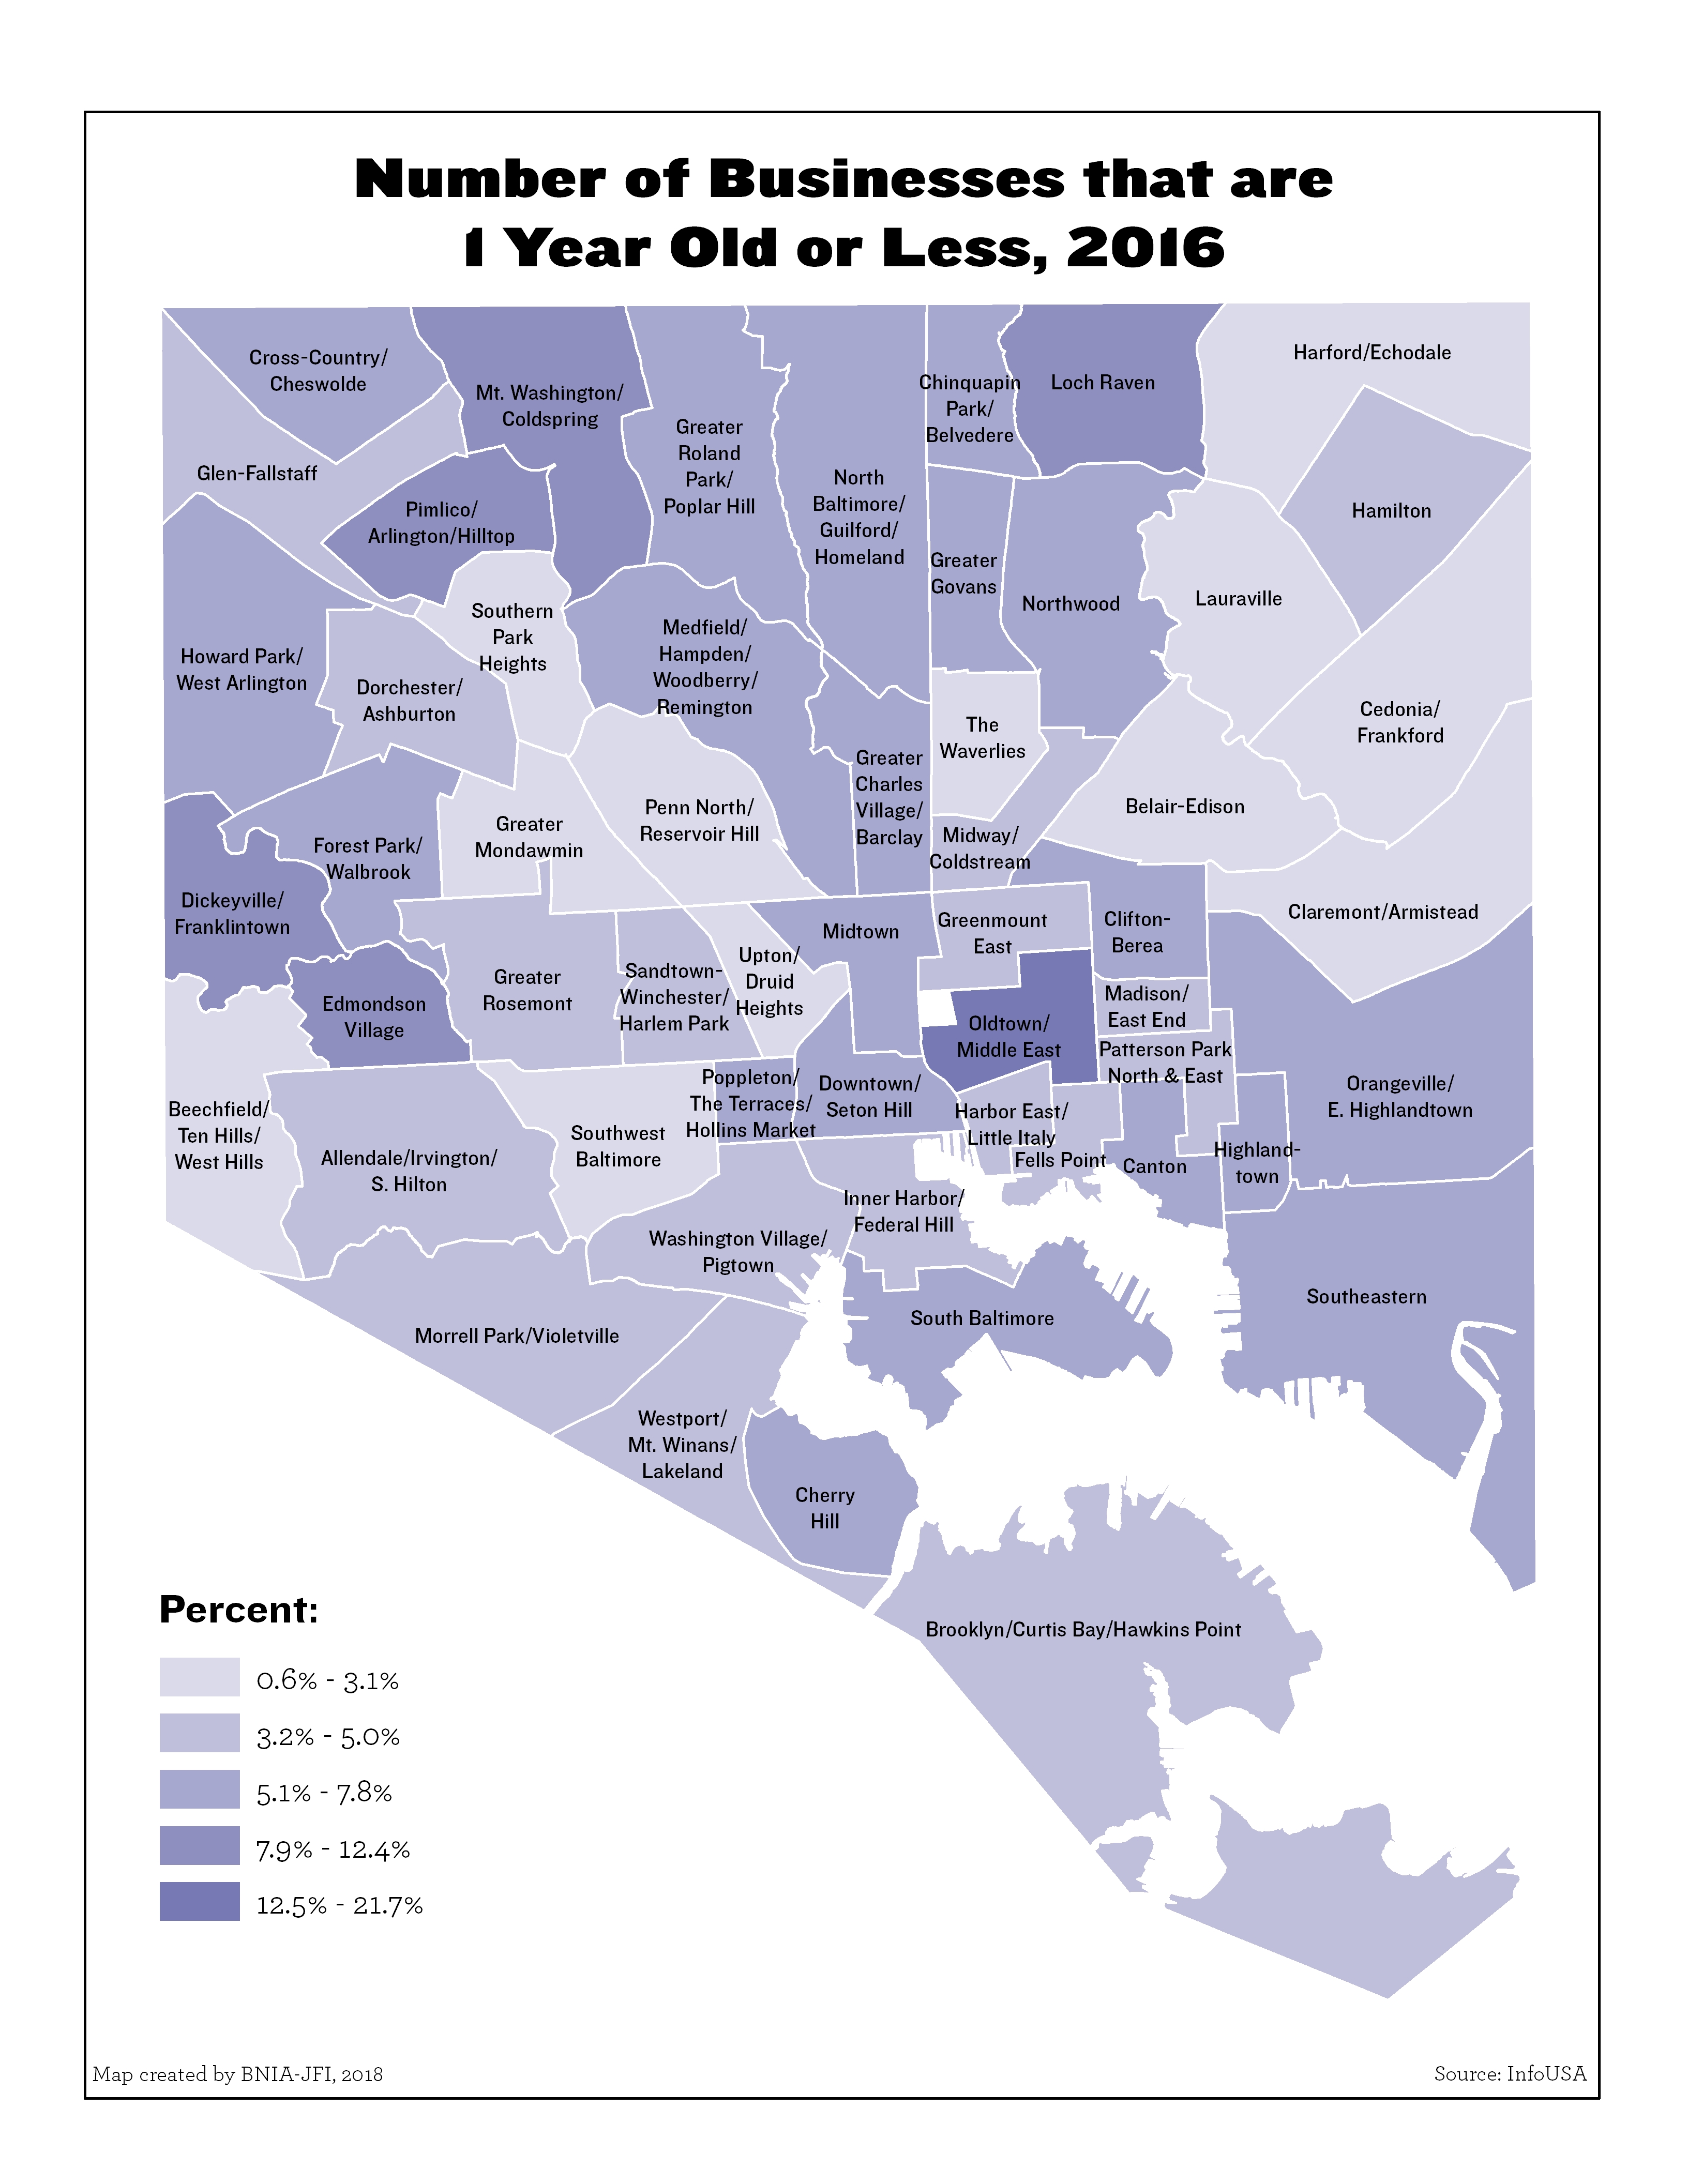
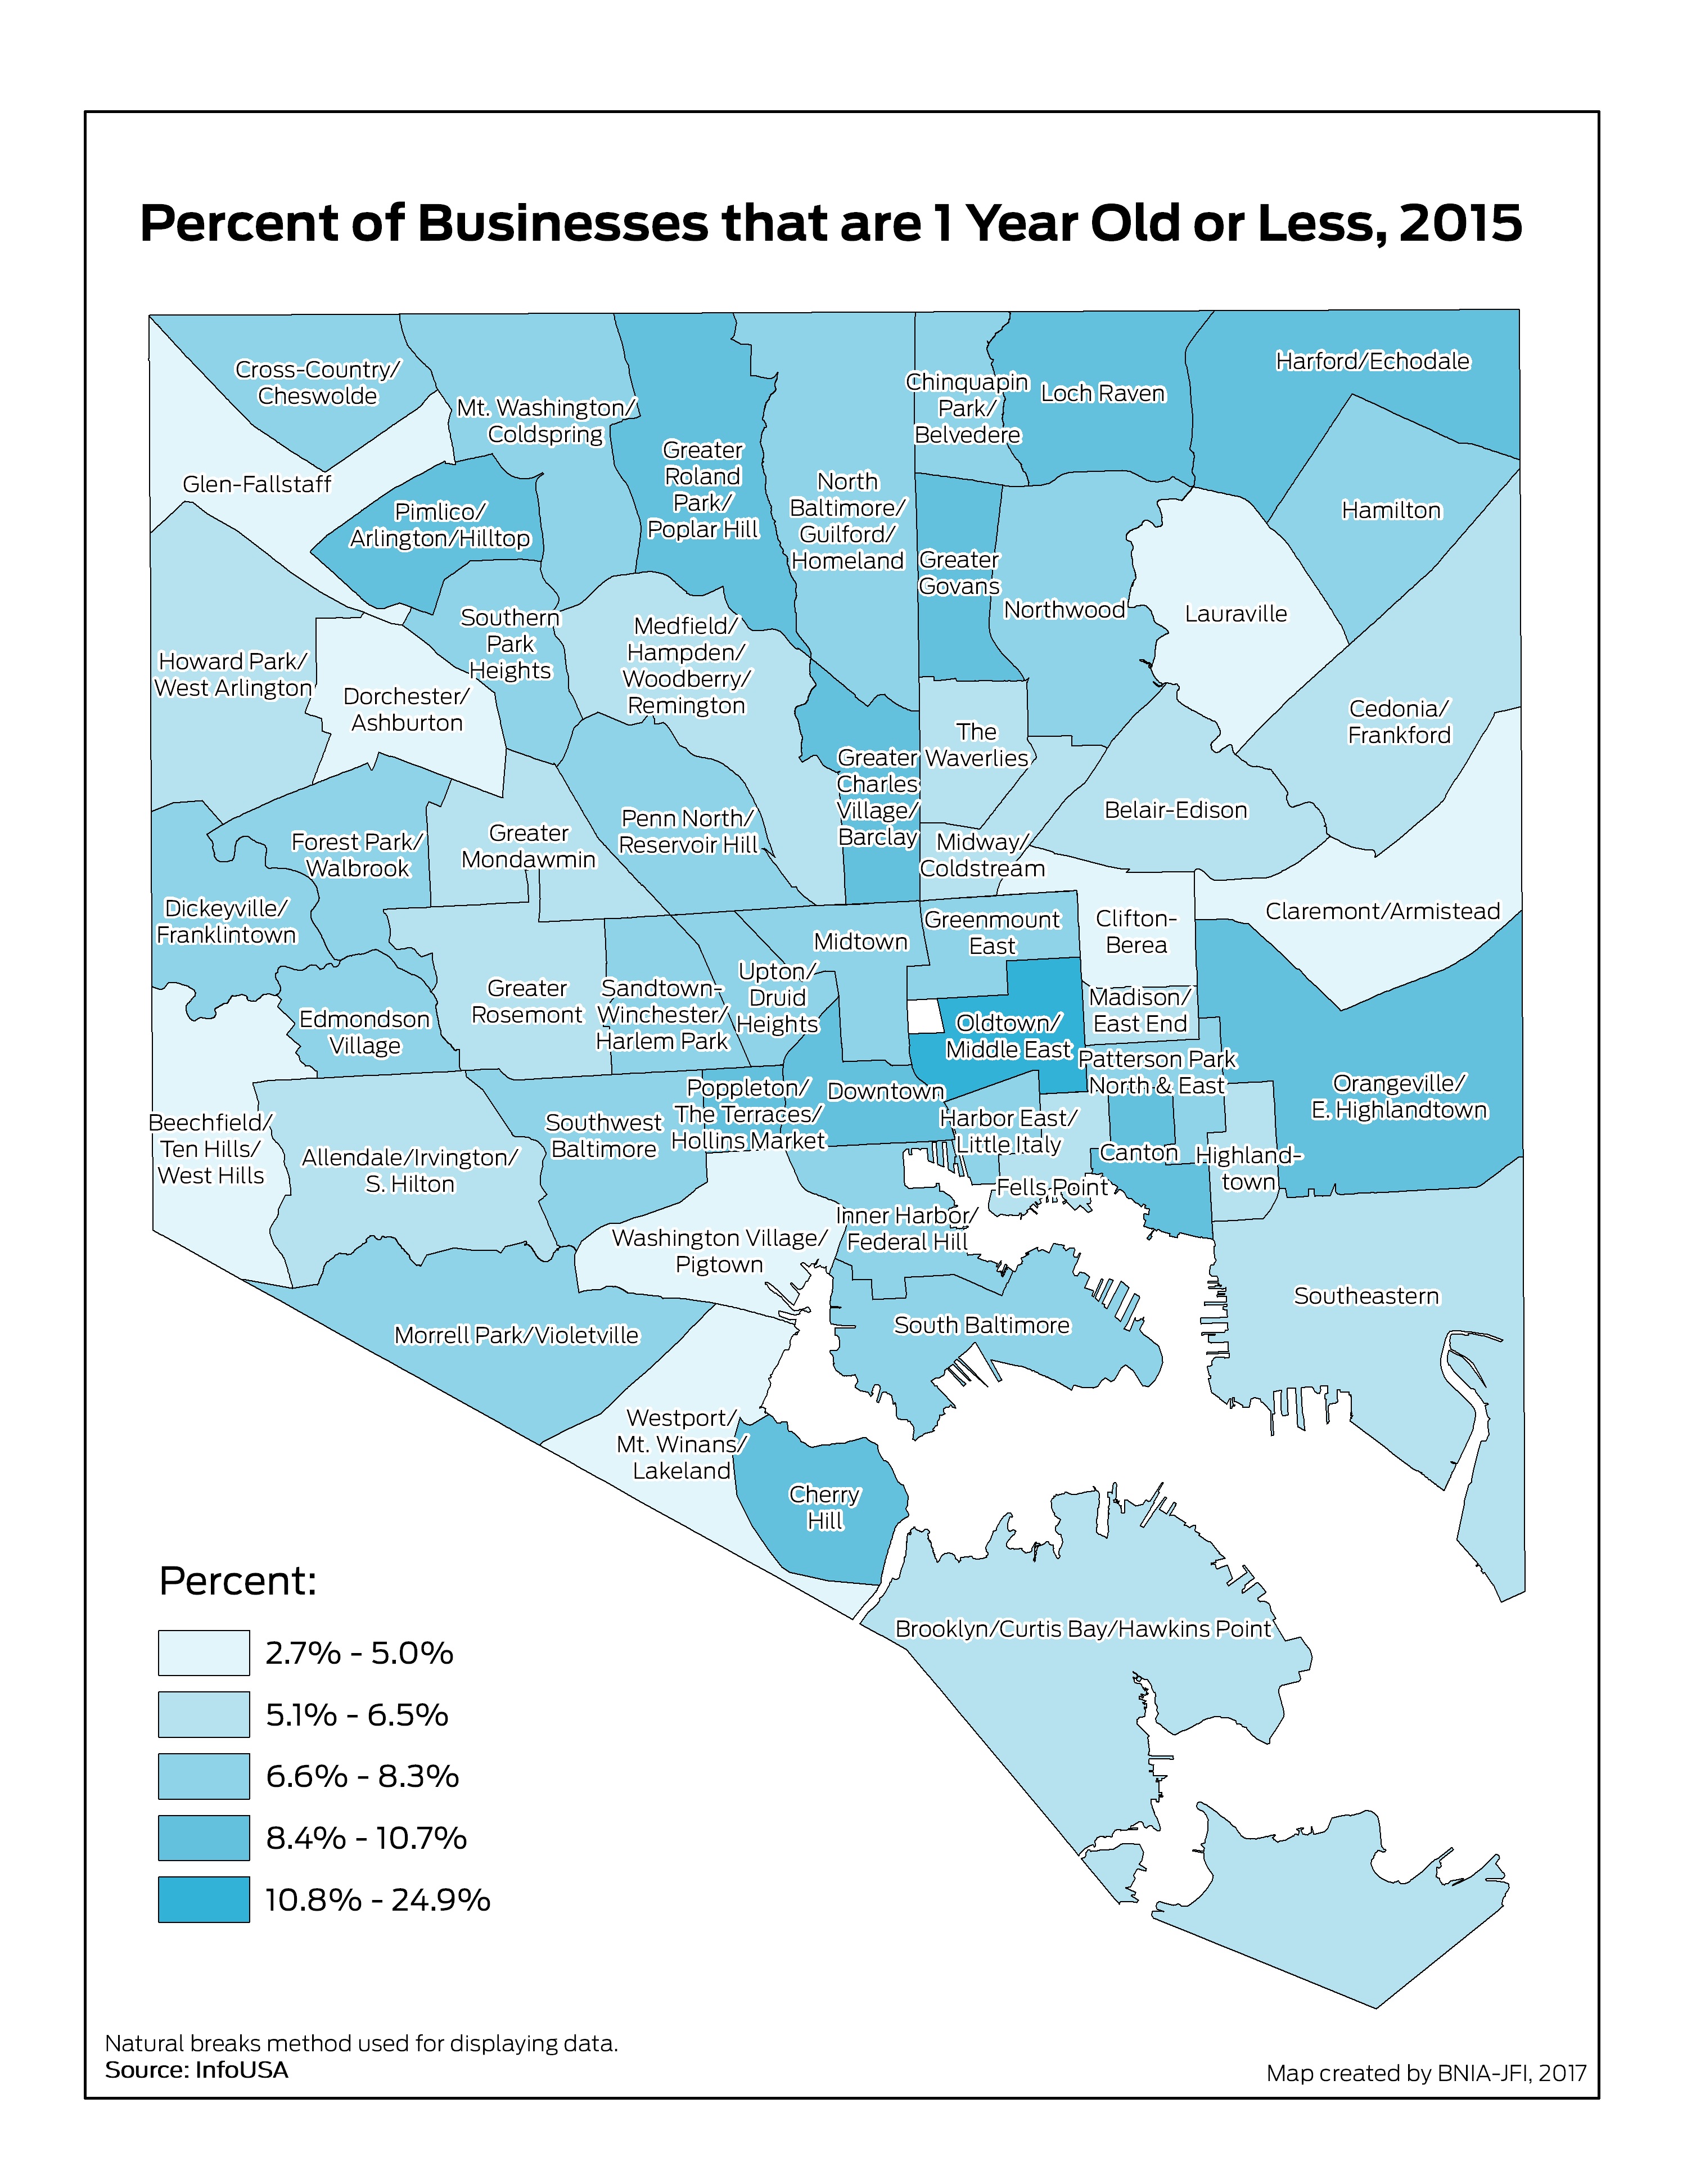
Percent of Businesses that are 1 Year old or Less
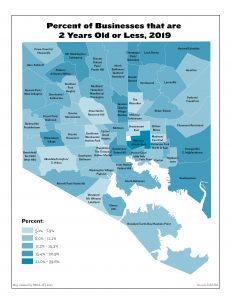
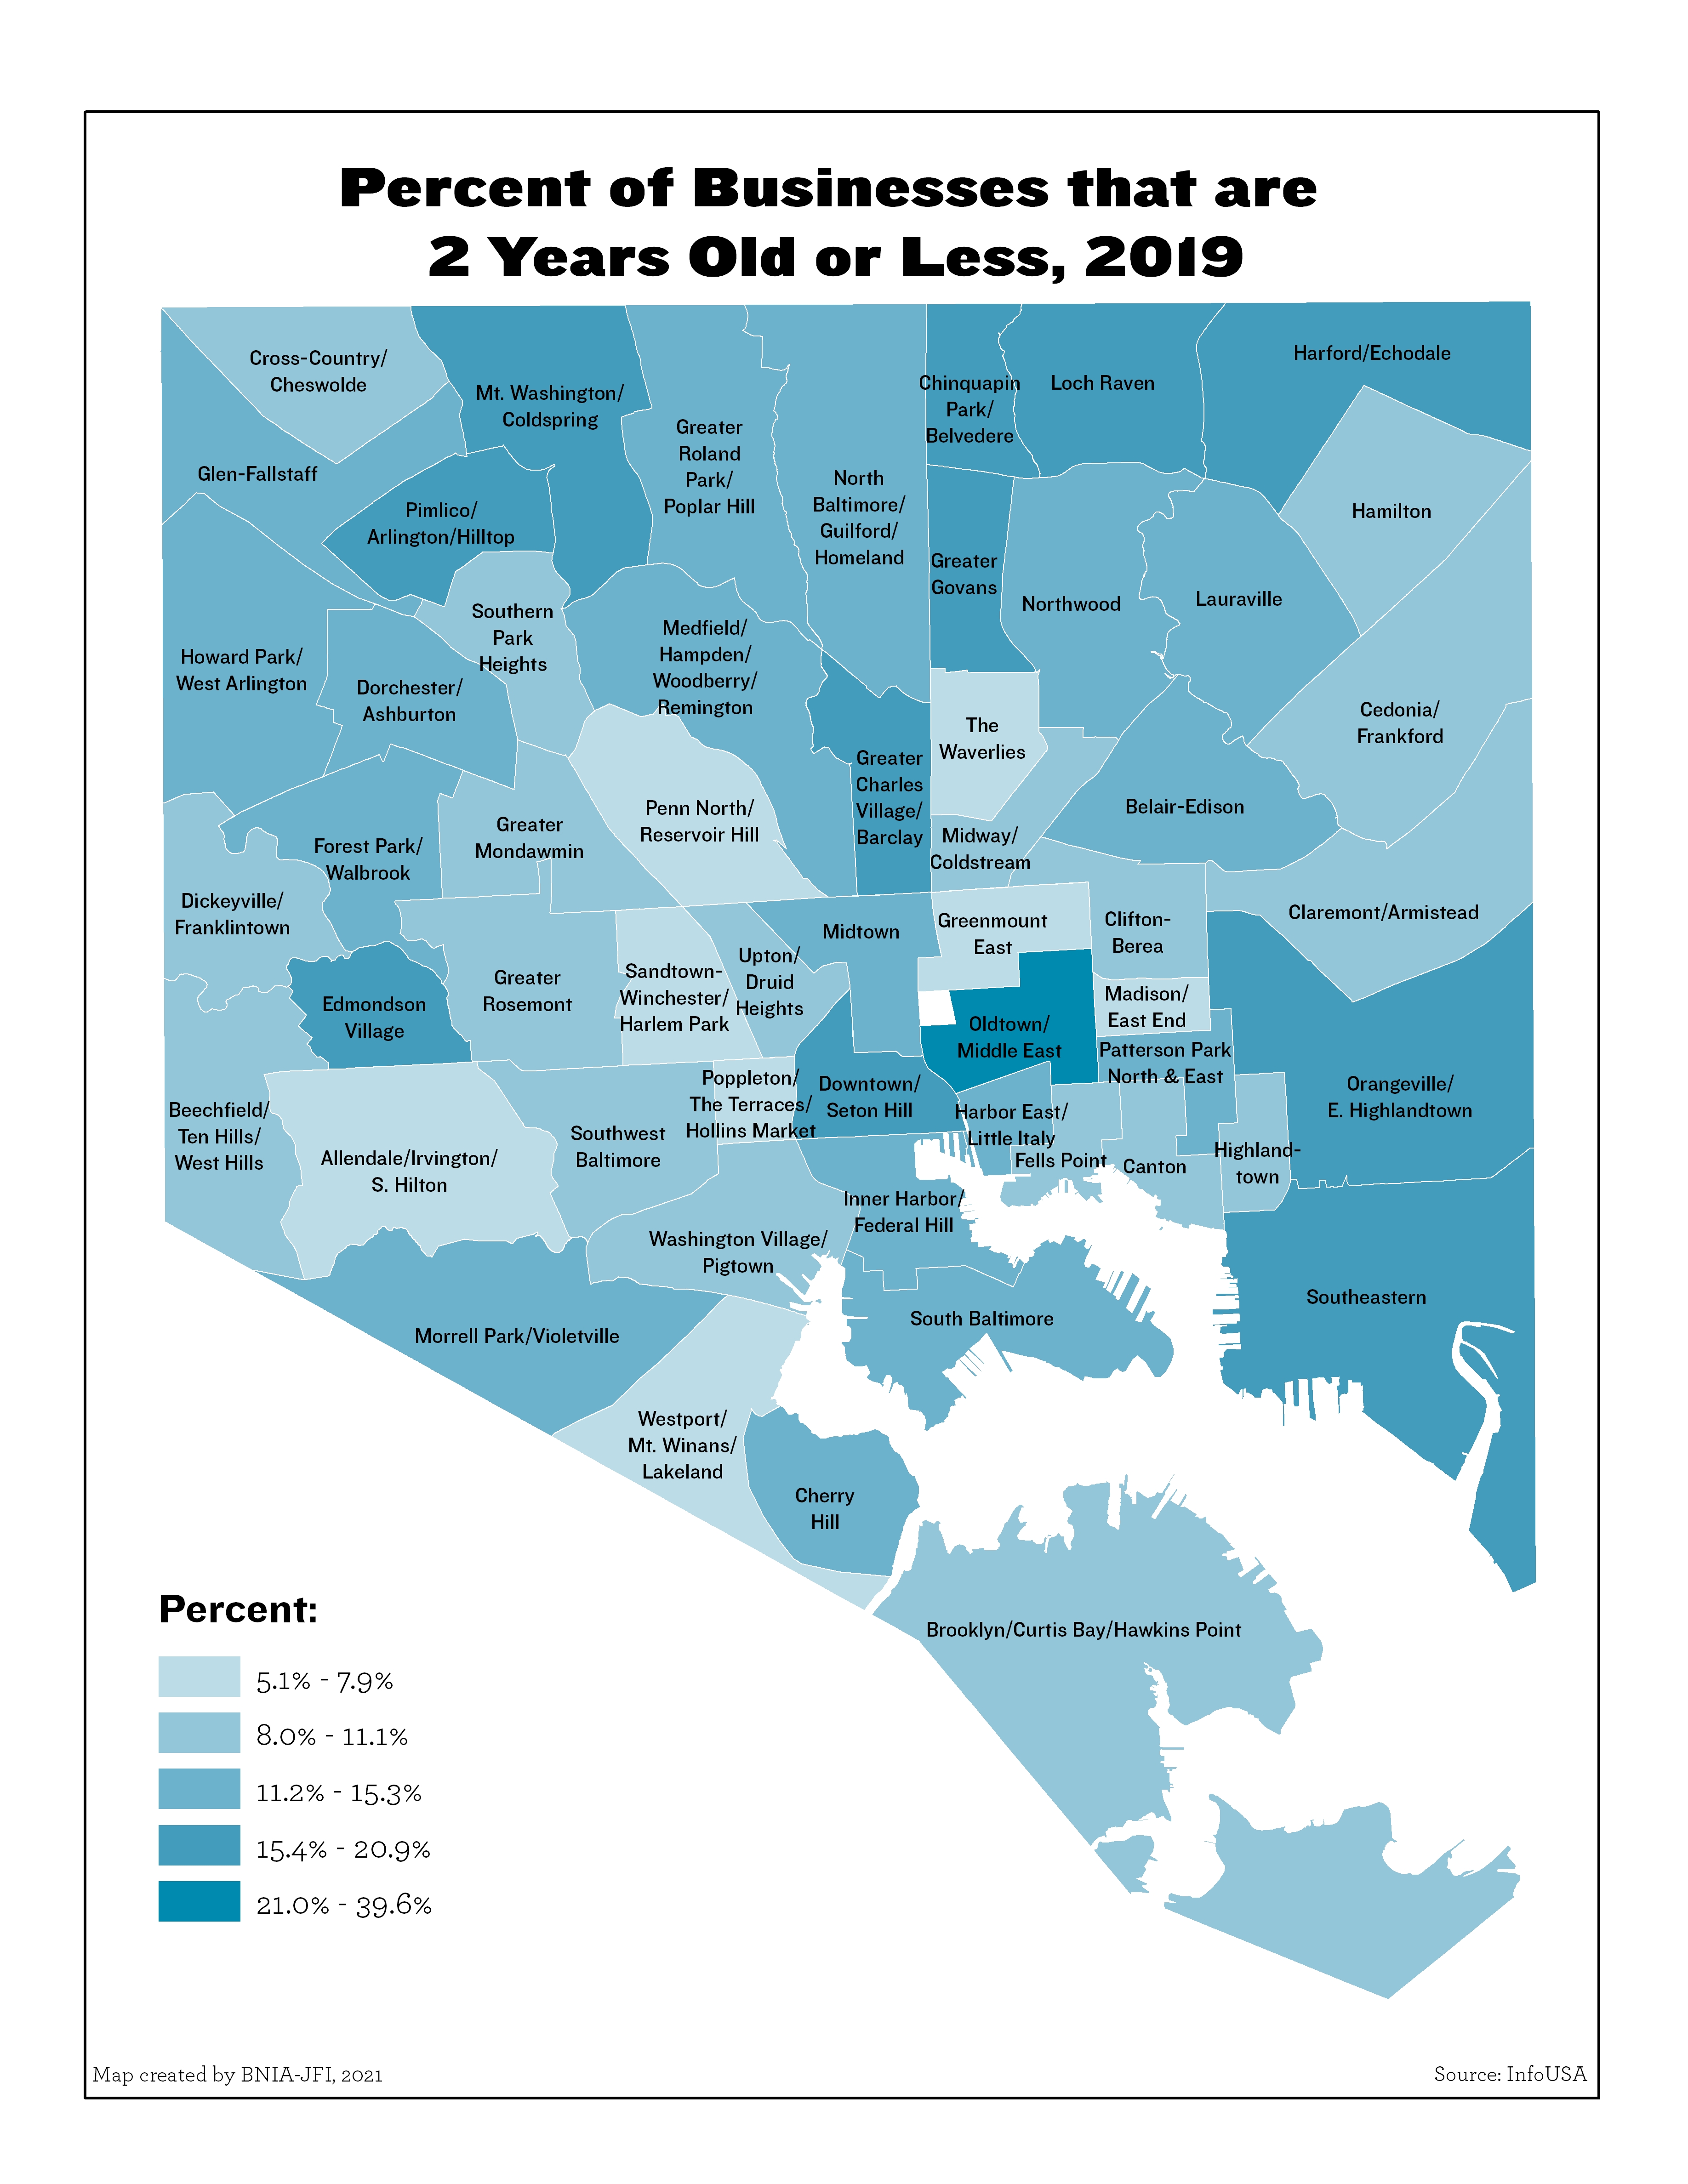
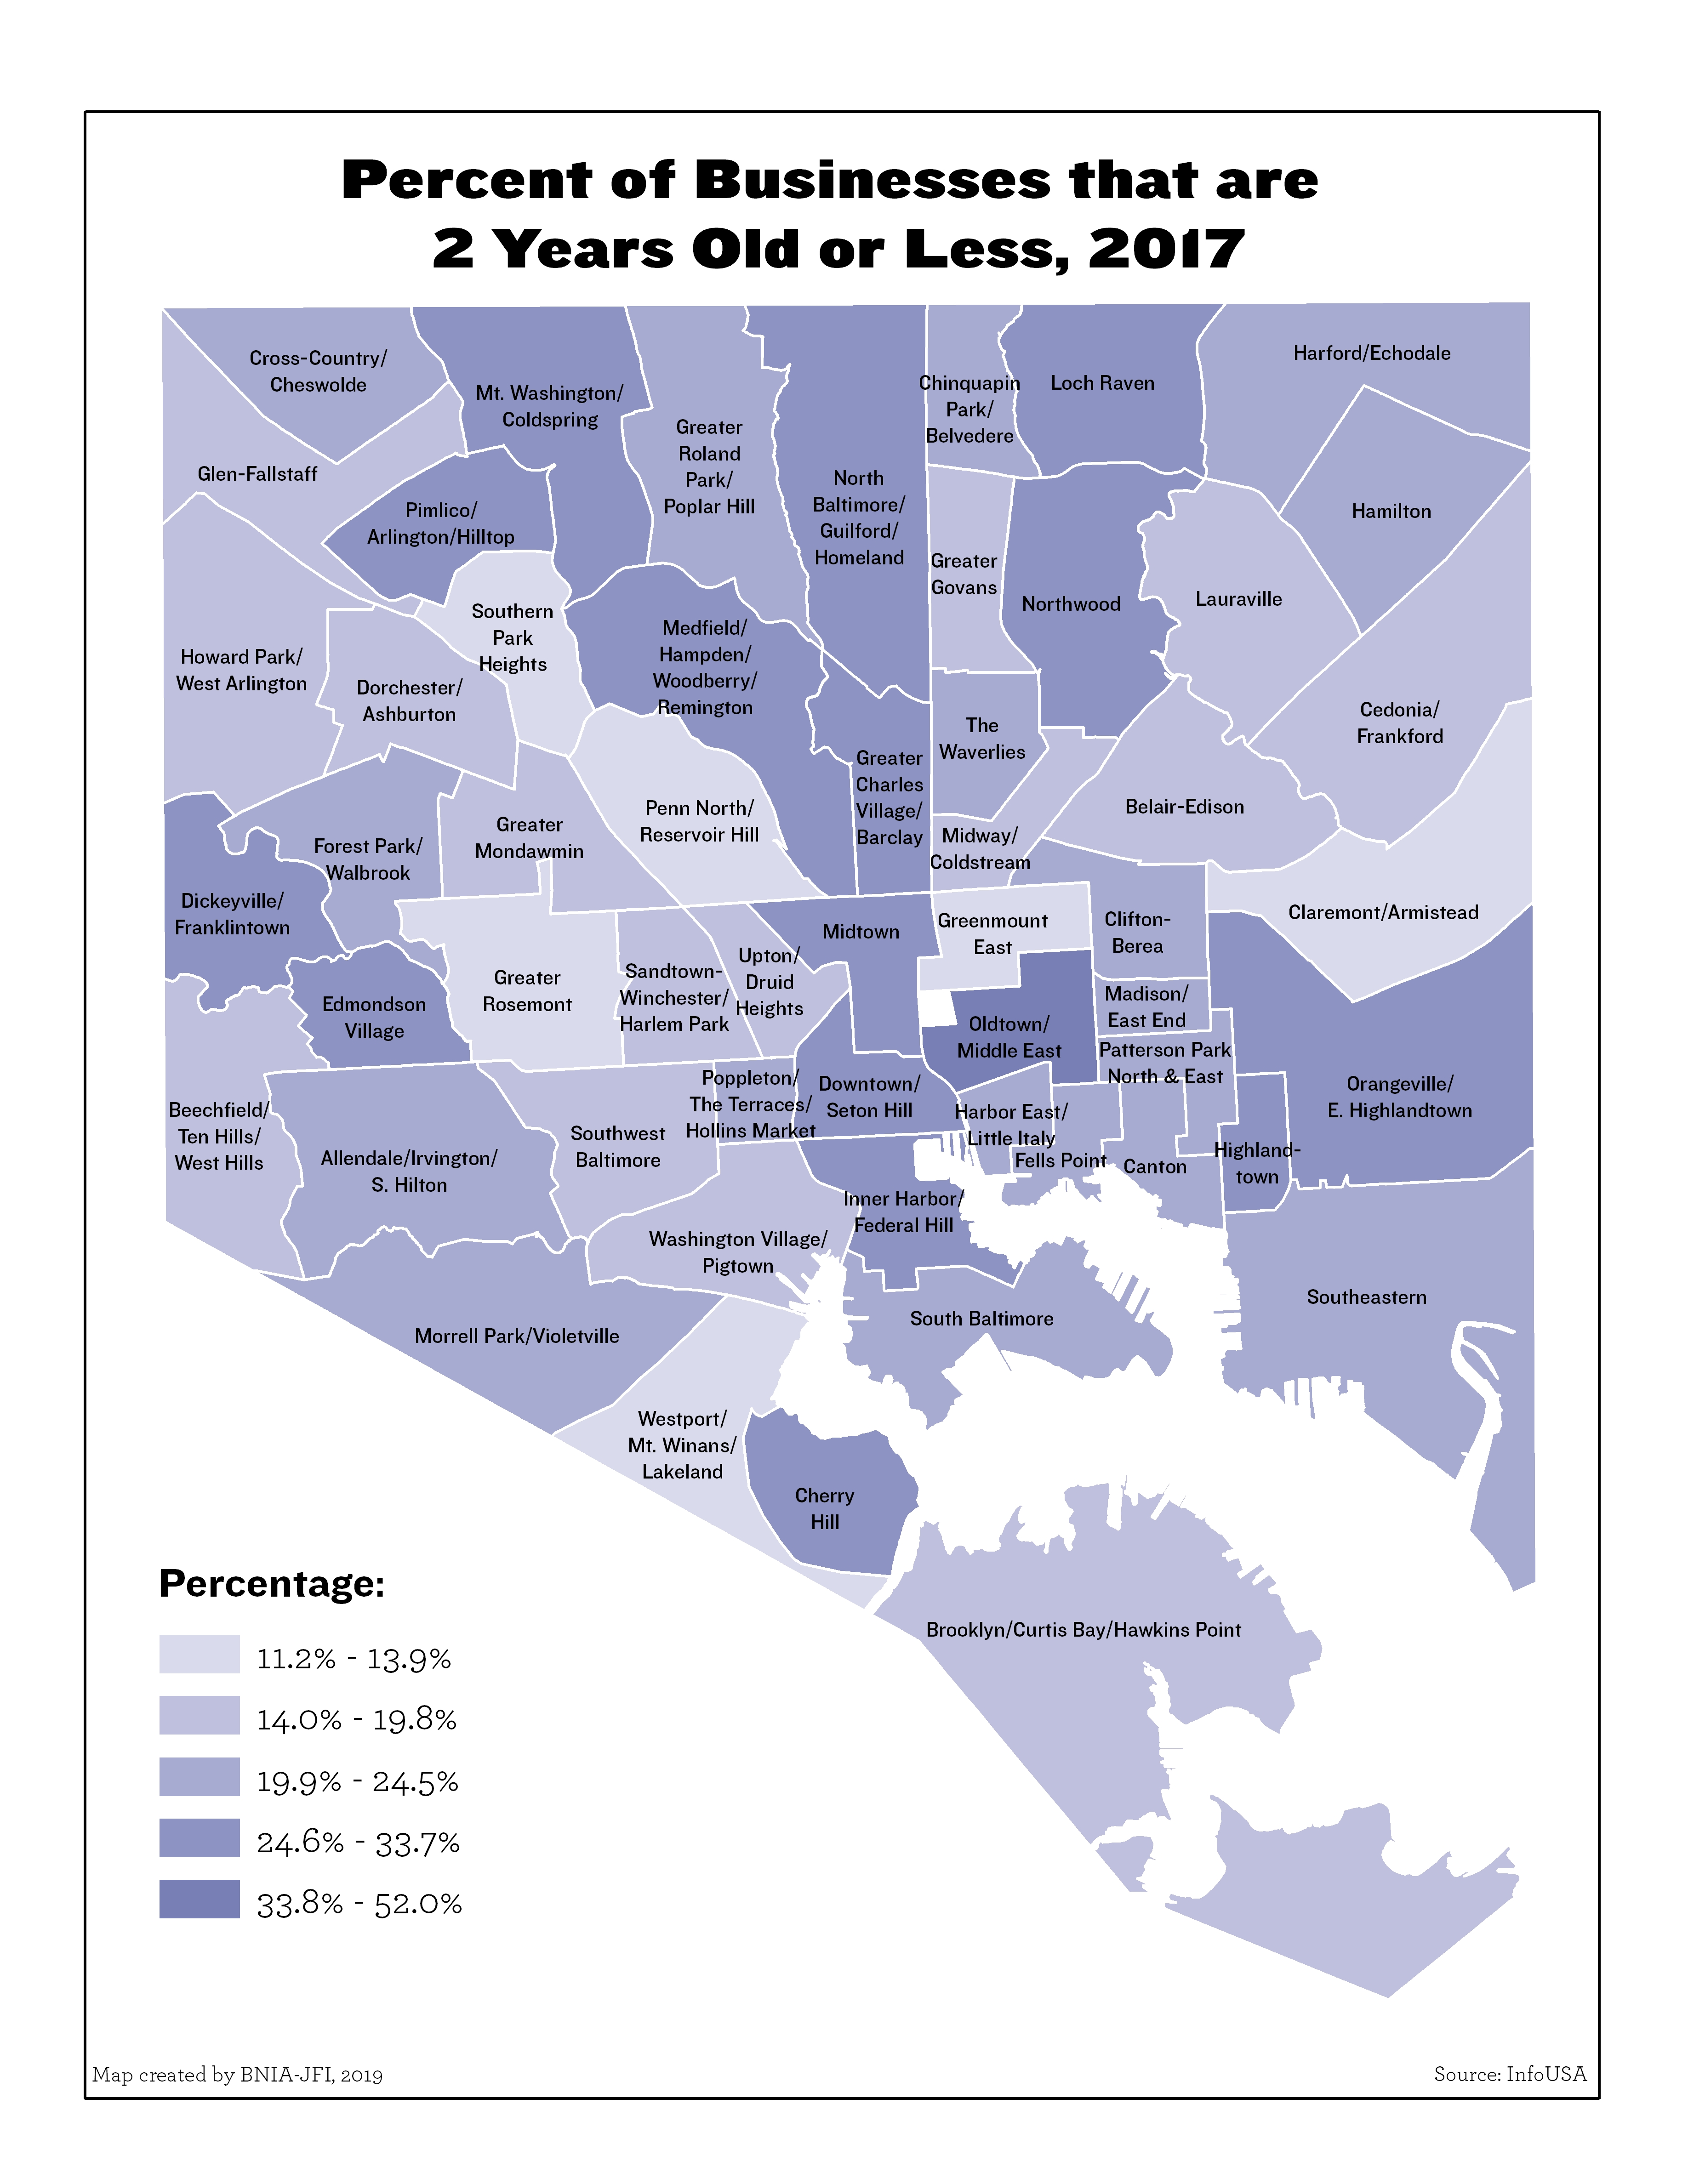
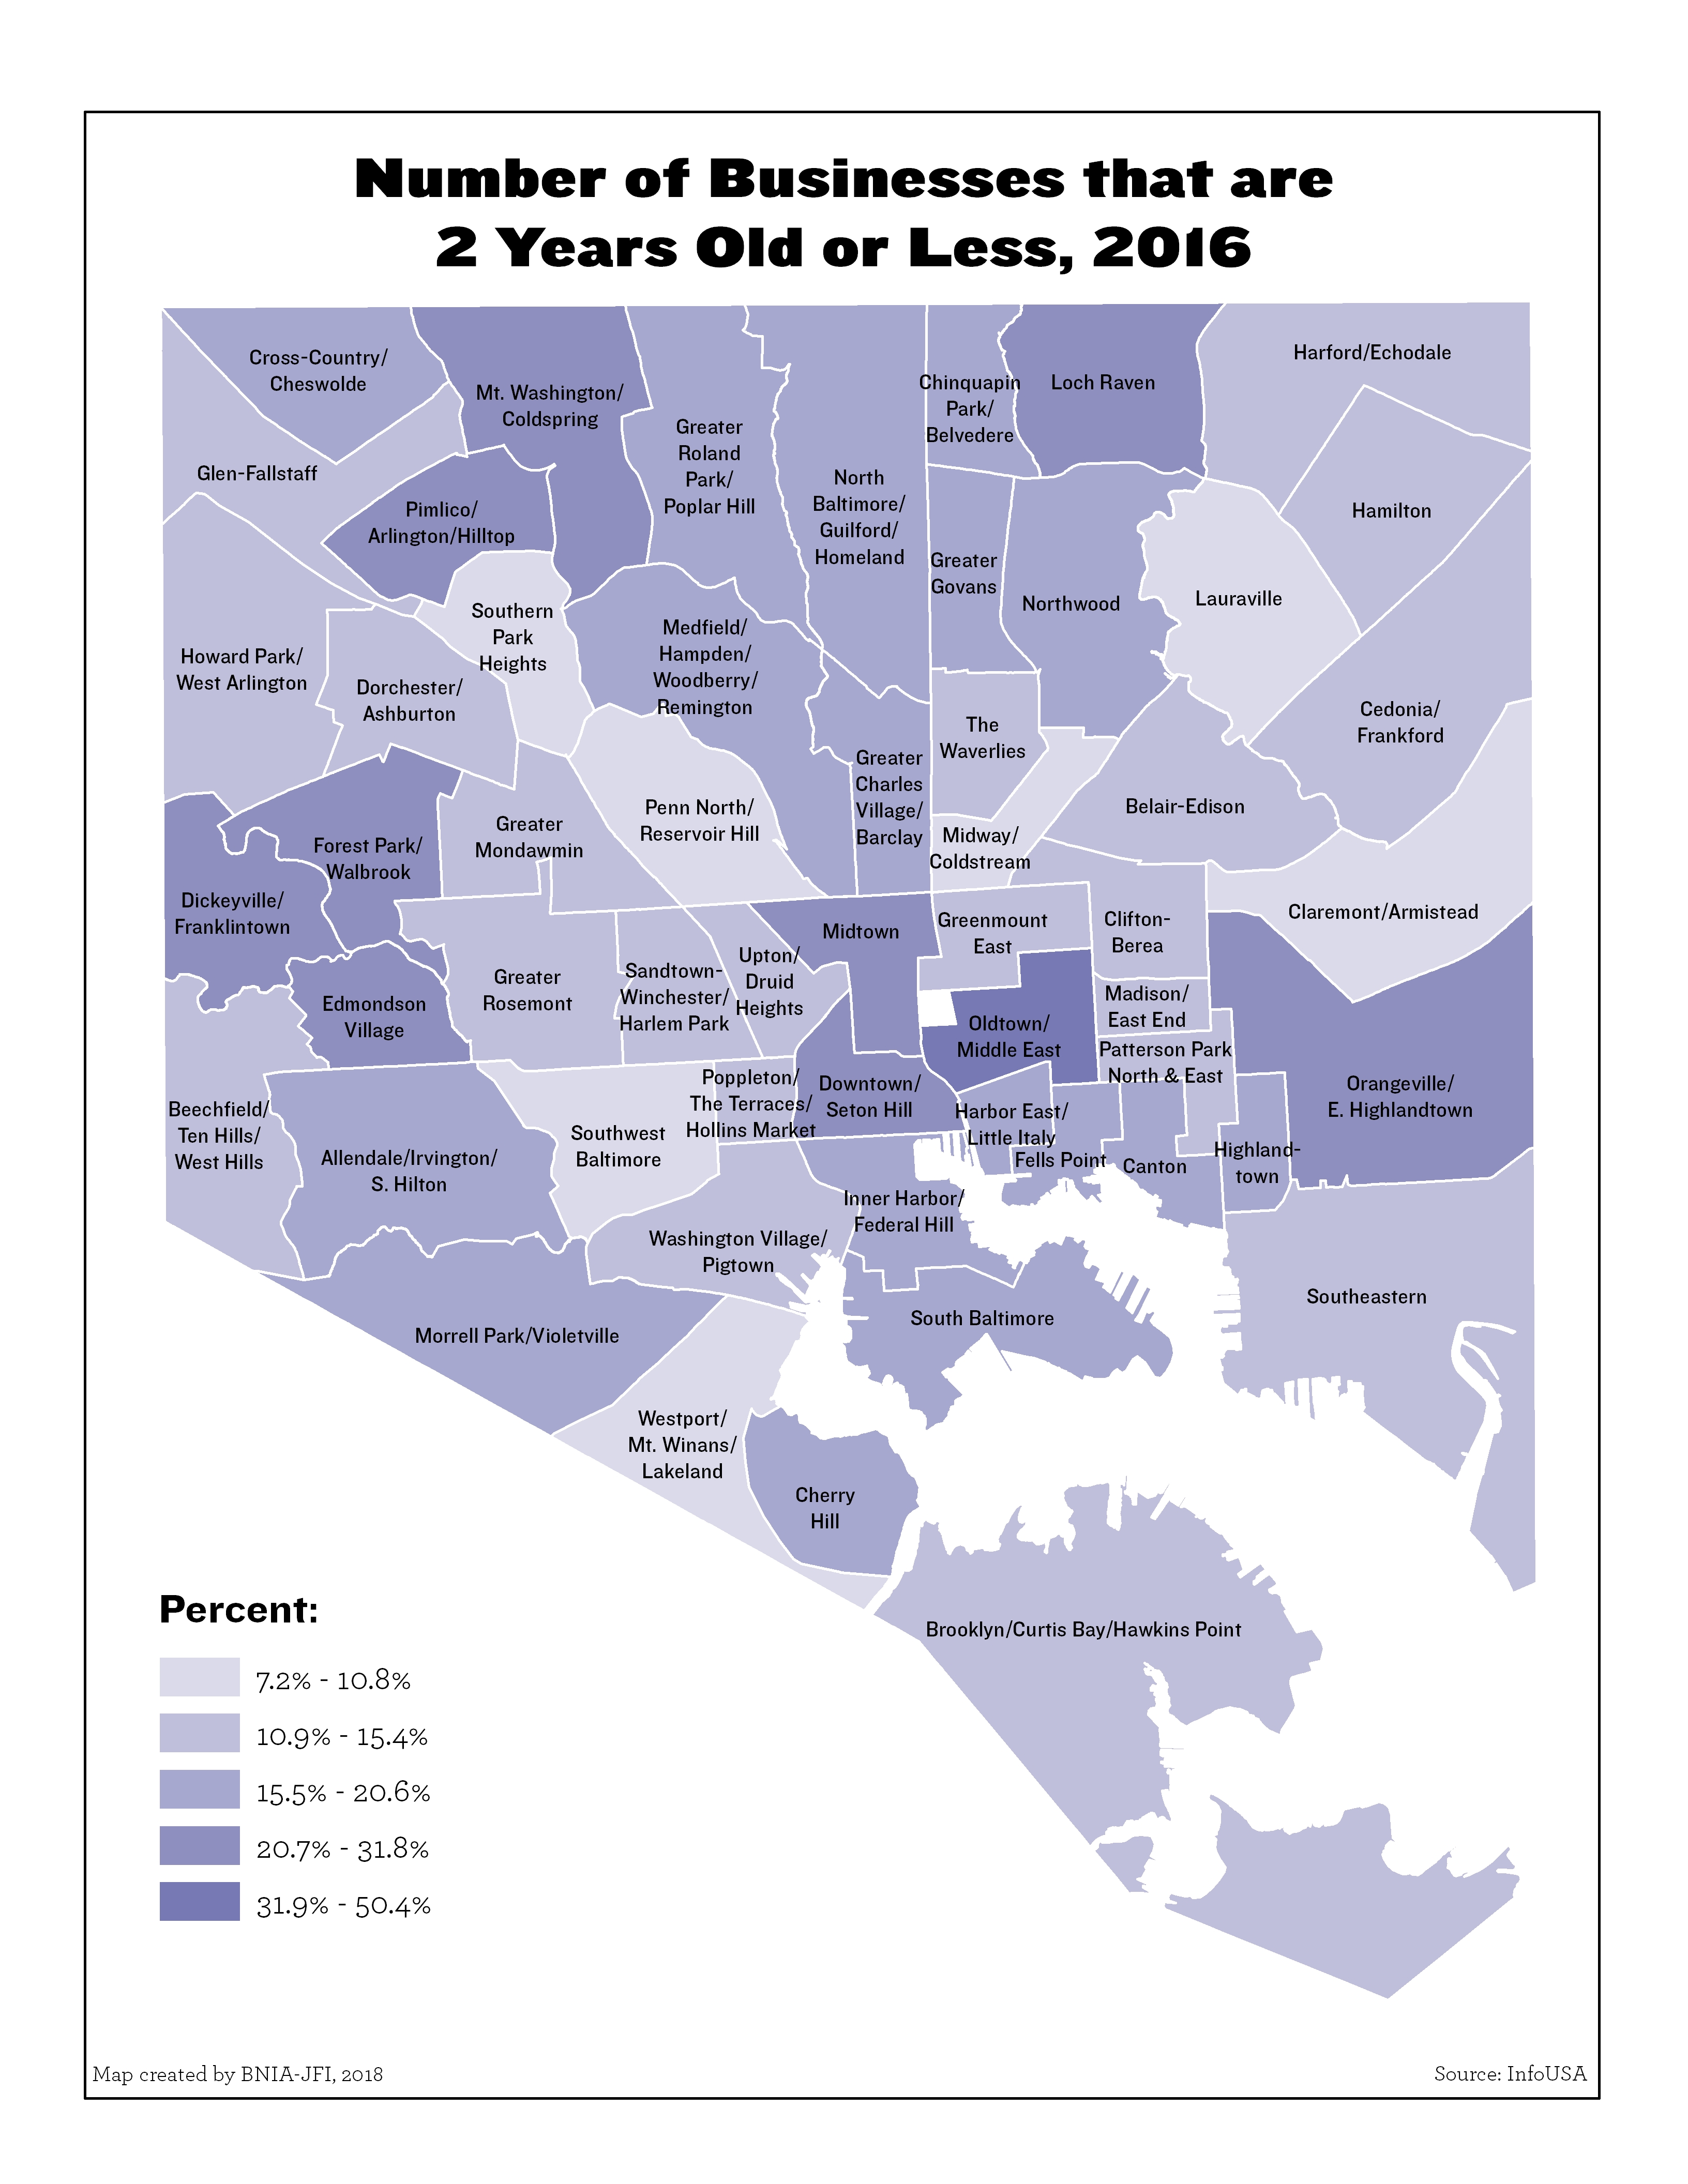
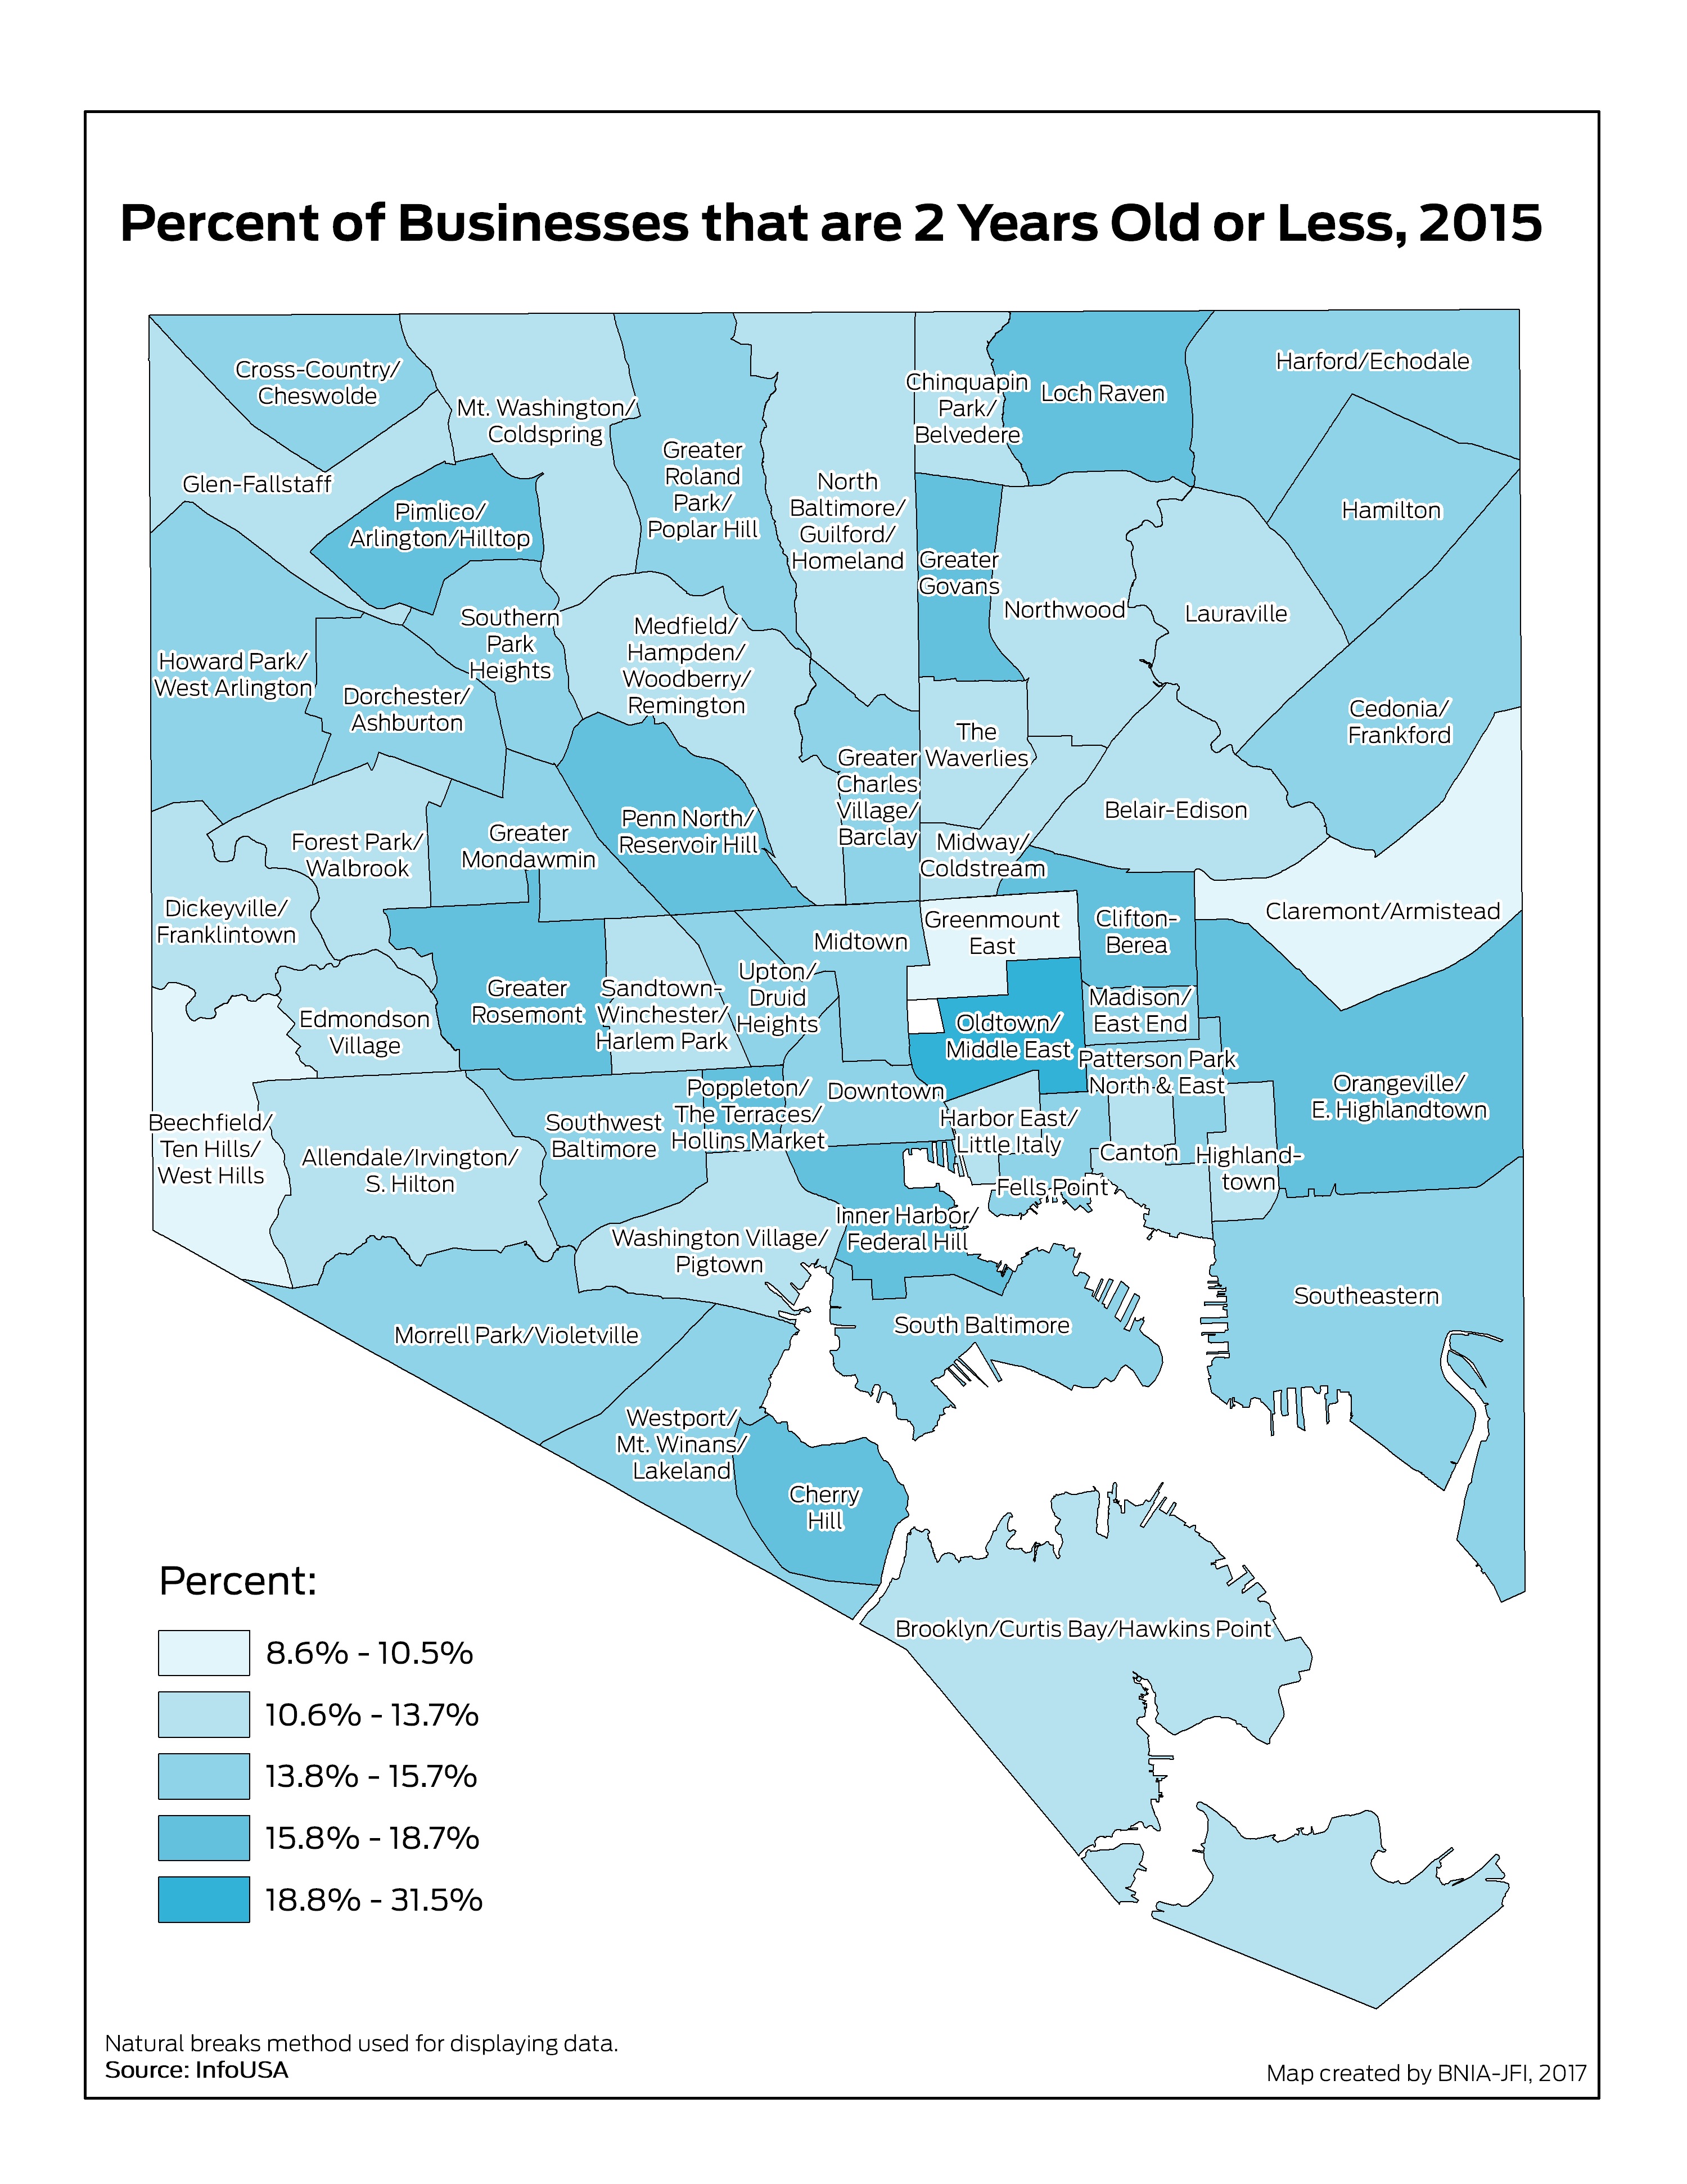
Percent of Businesses that are 2 Years old or Less
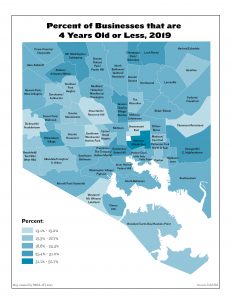
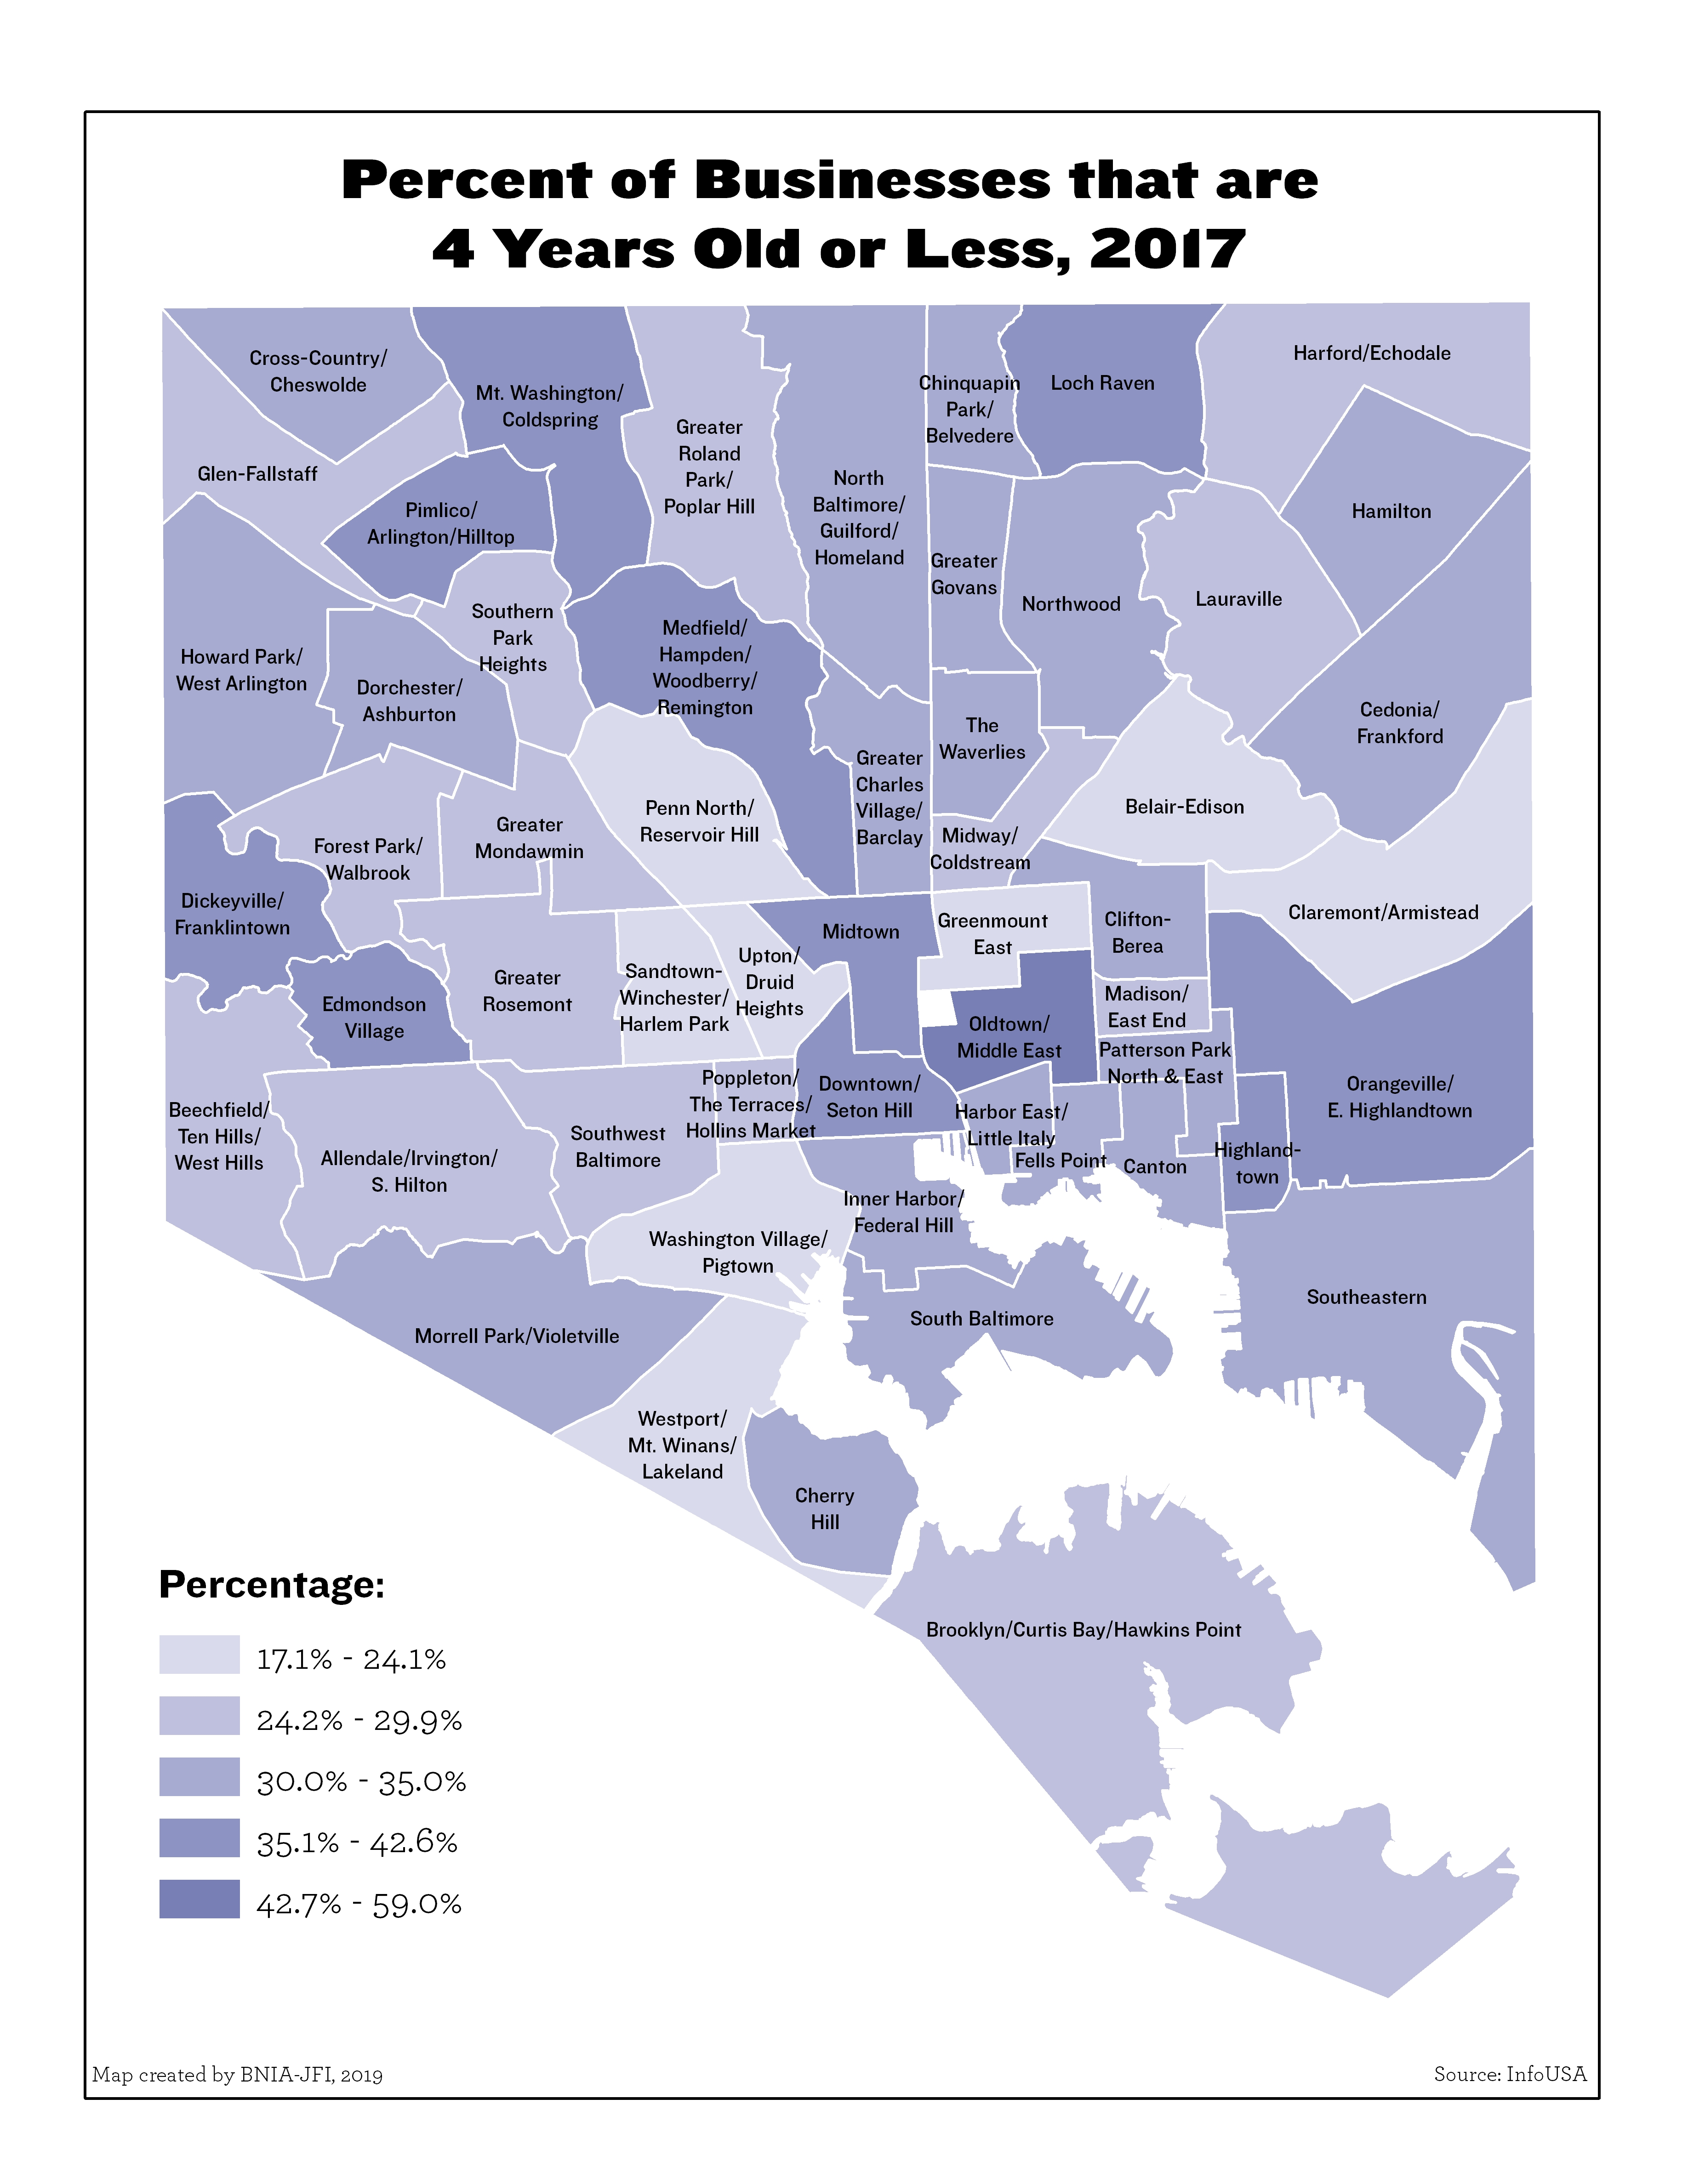
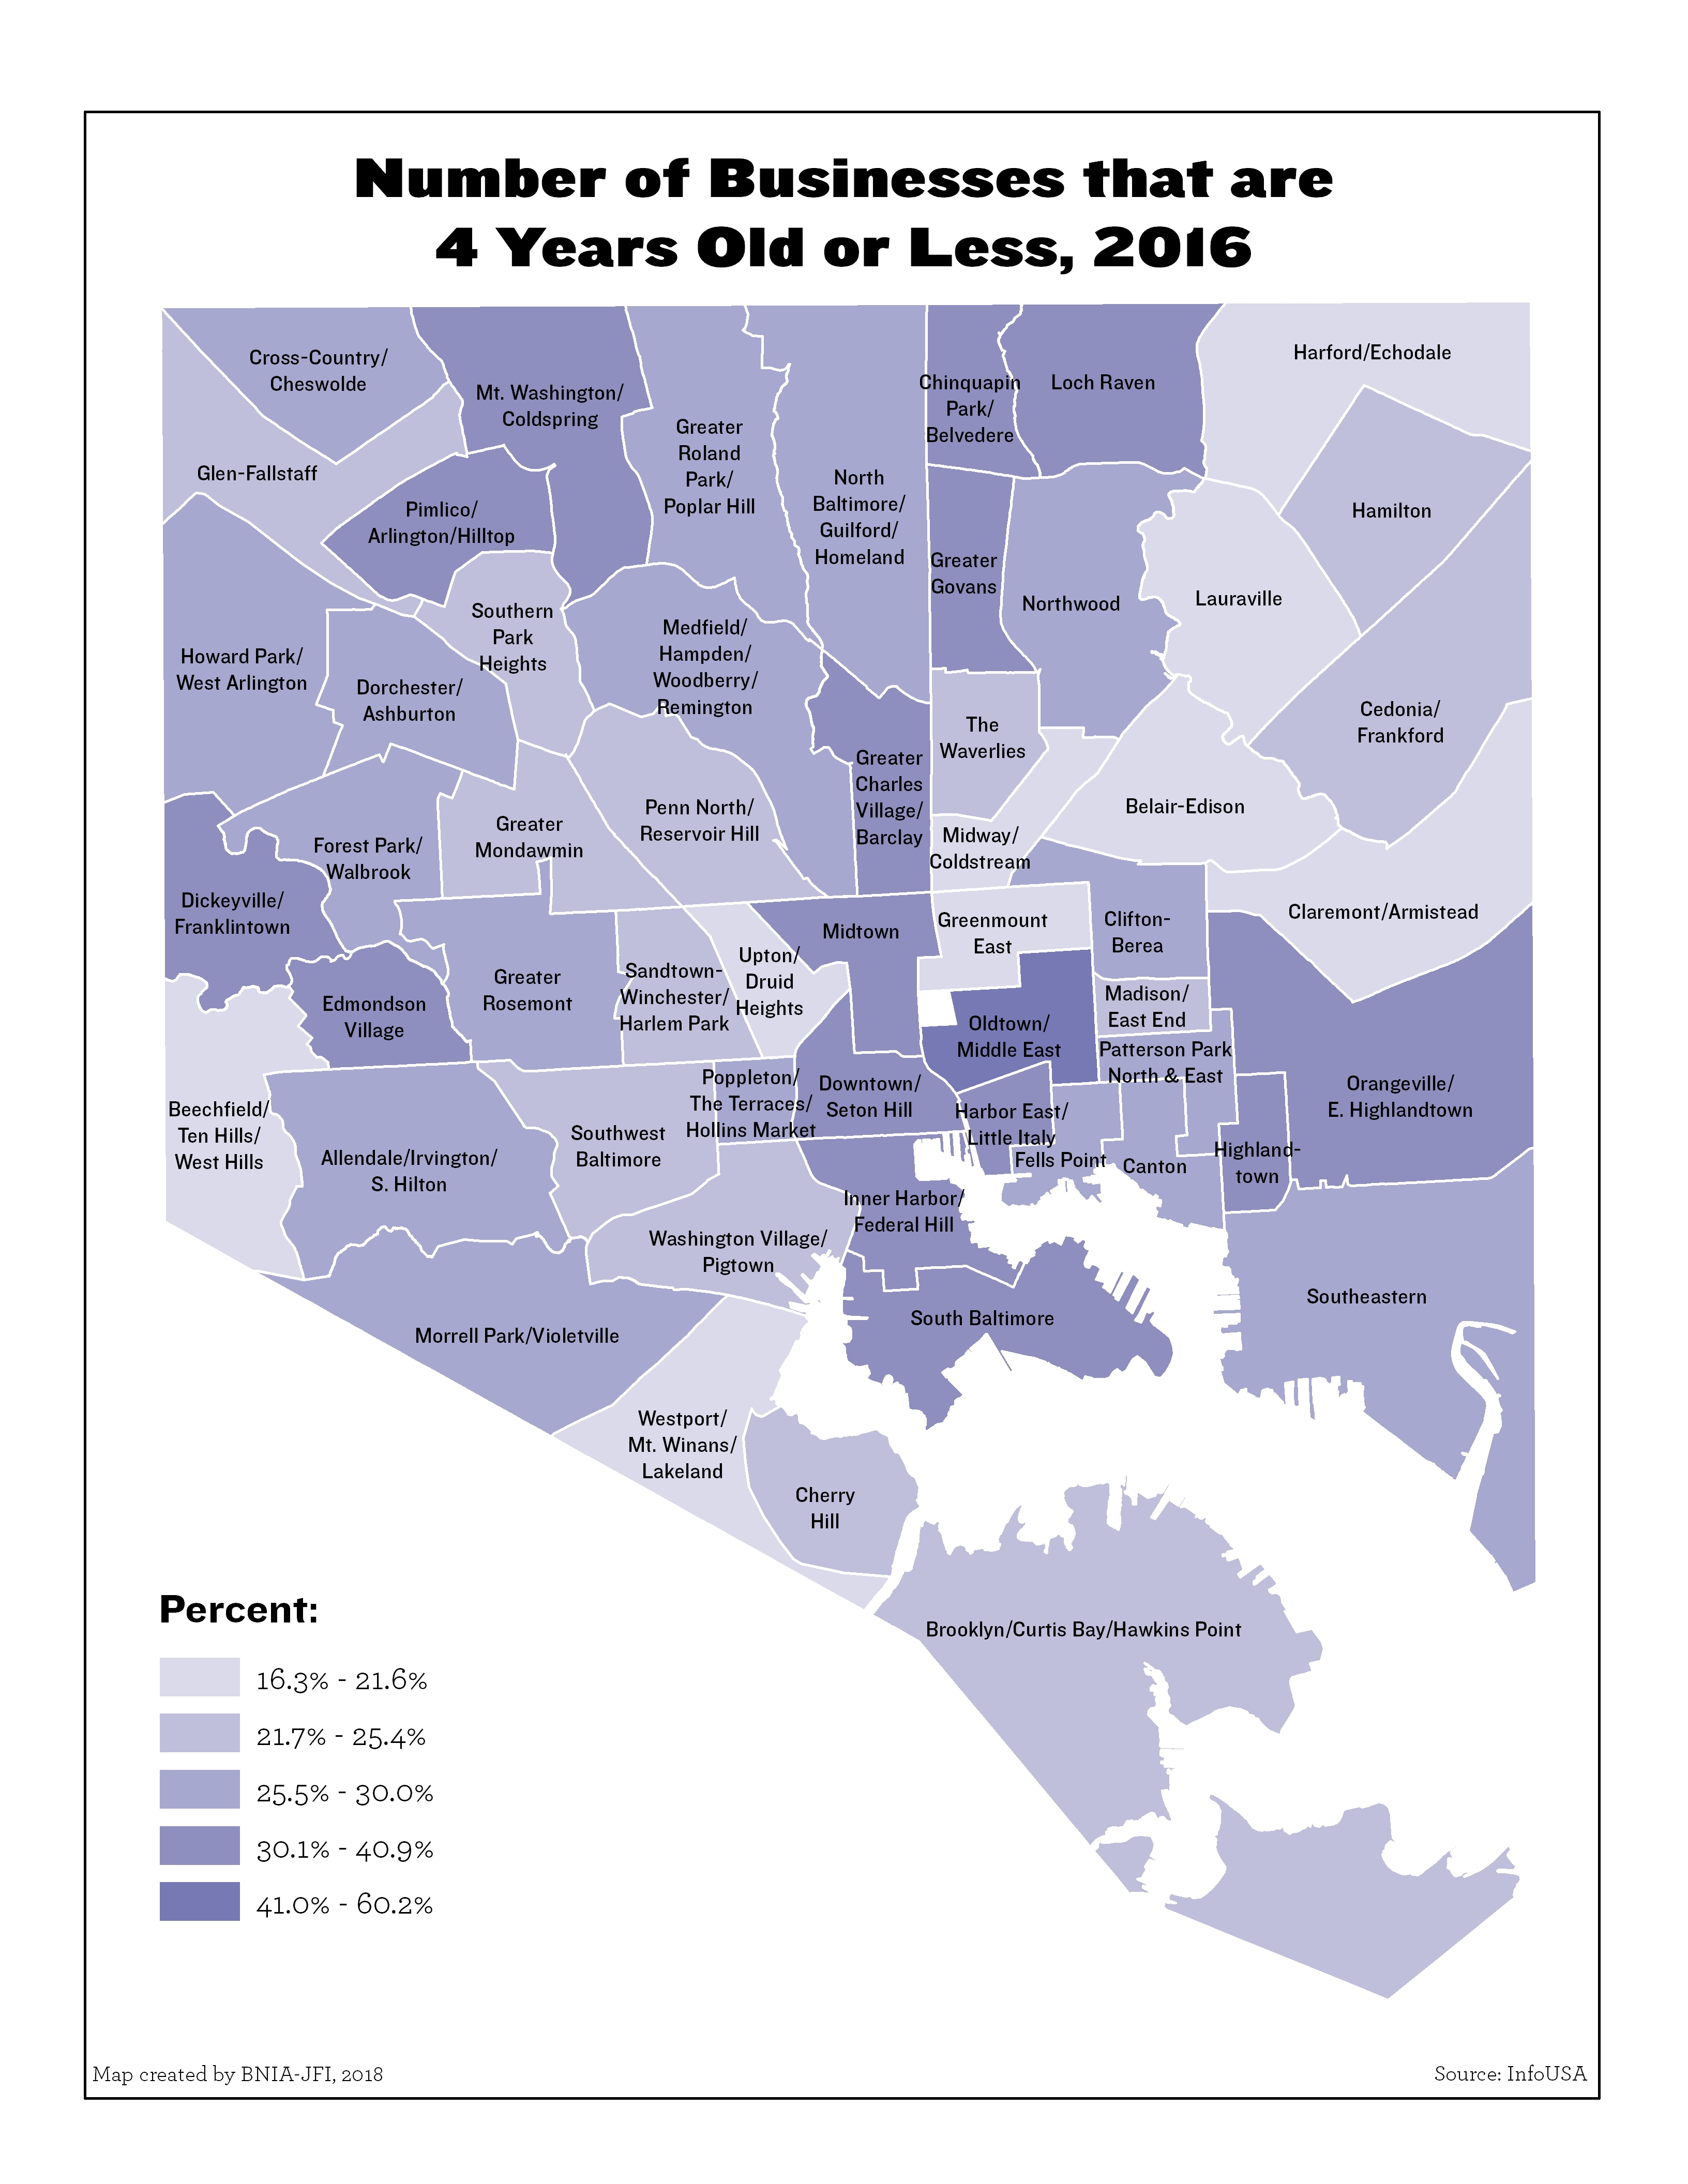
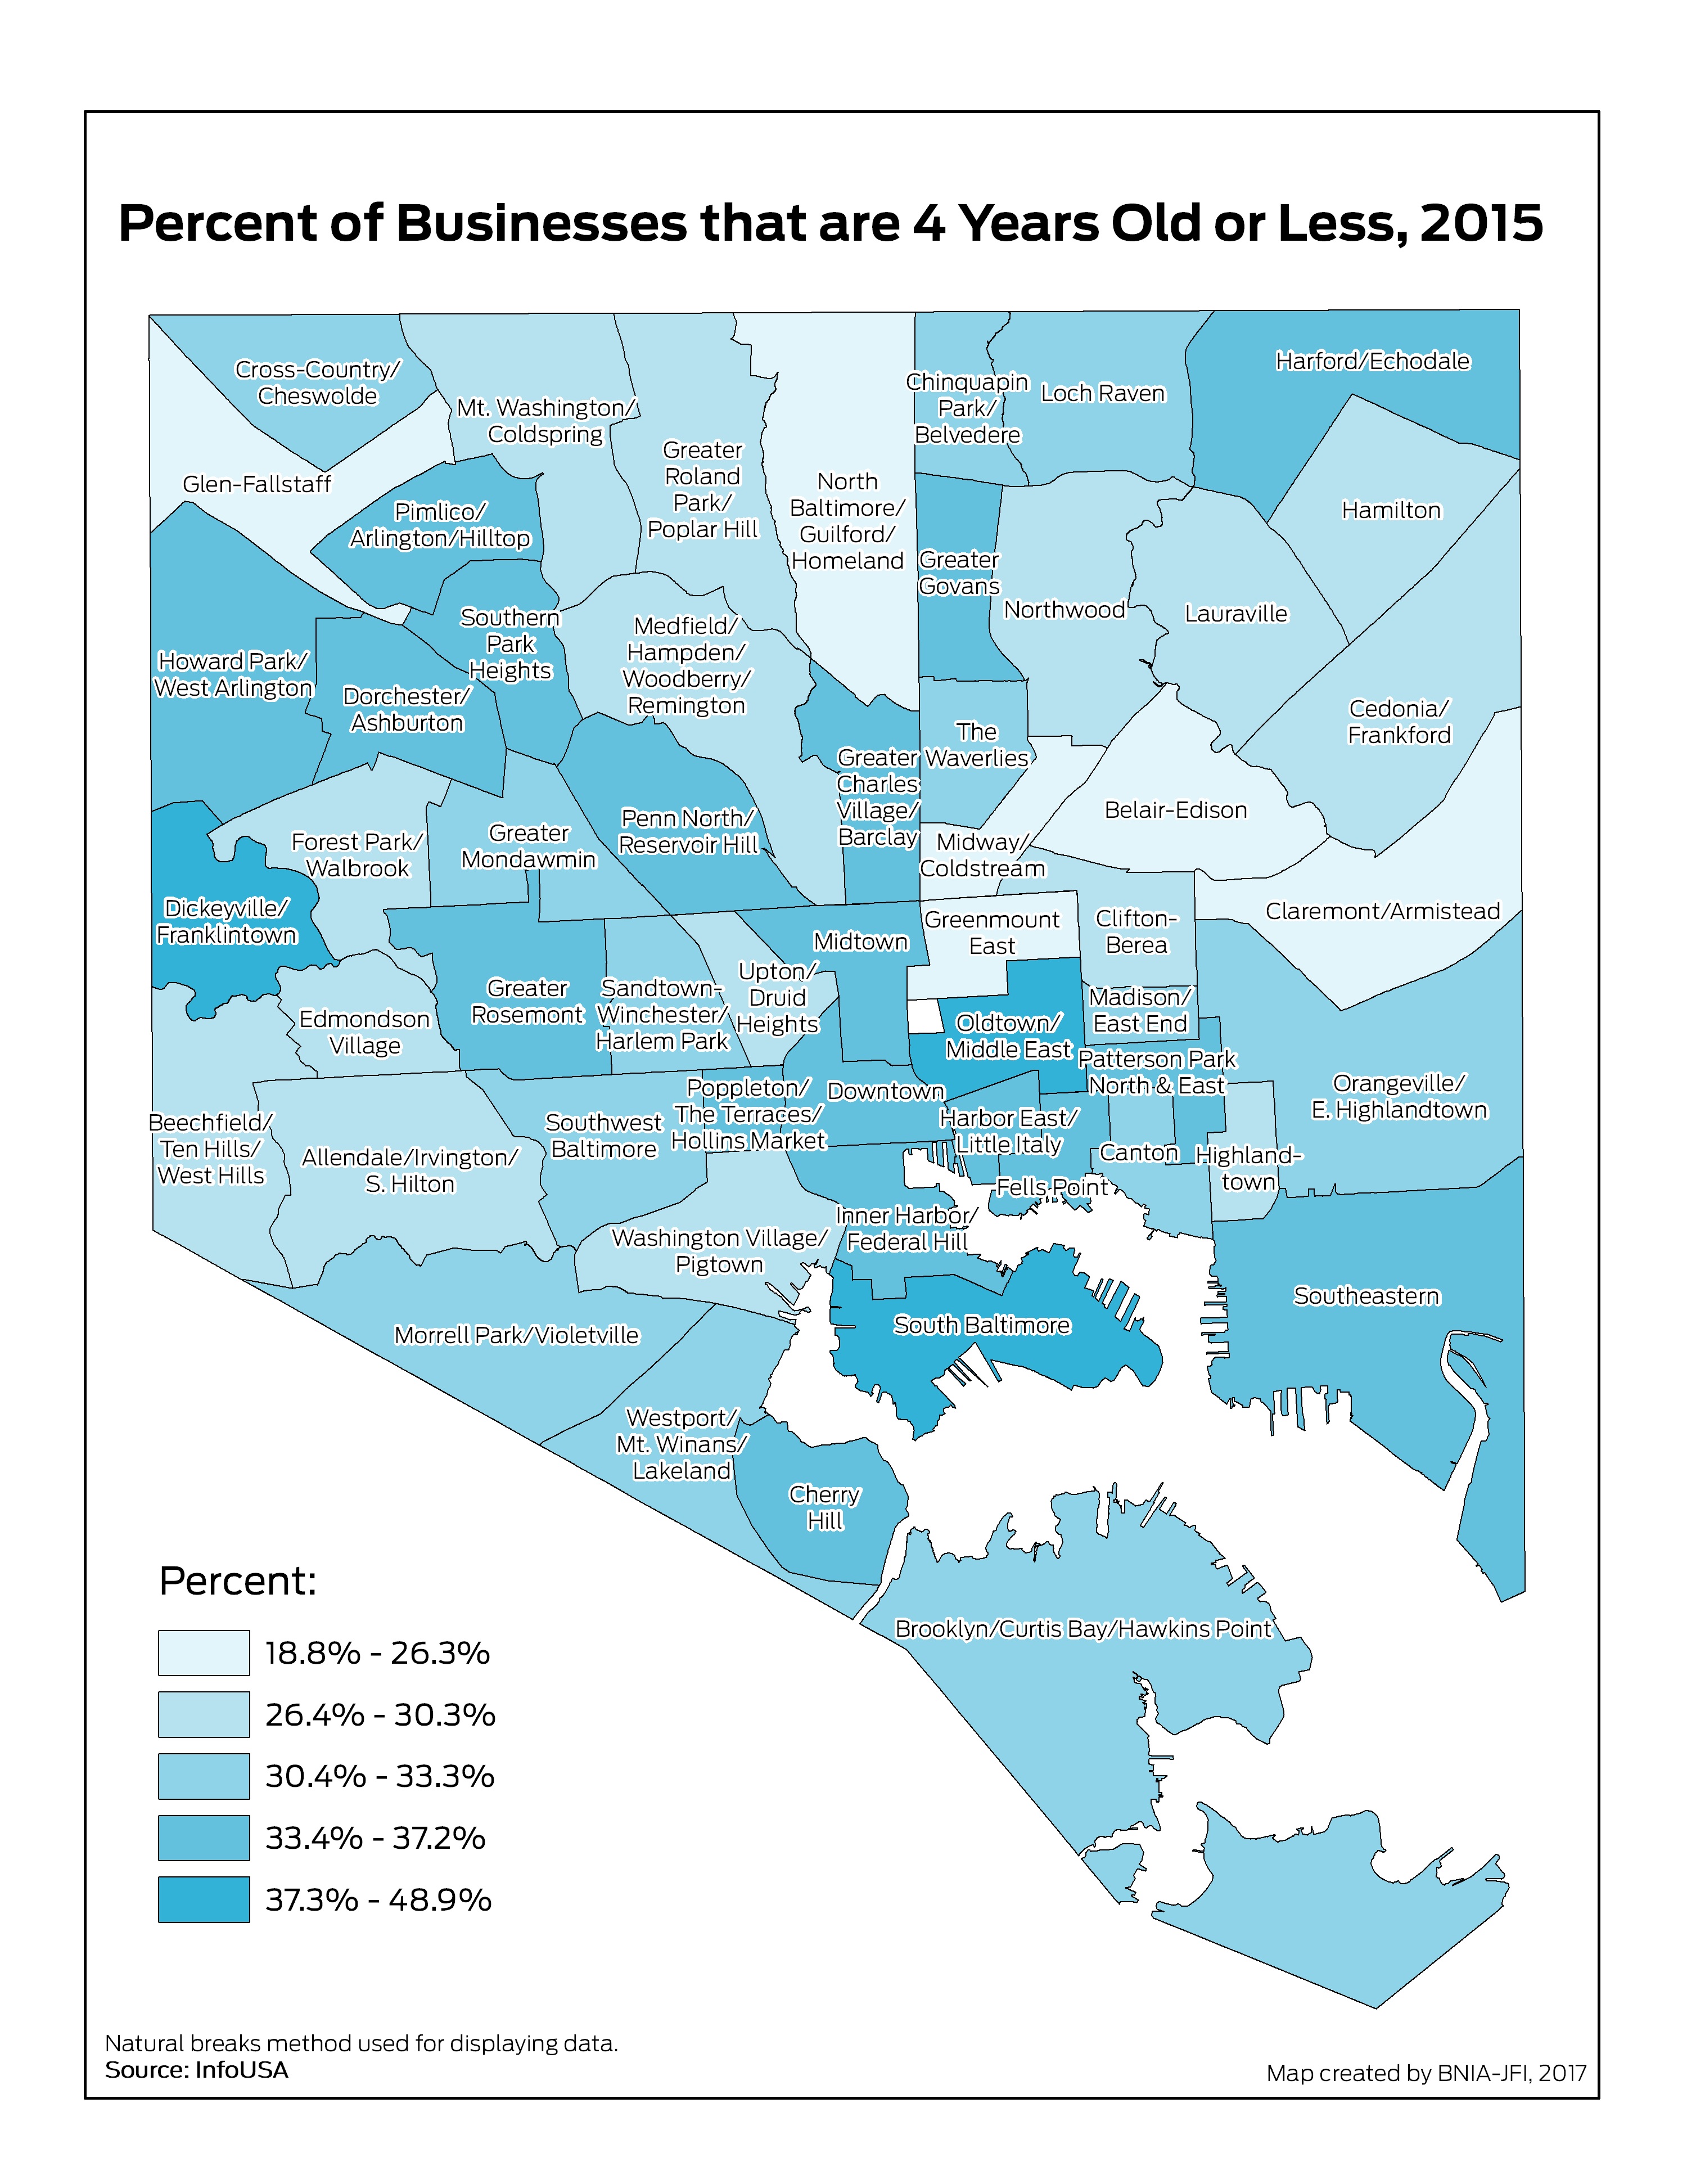
Percent of Businesses that are 4 Years old or Less
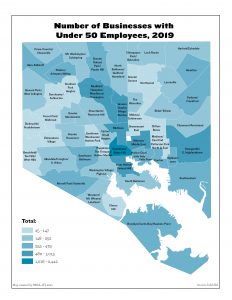
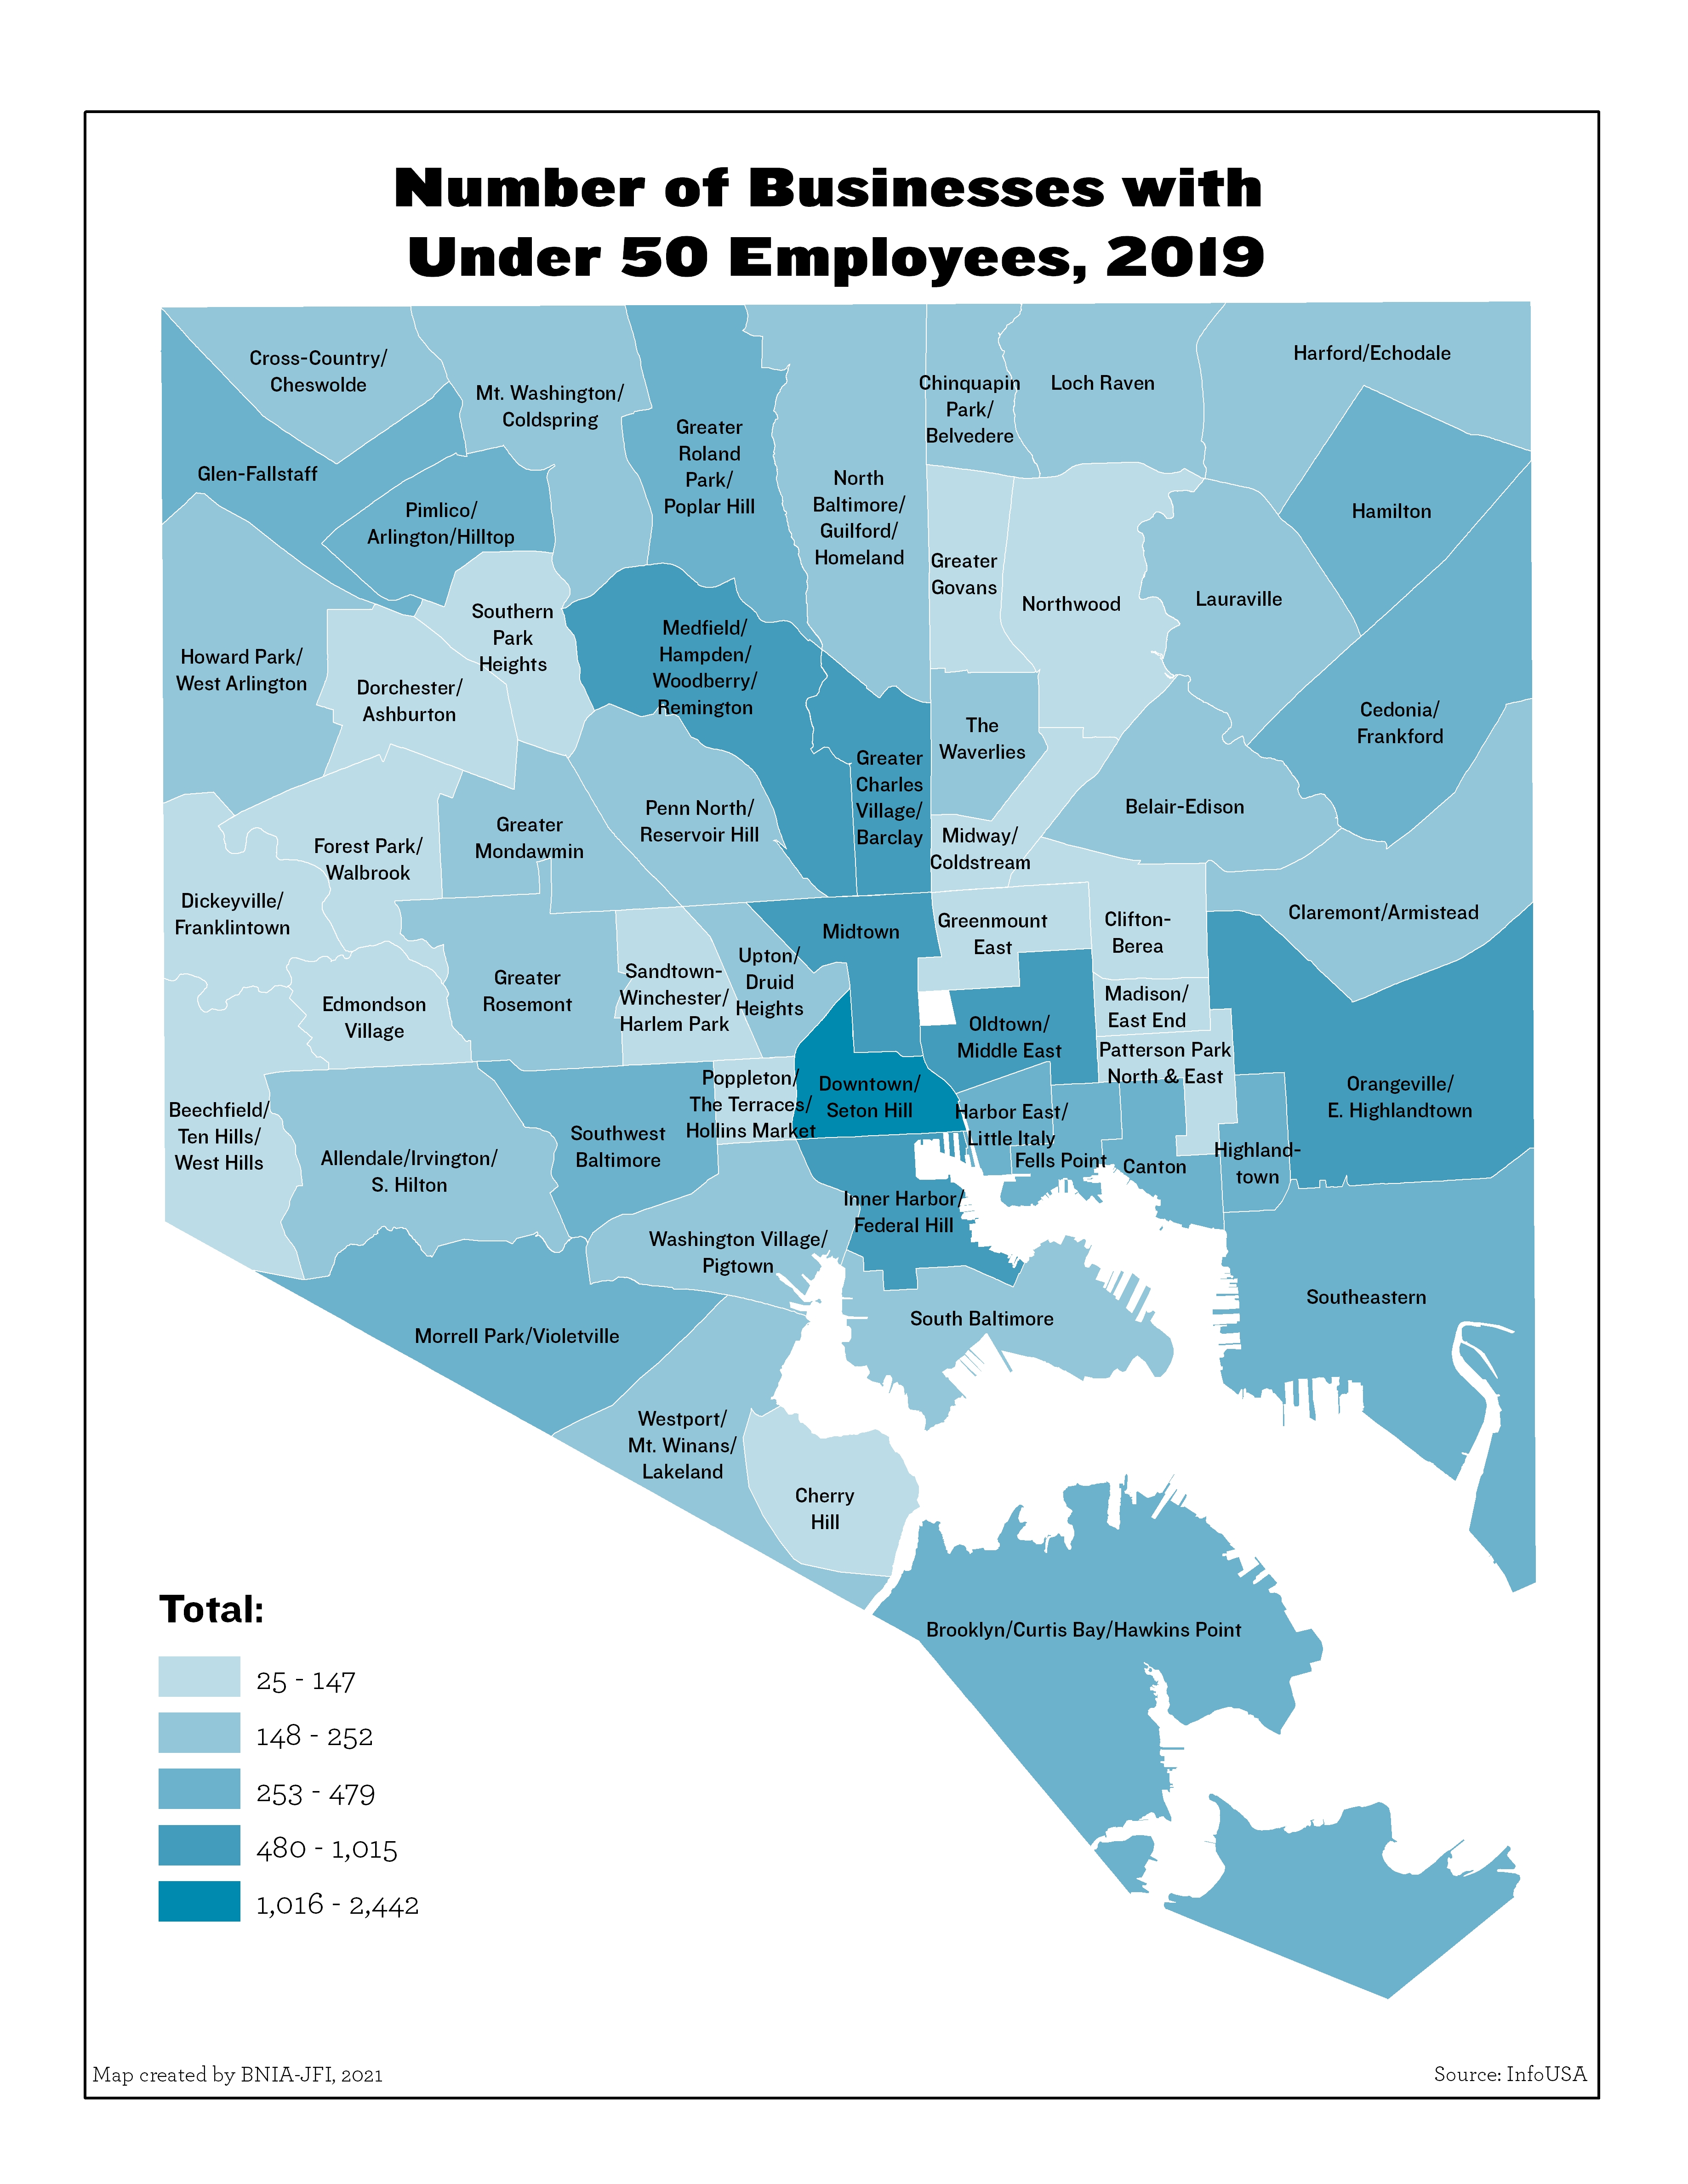
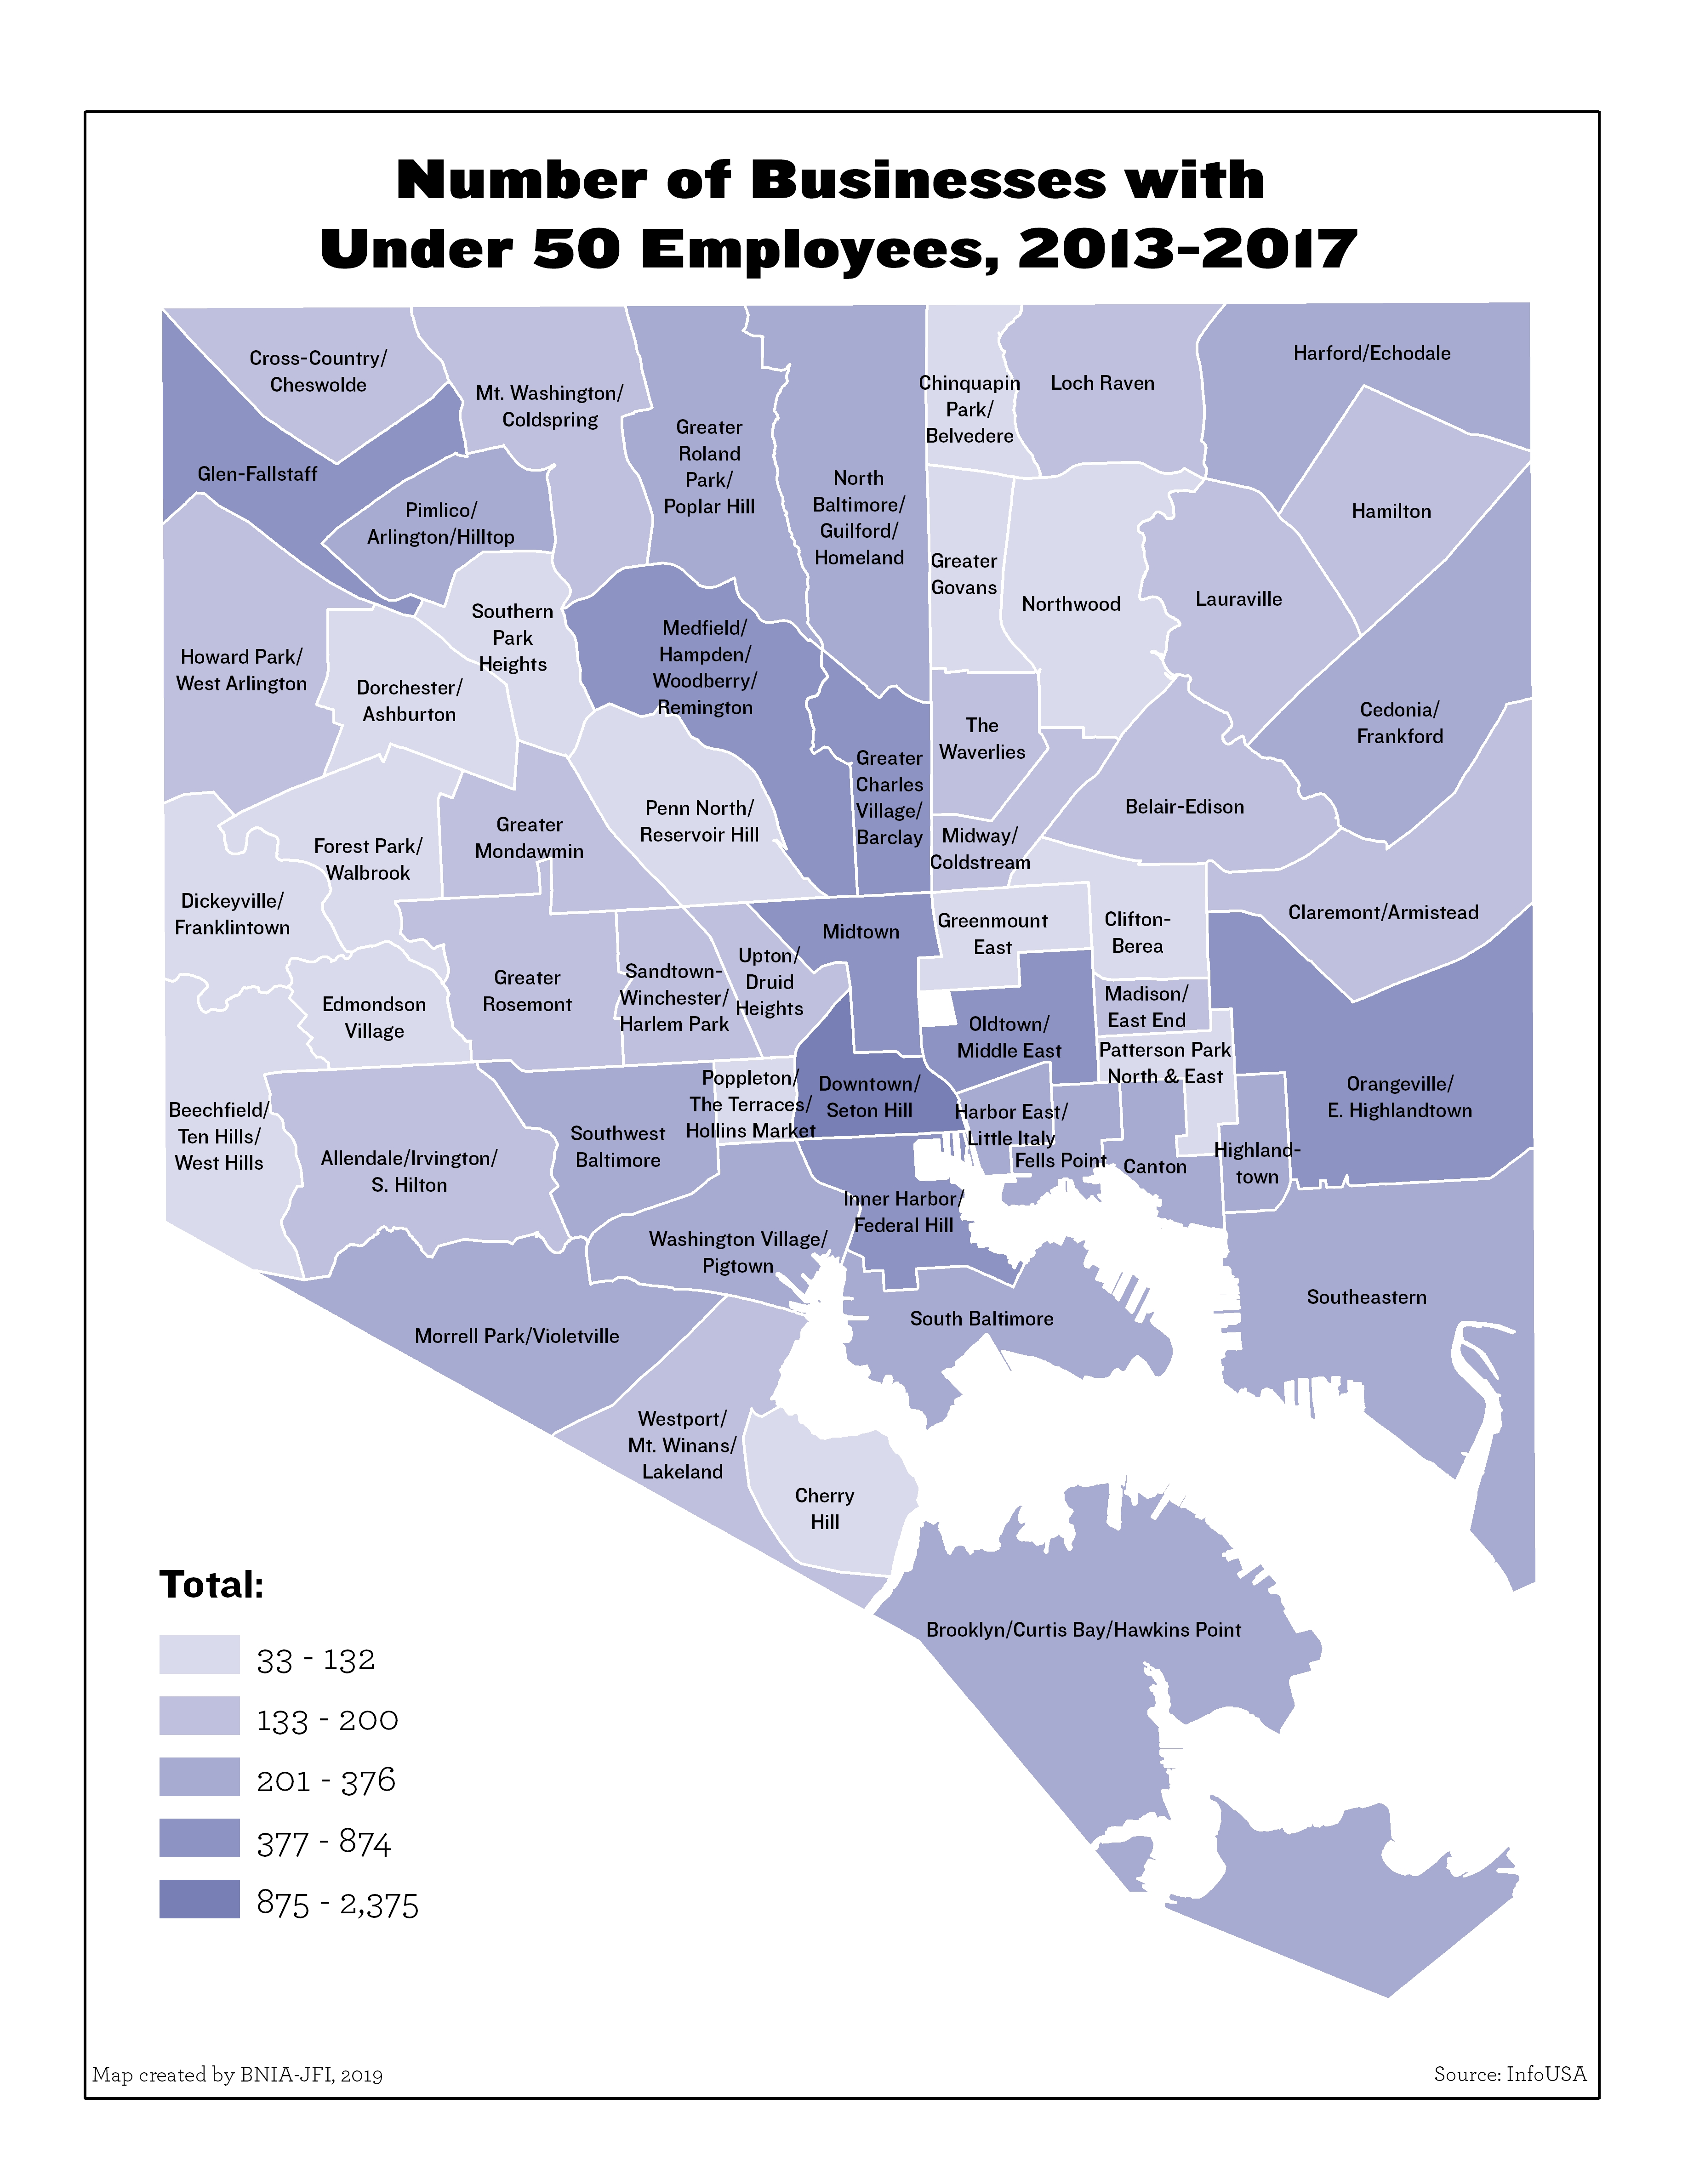
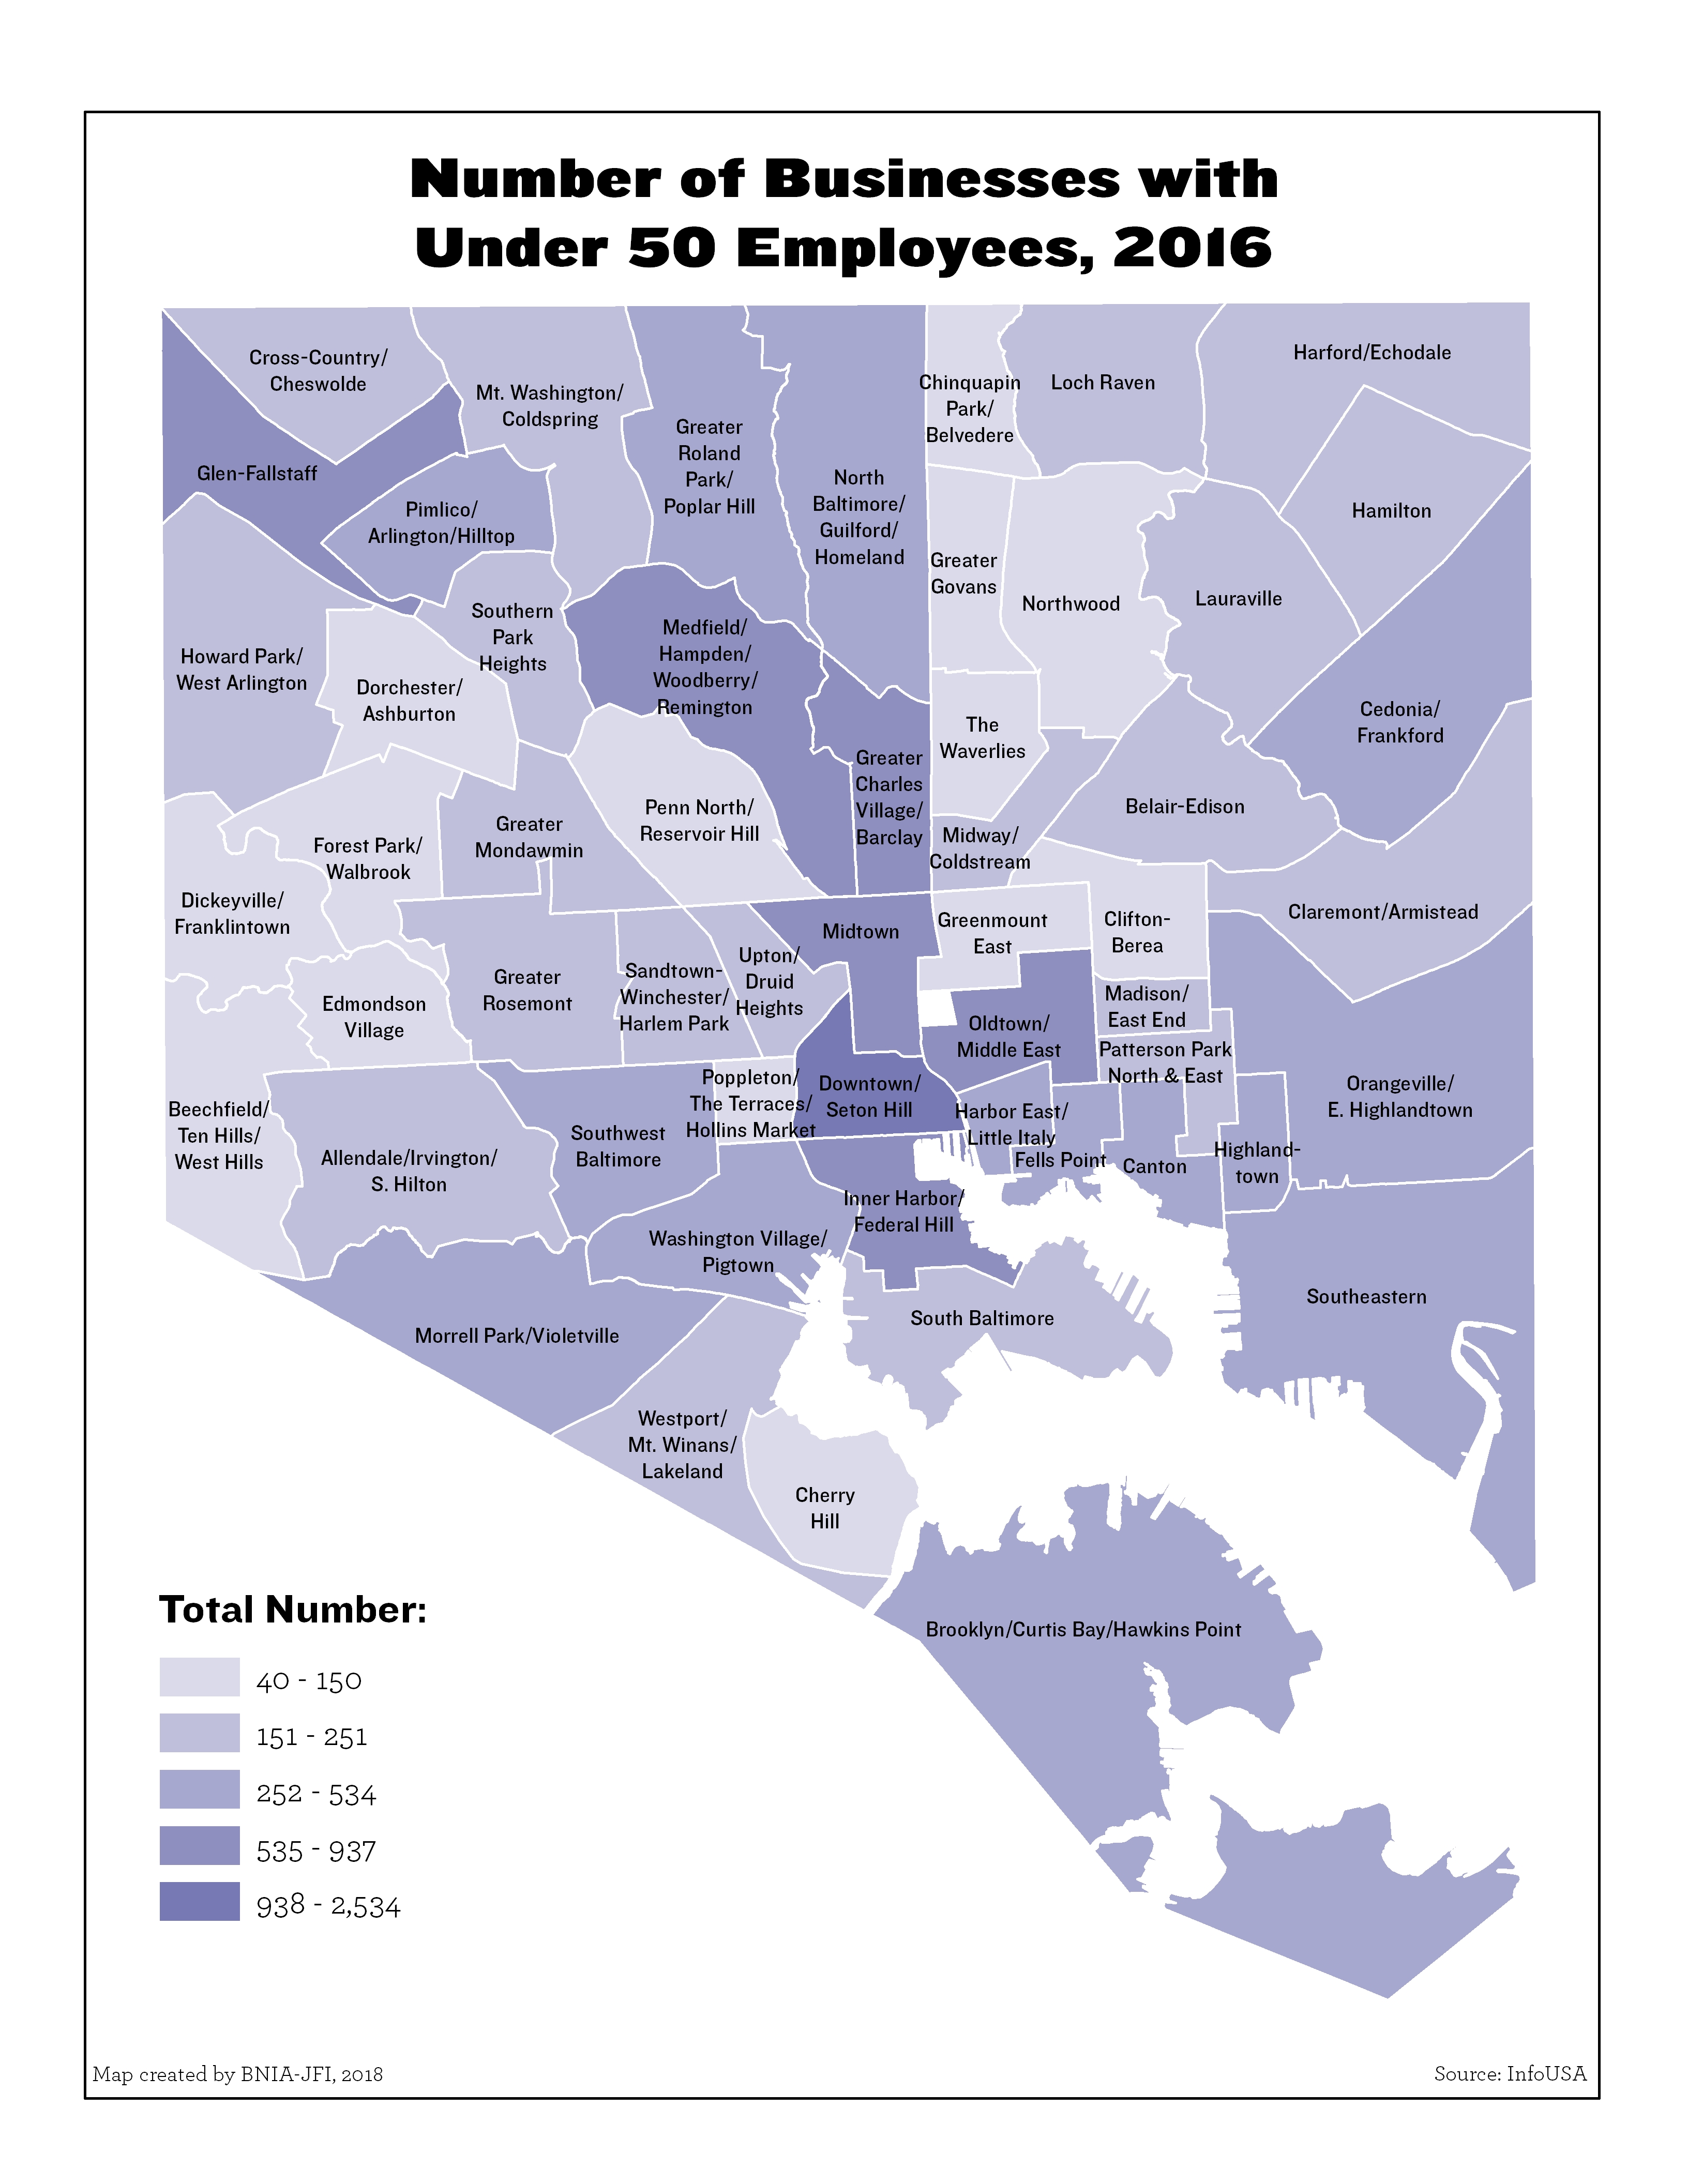
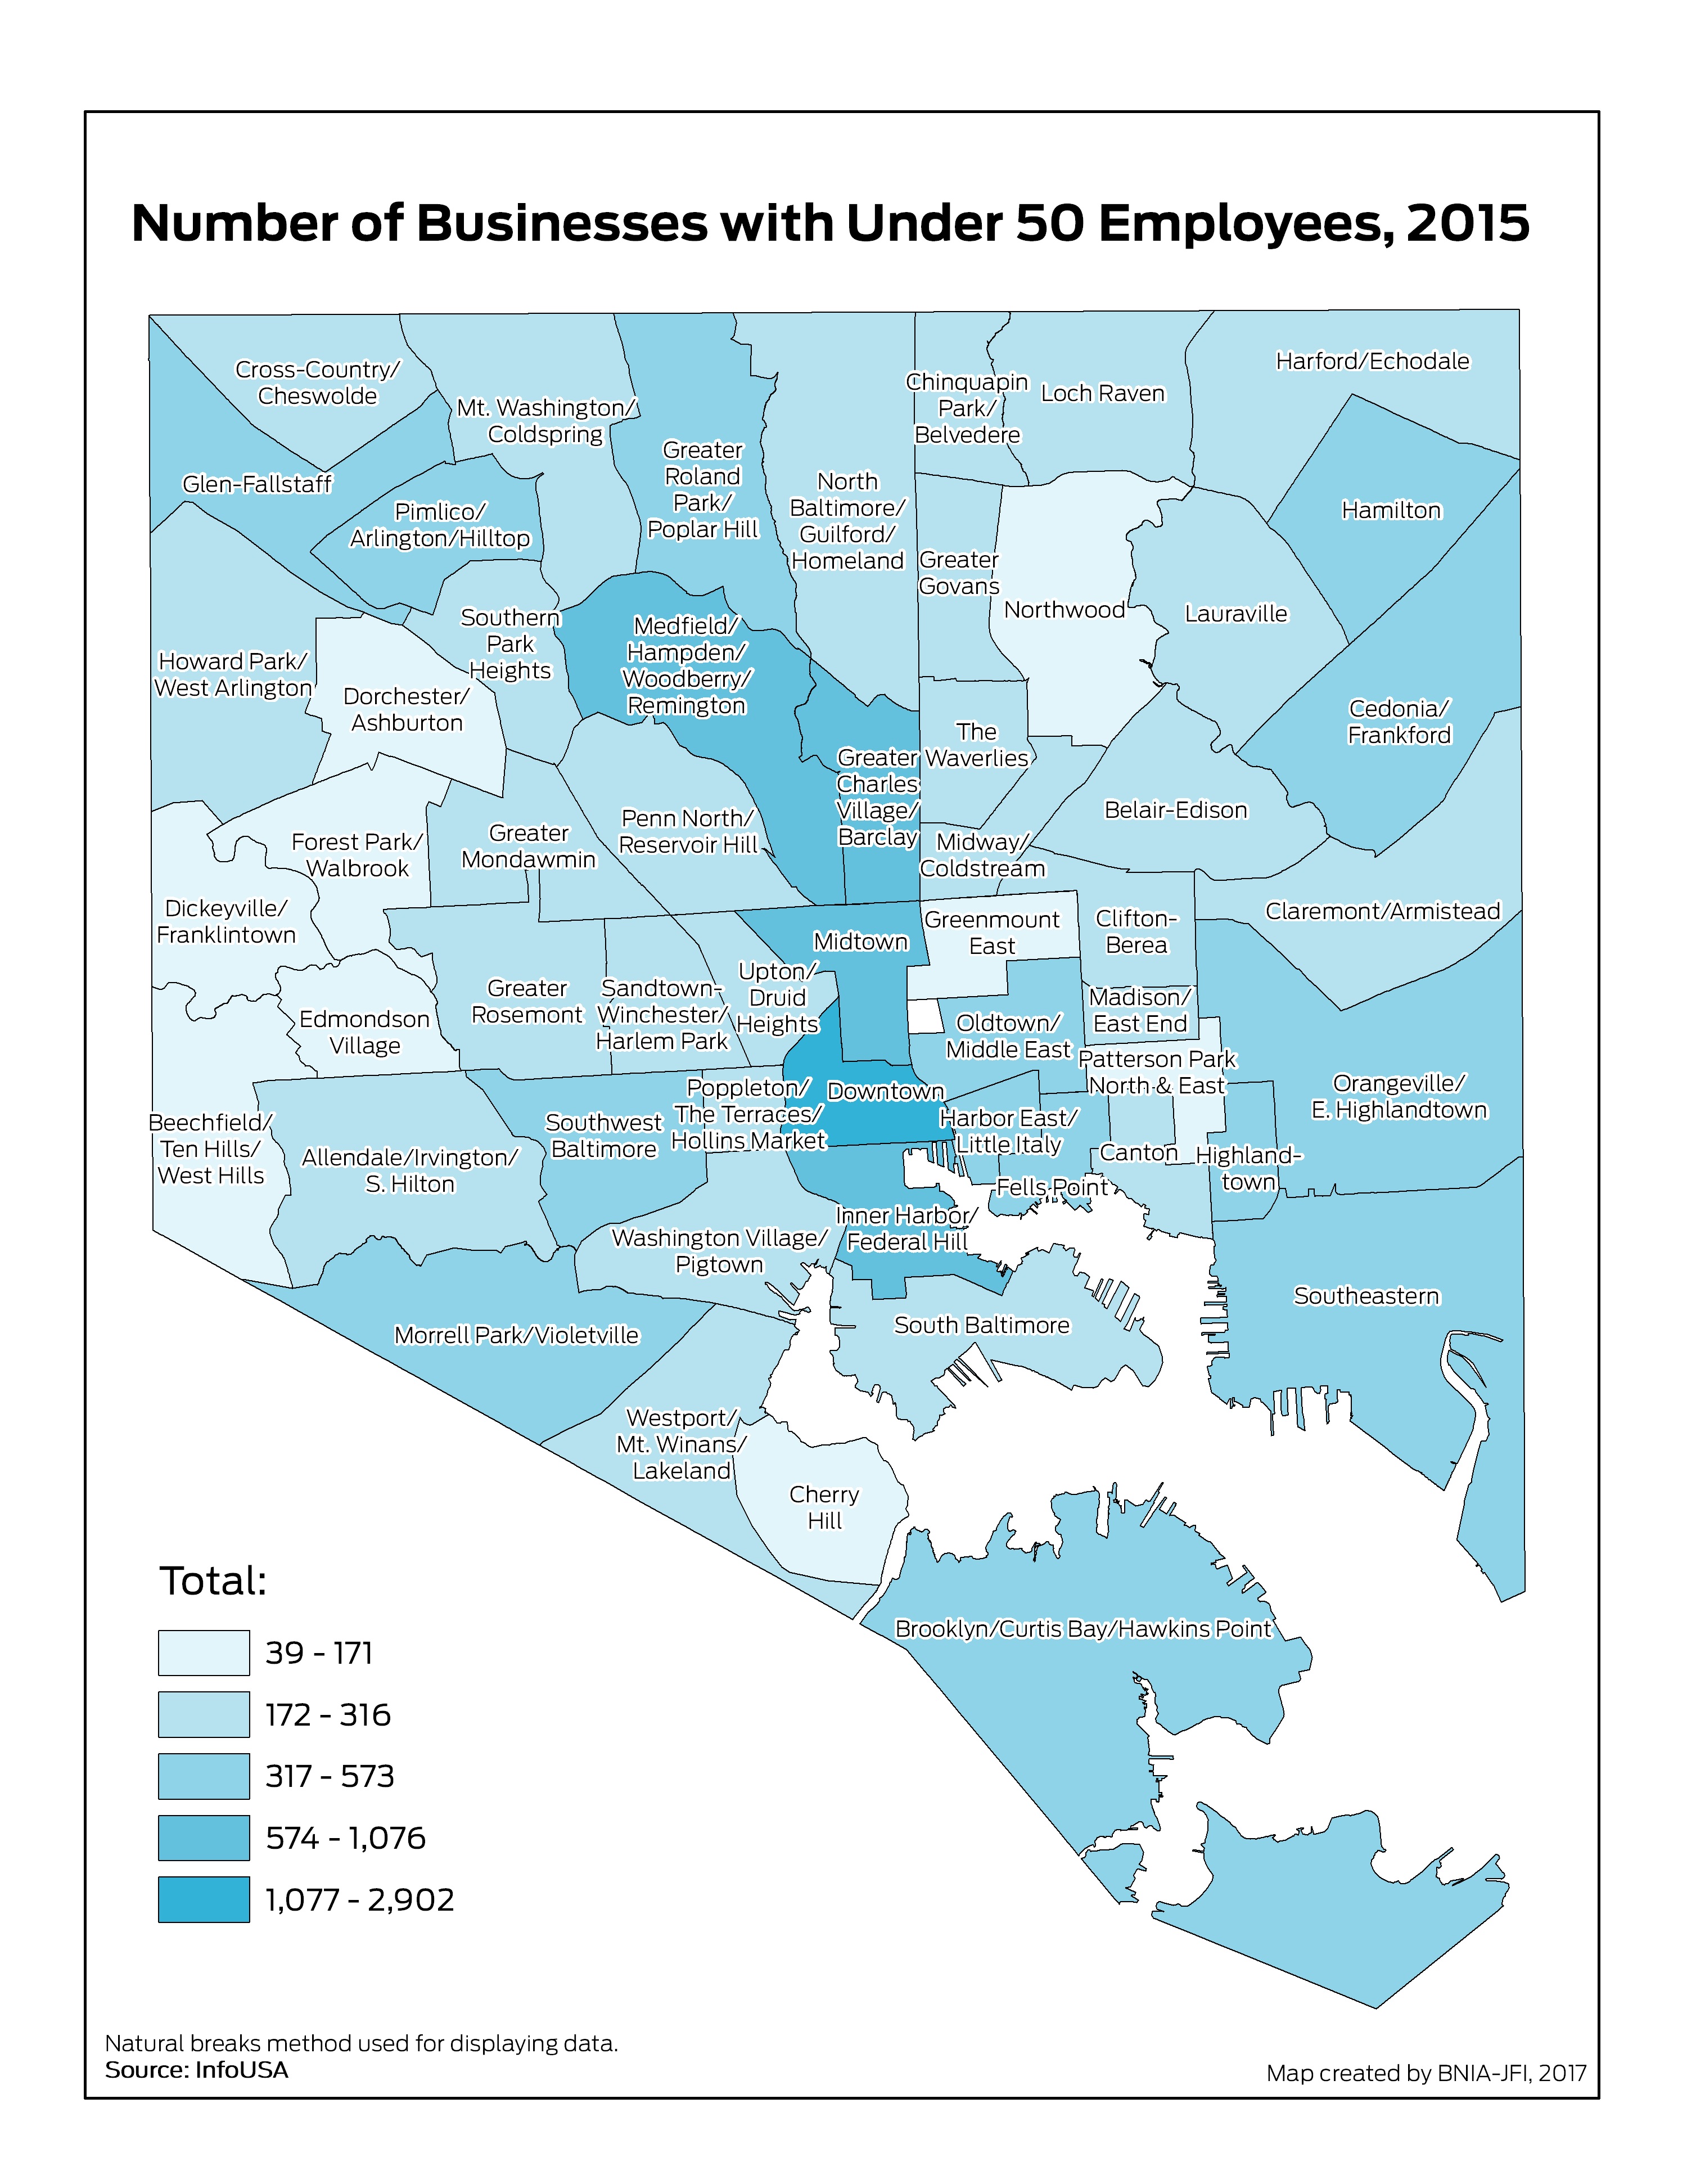
Number of Businesses with Under 50 Employees
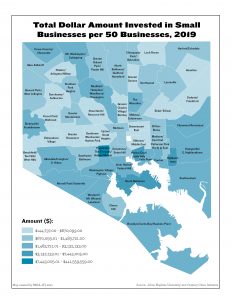
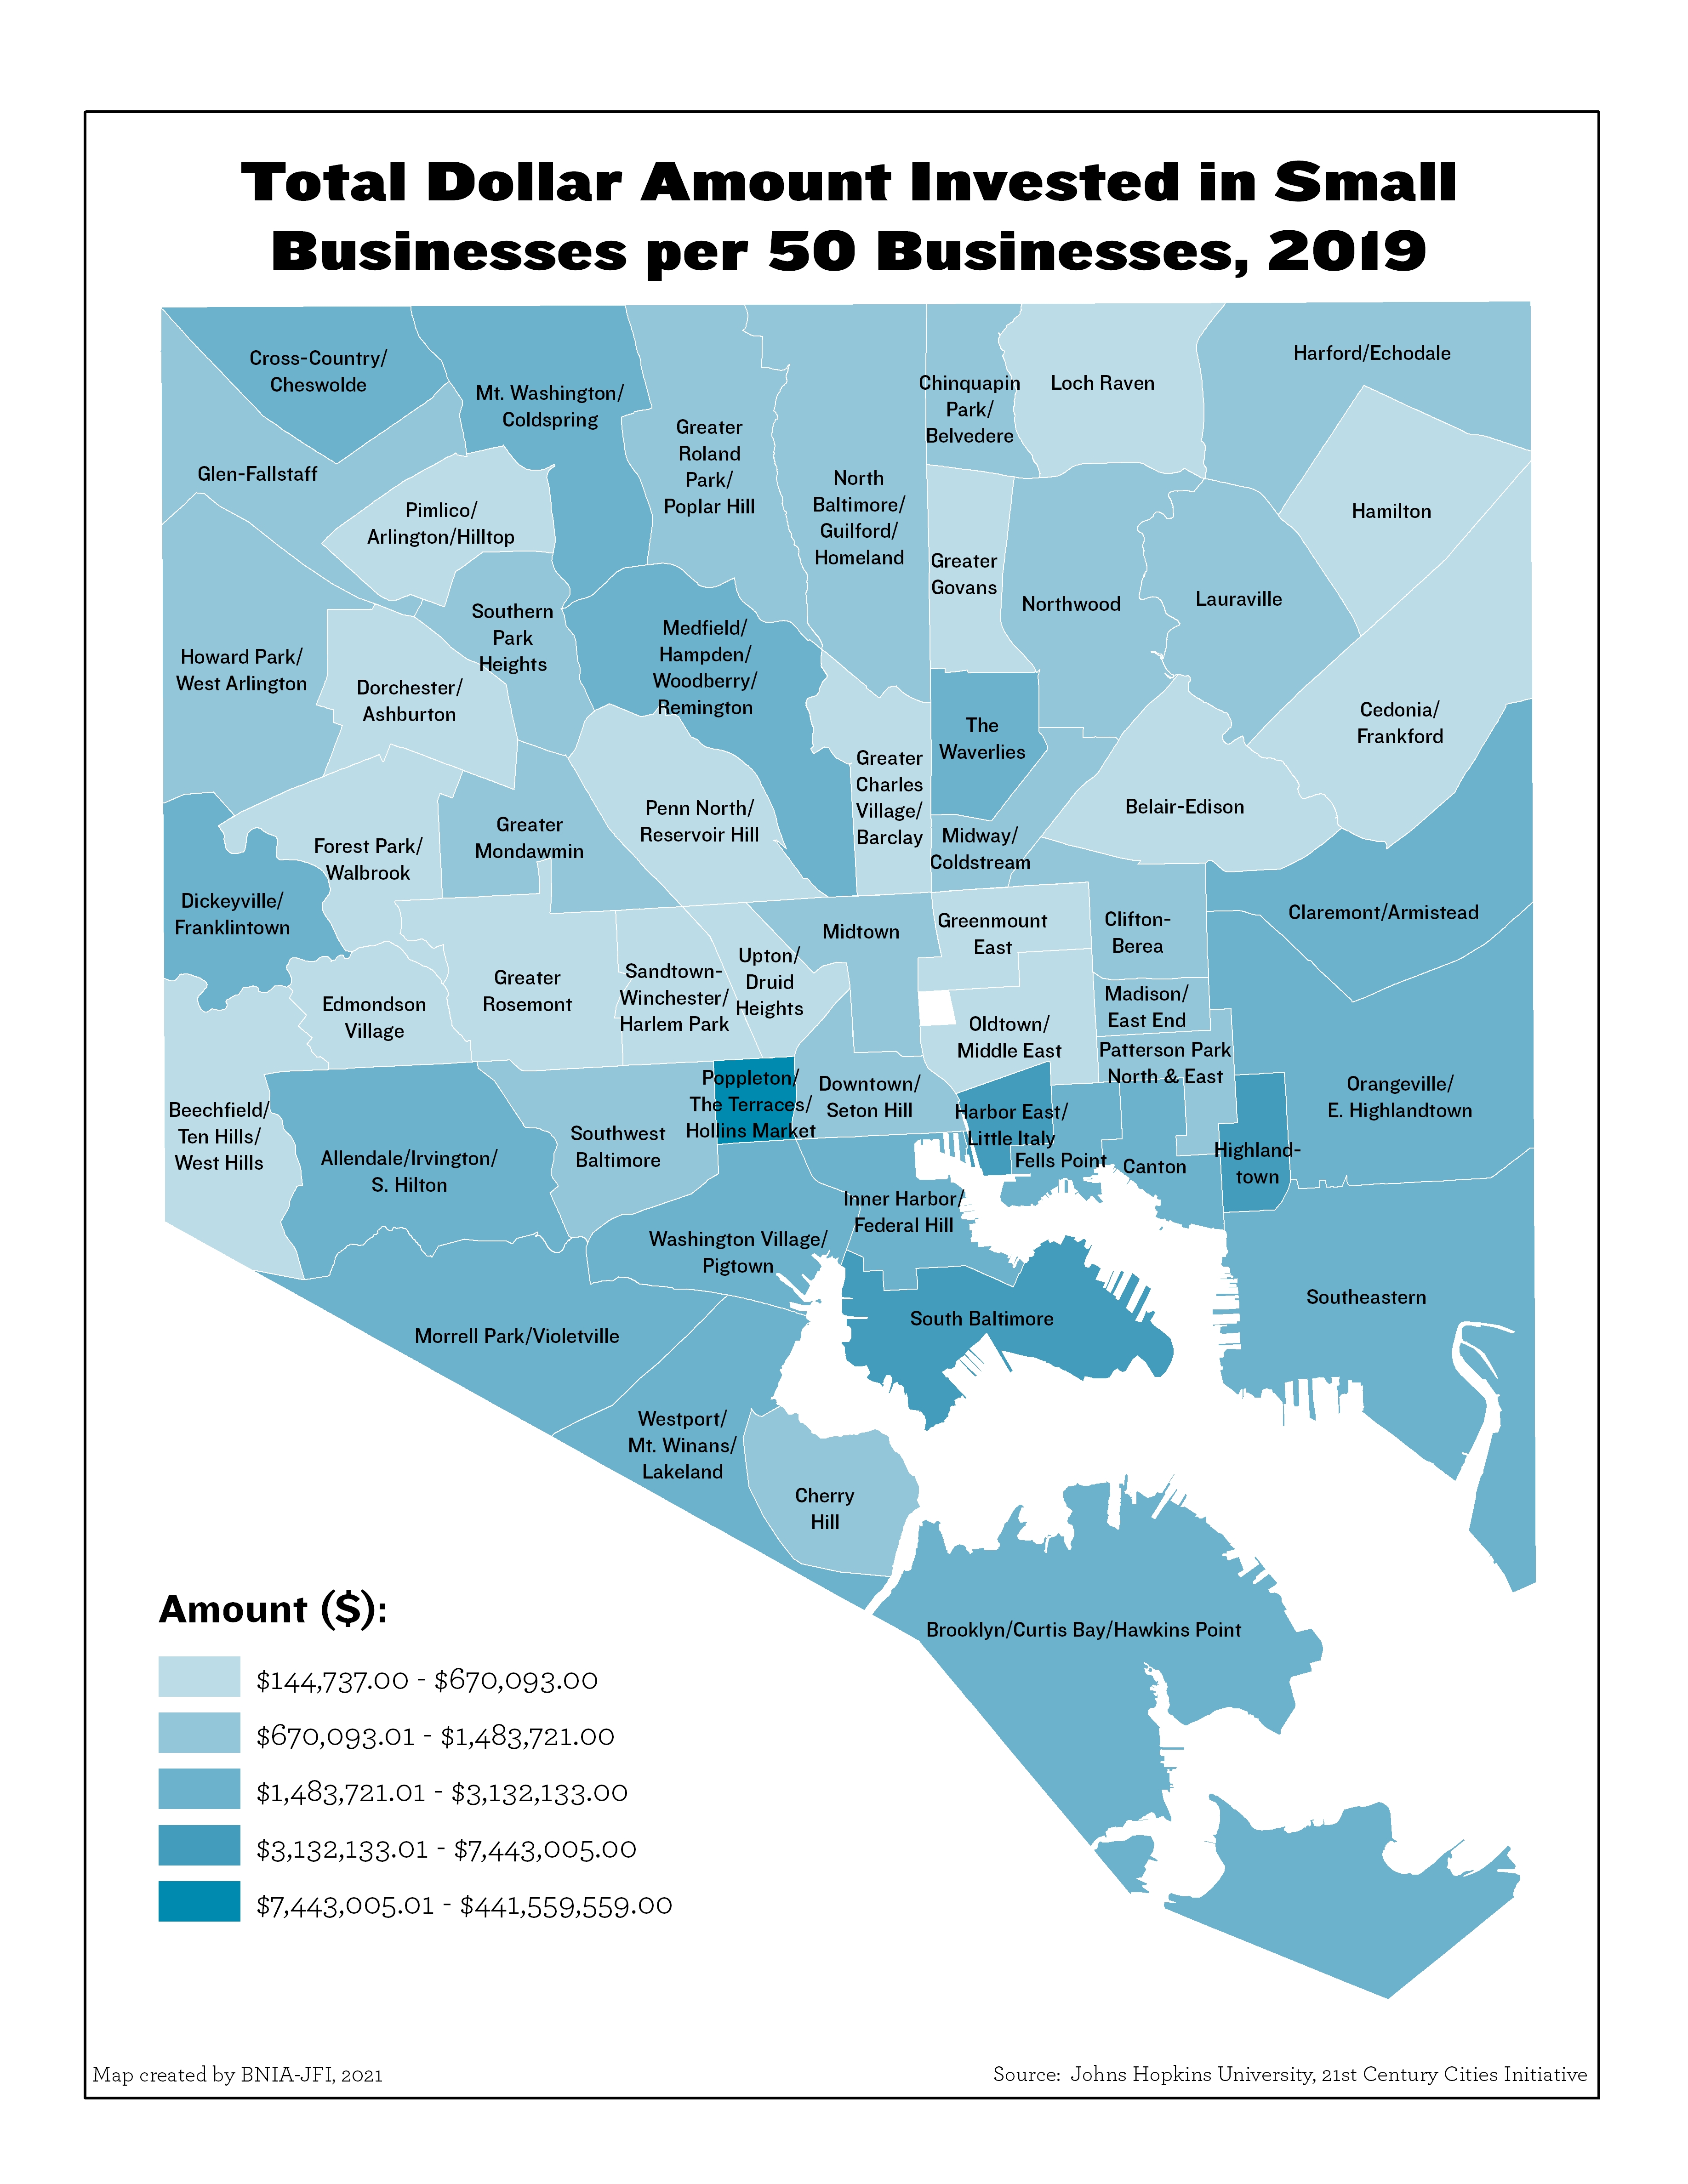
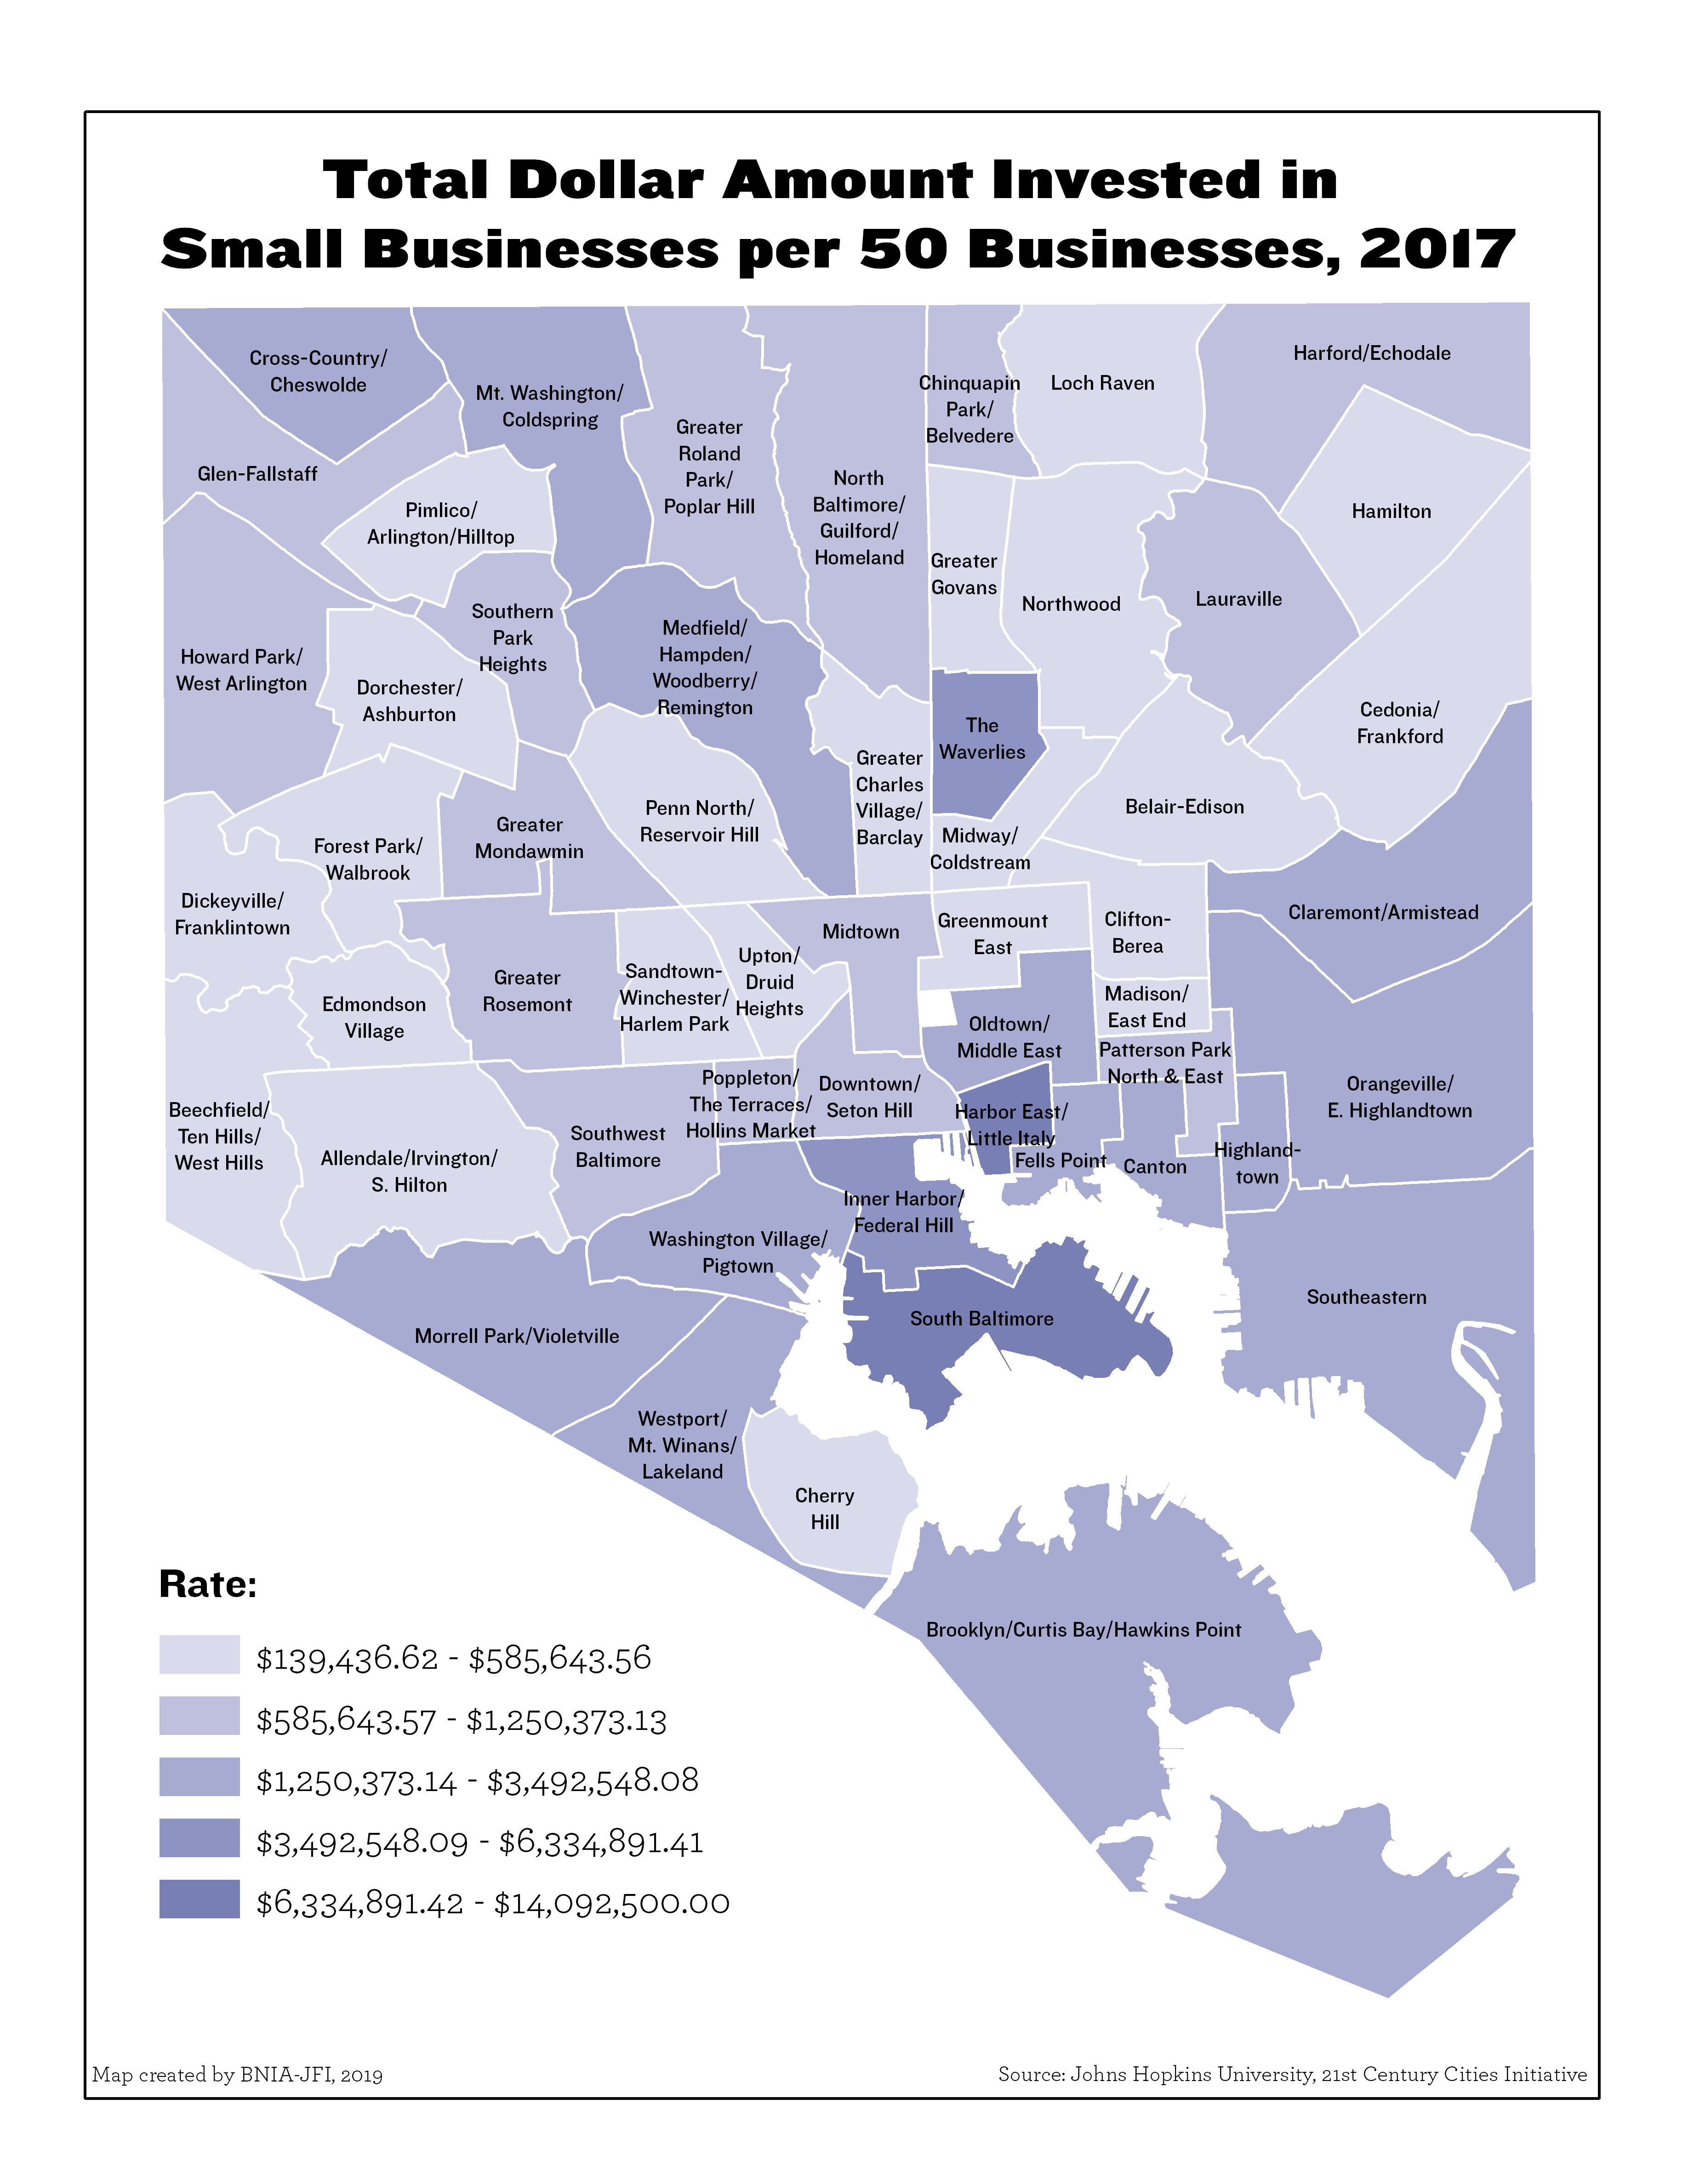
Total Dollar Amount Invested in Small Businesses per 50 Businesses

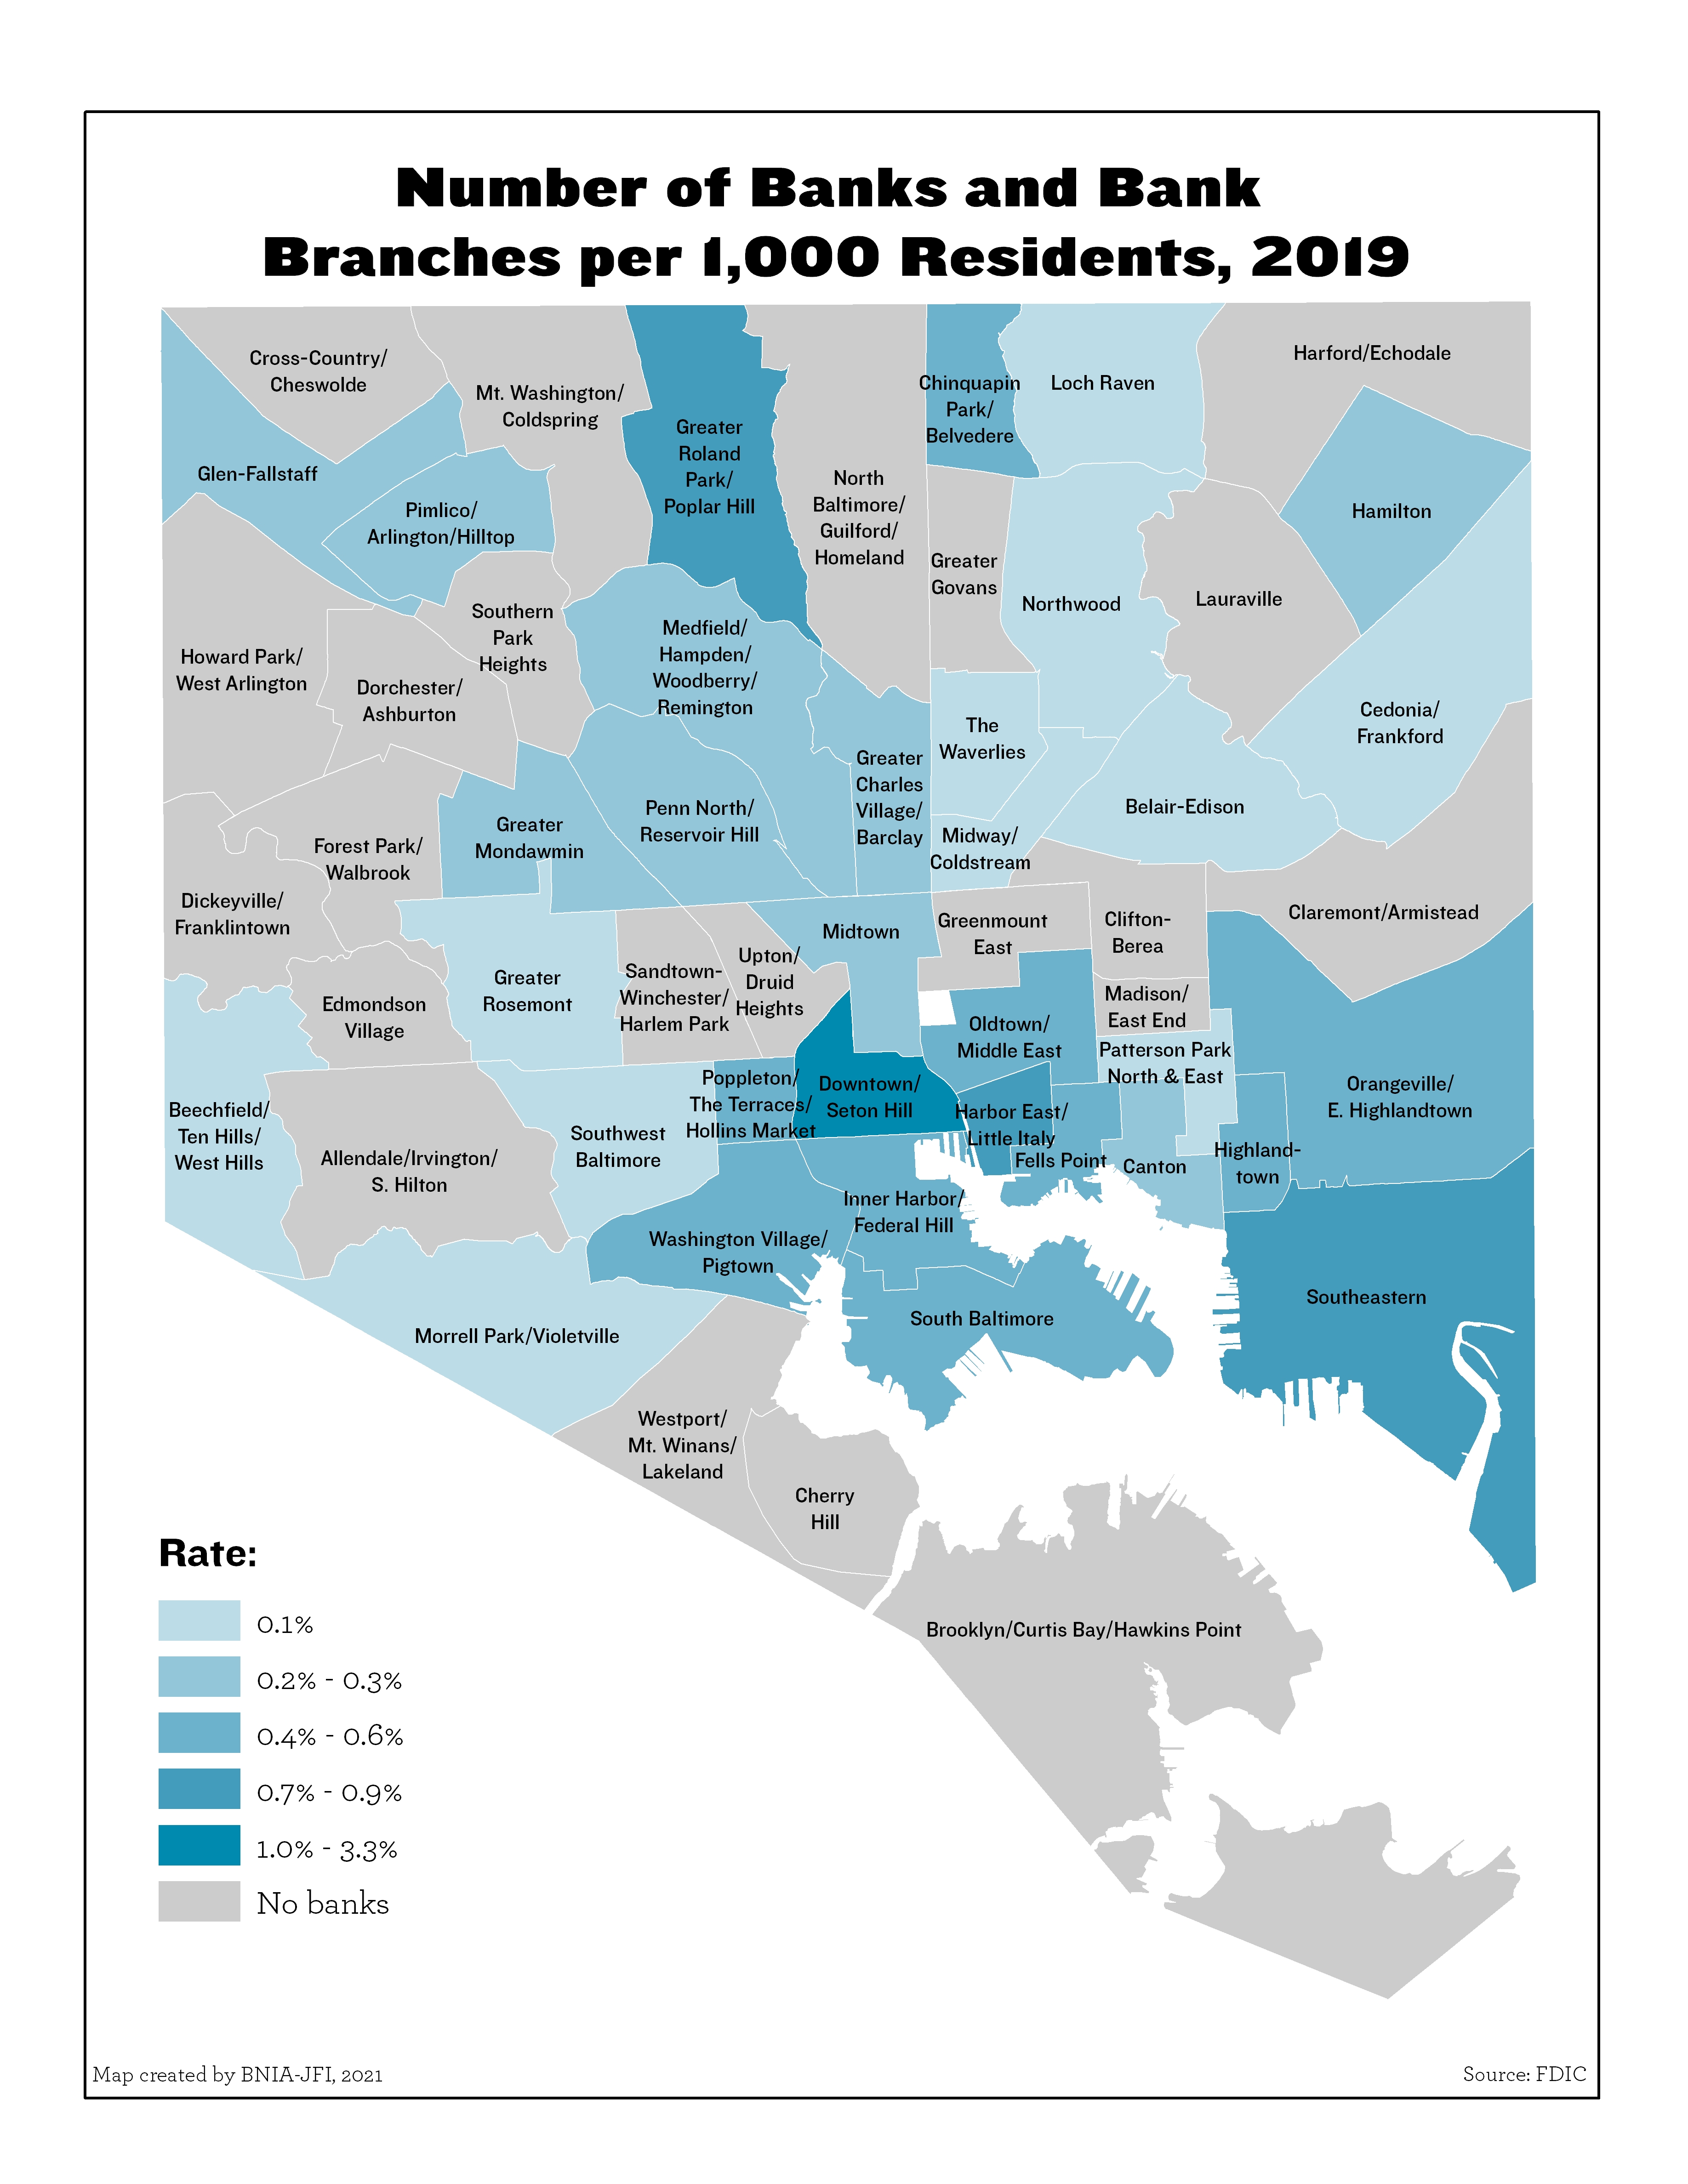
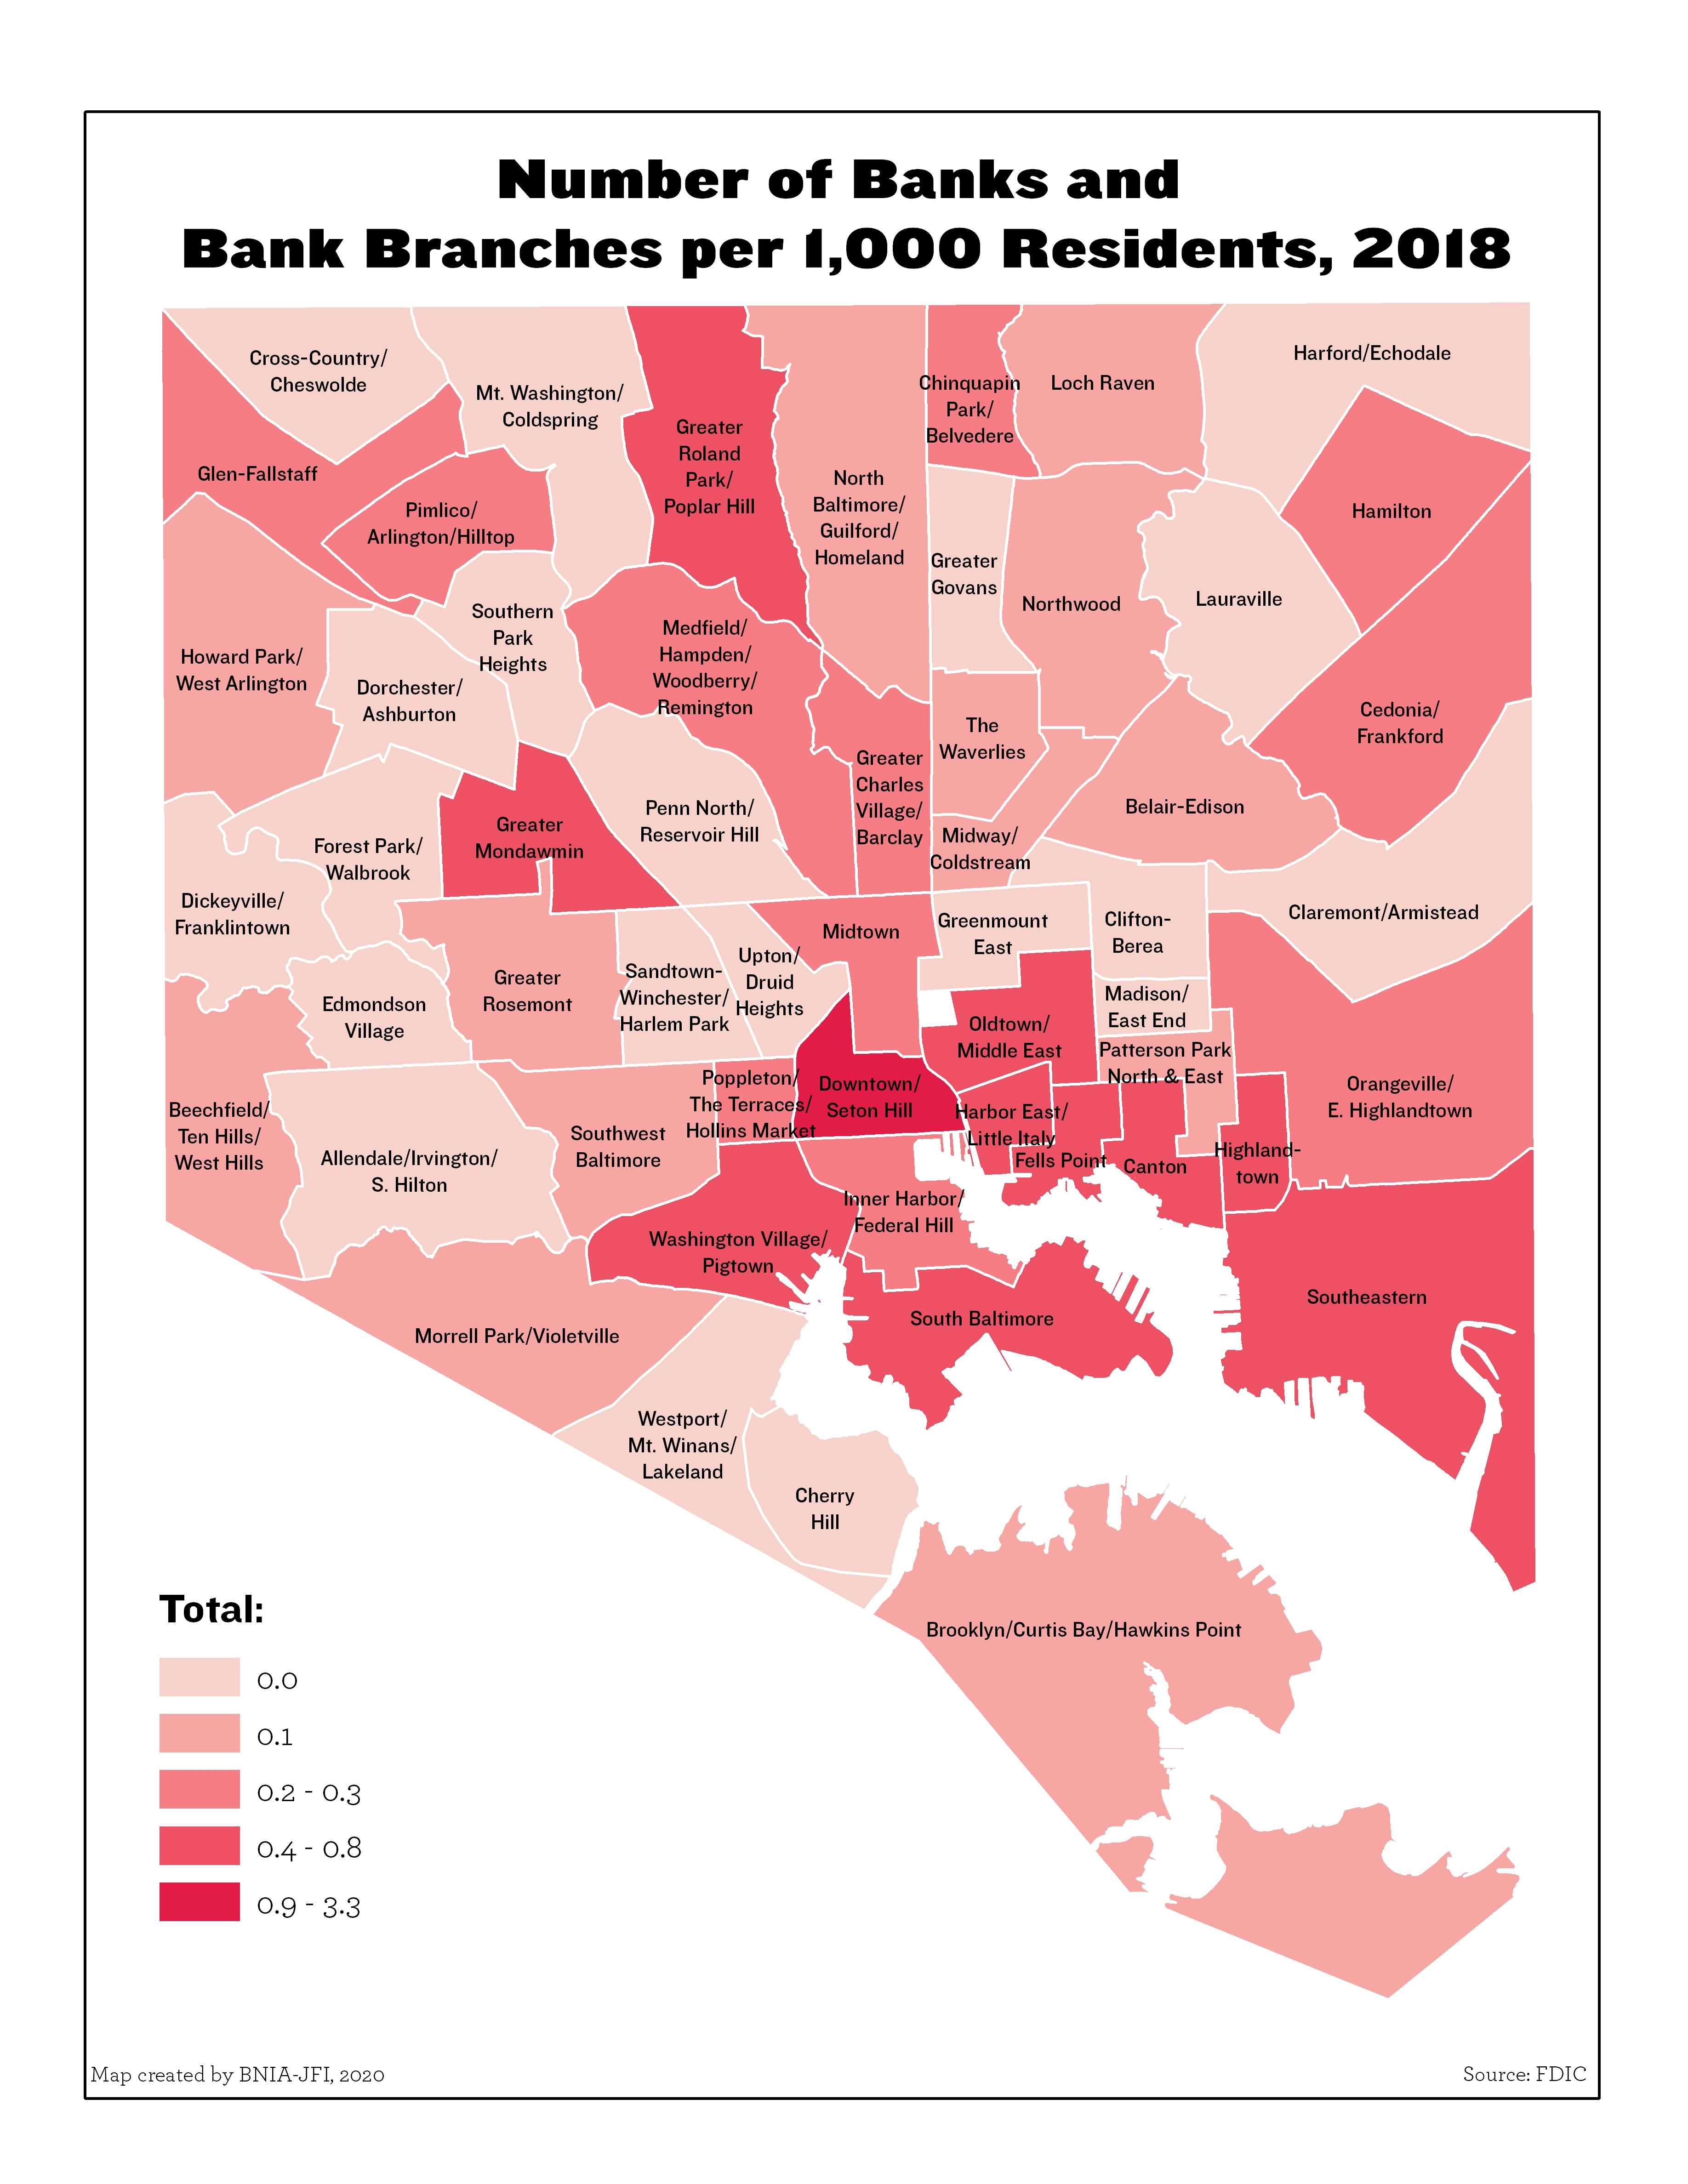
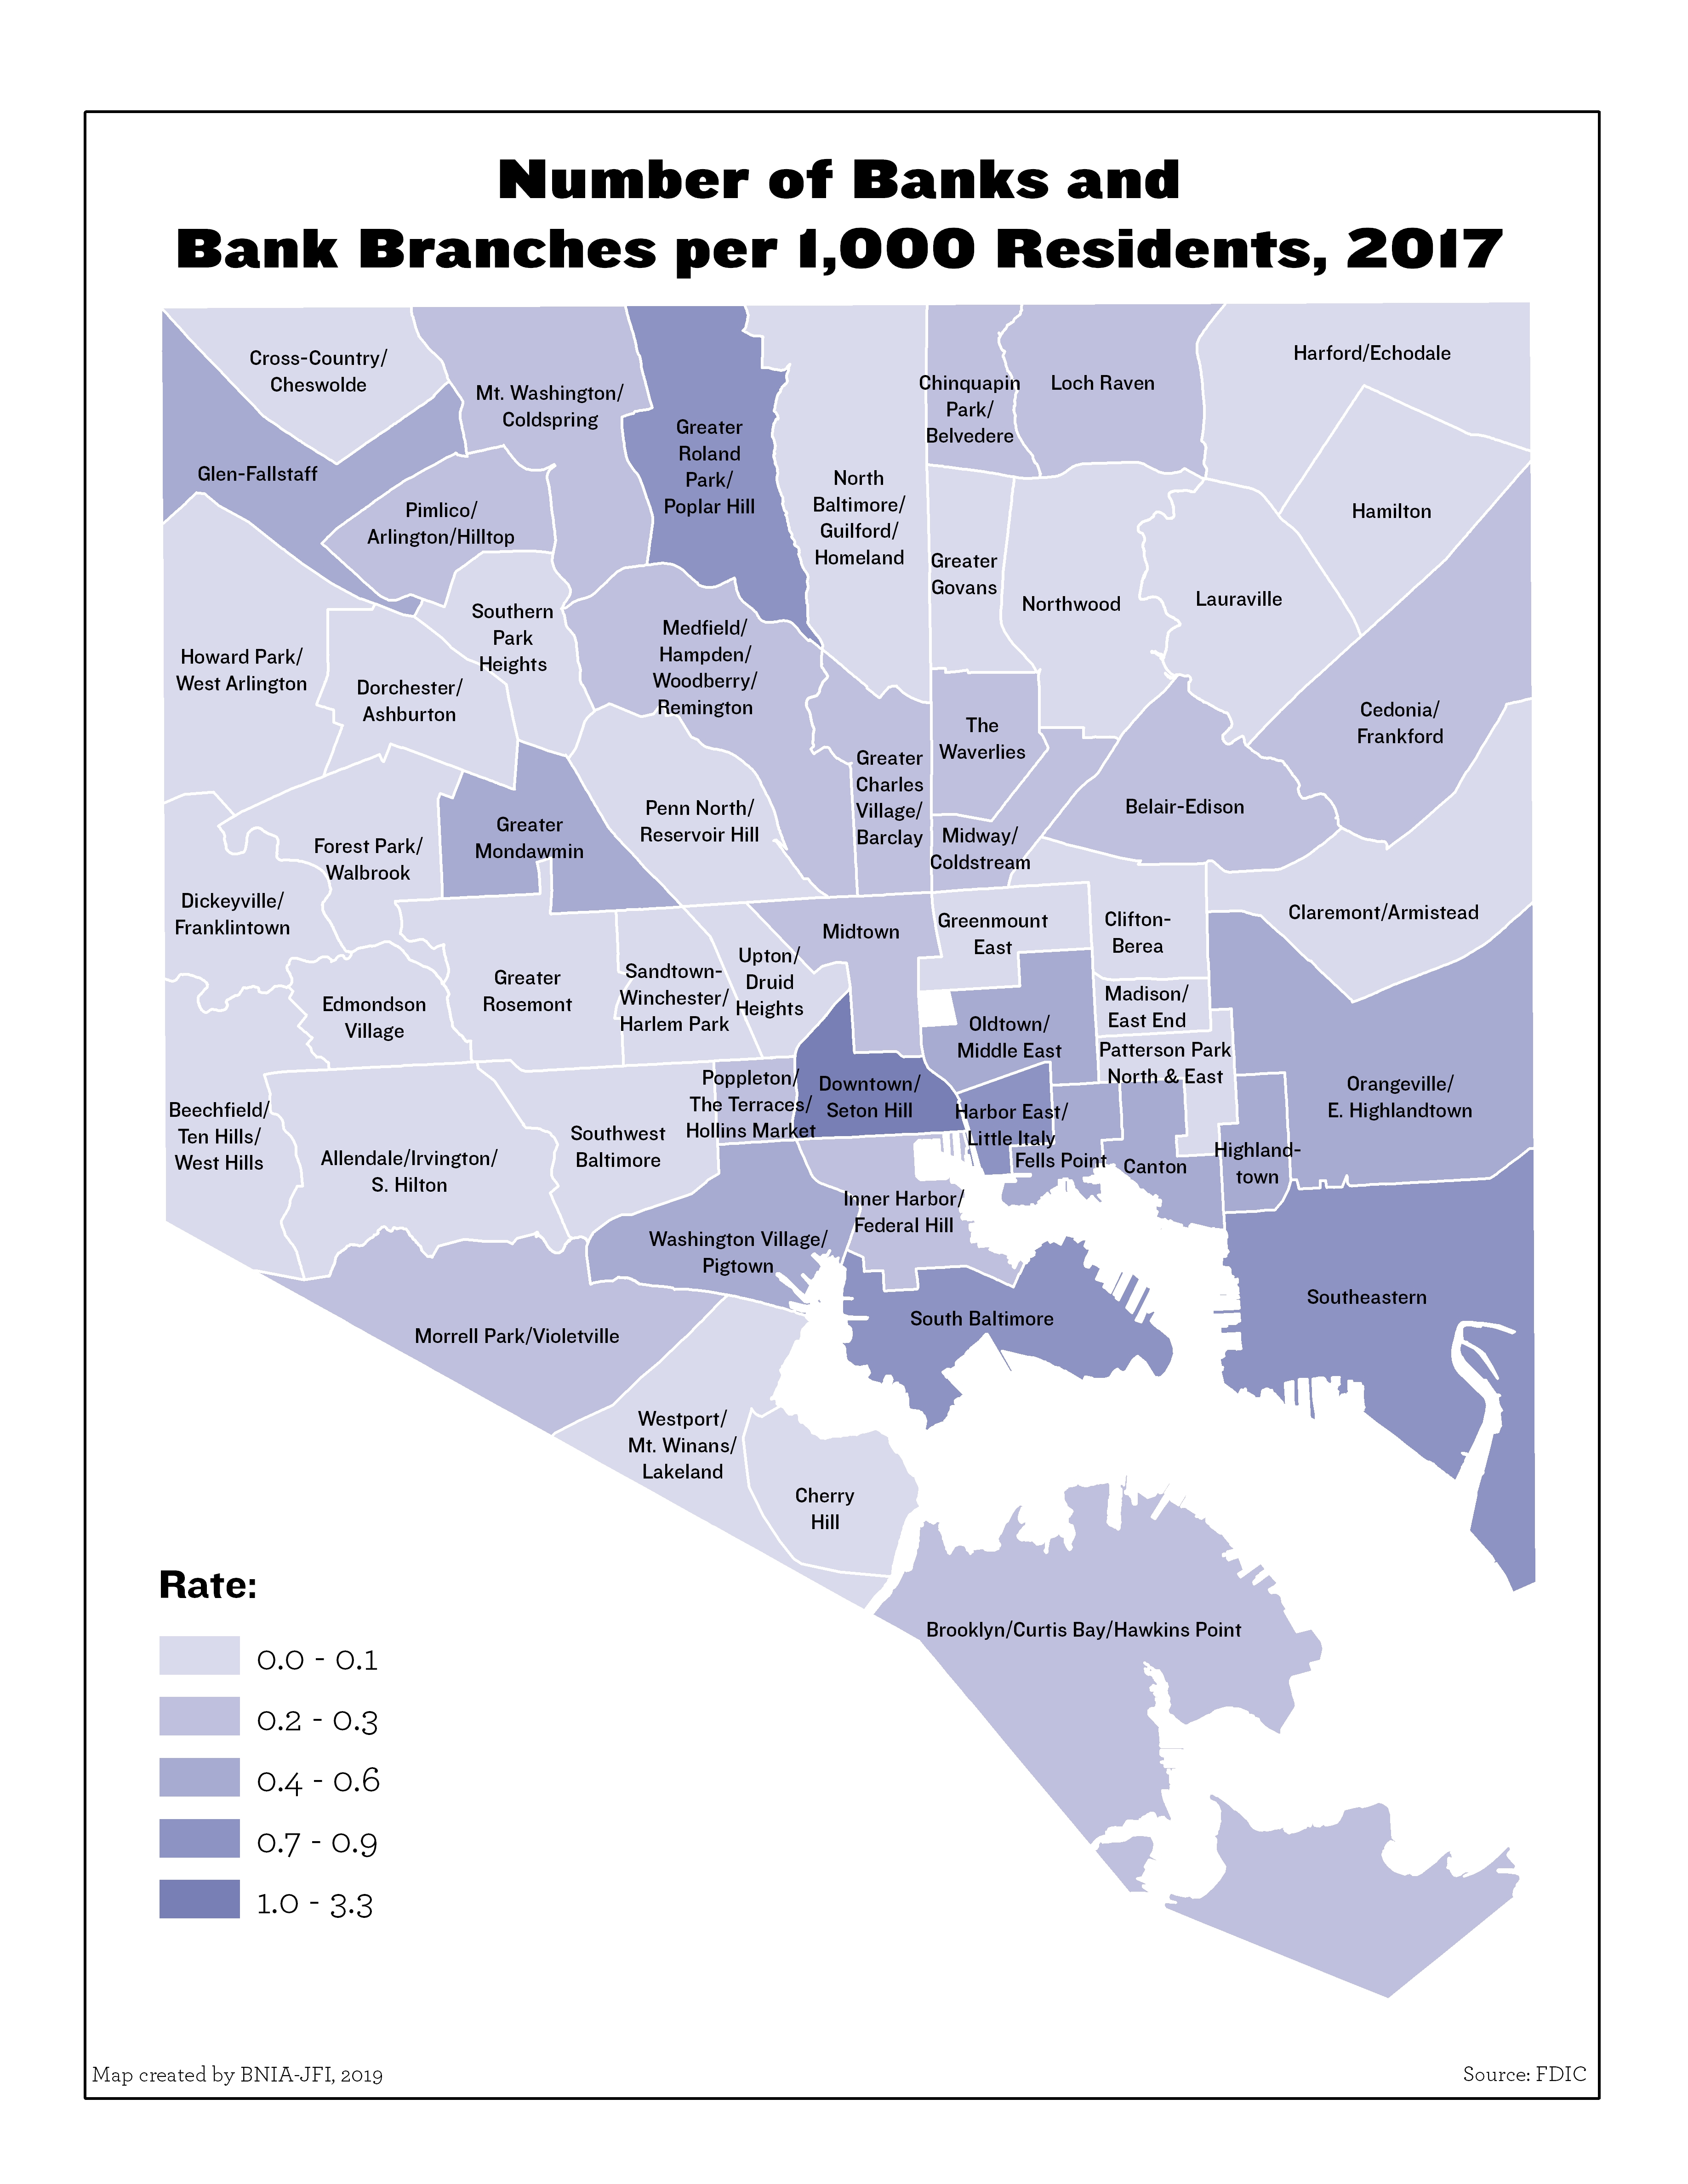
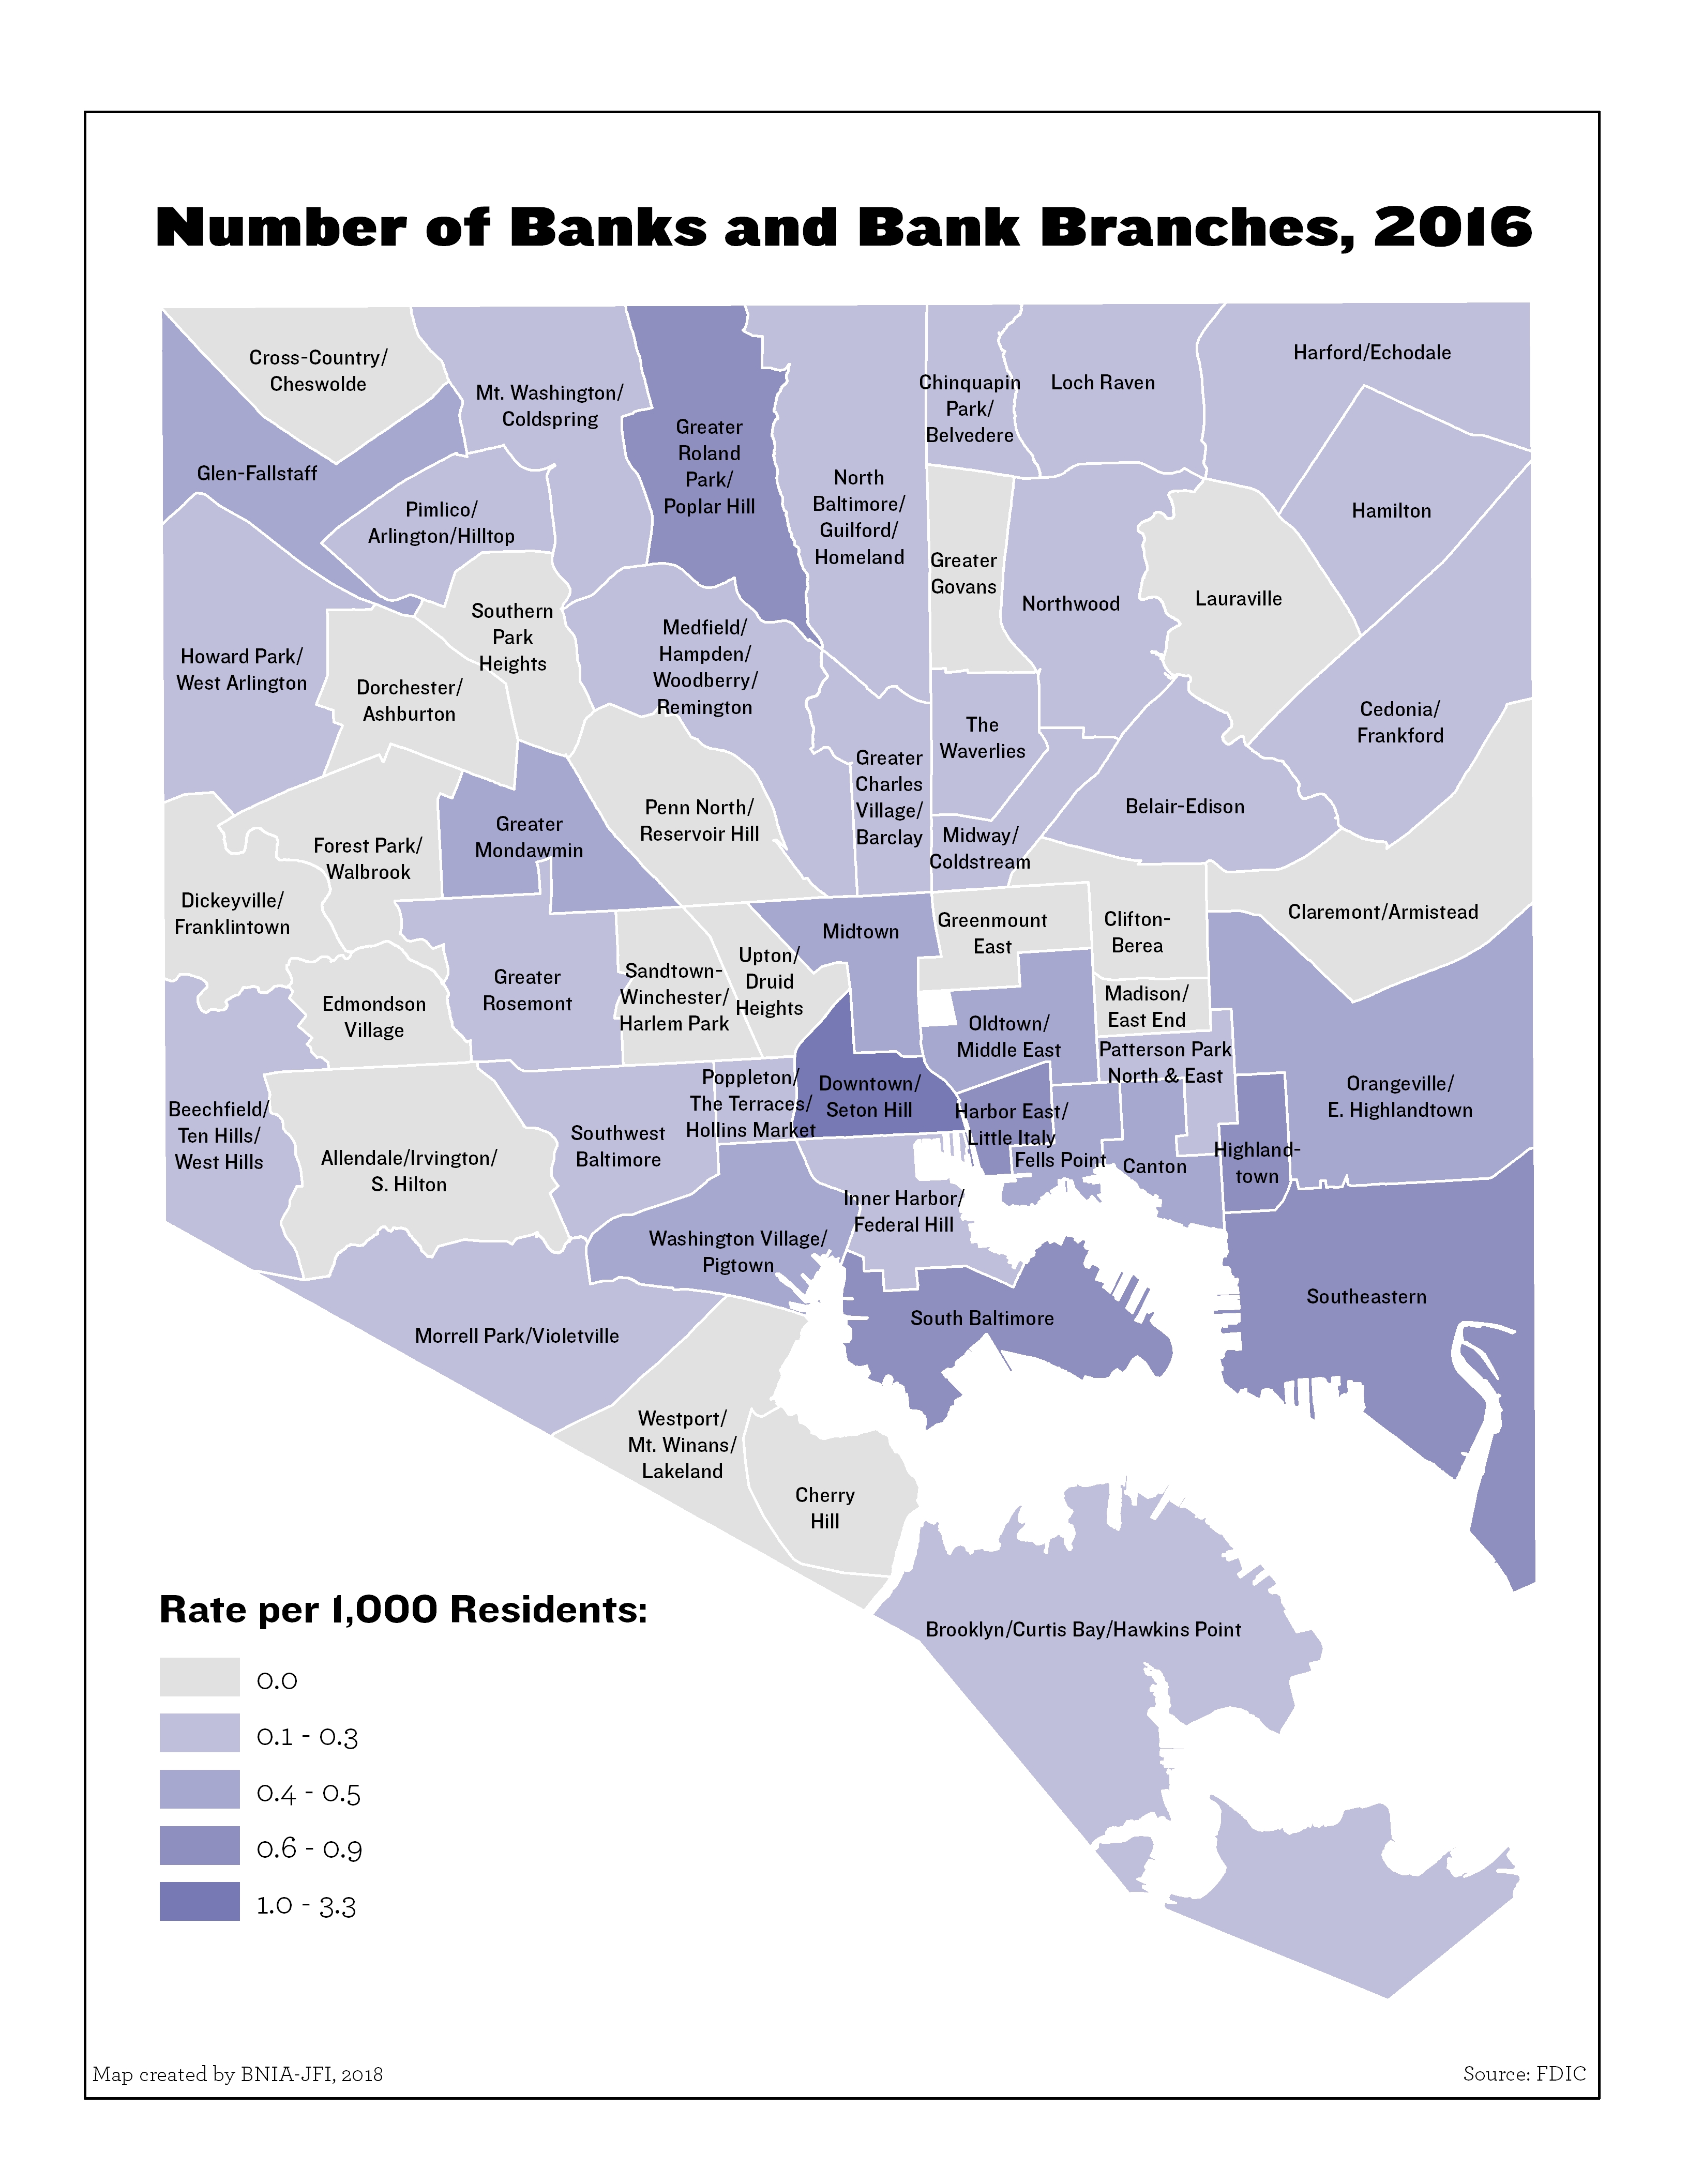
Number of Banks and Bank Branches per 1,000 Residents
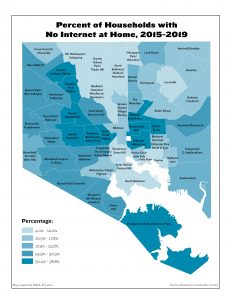
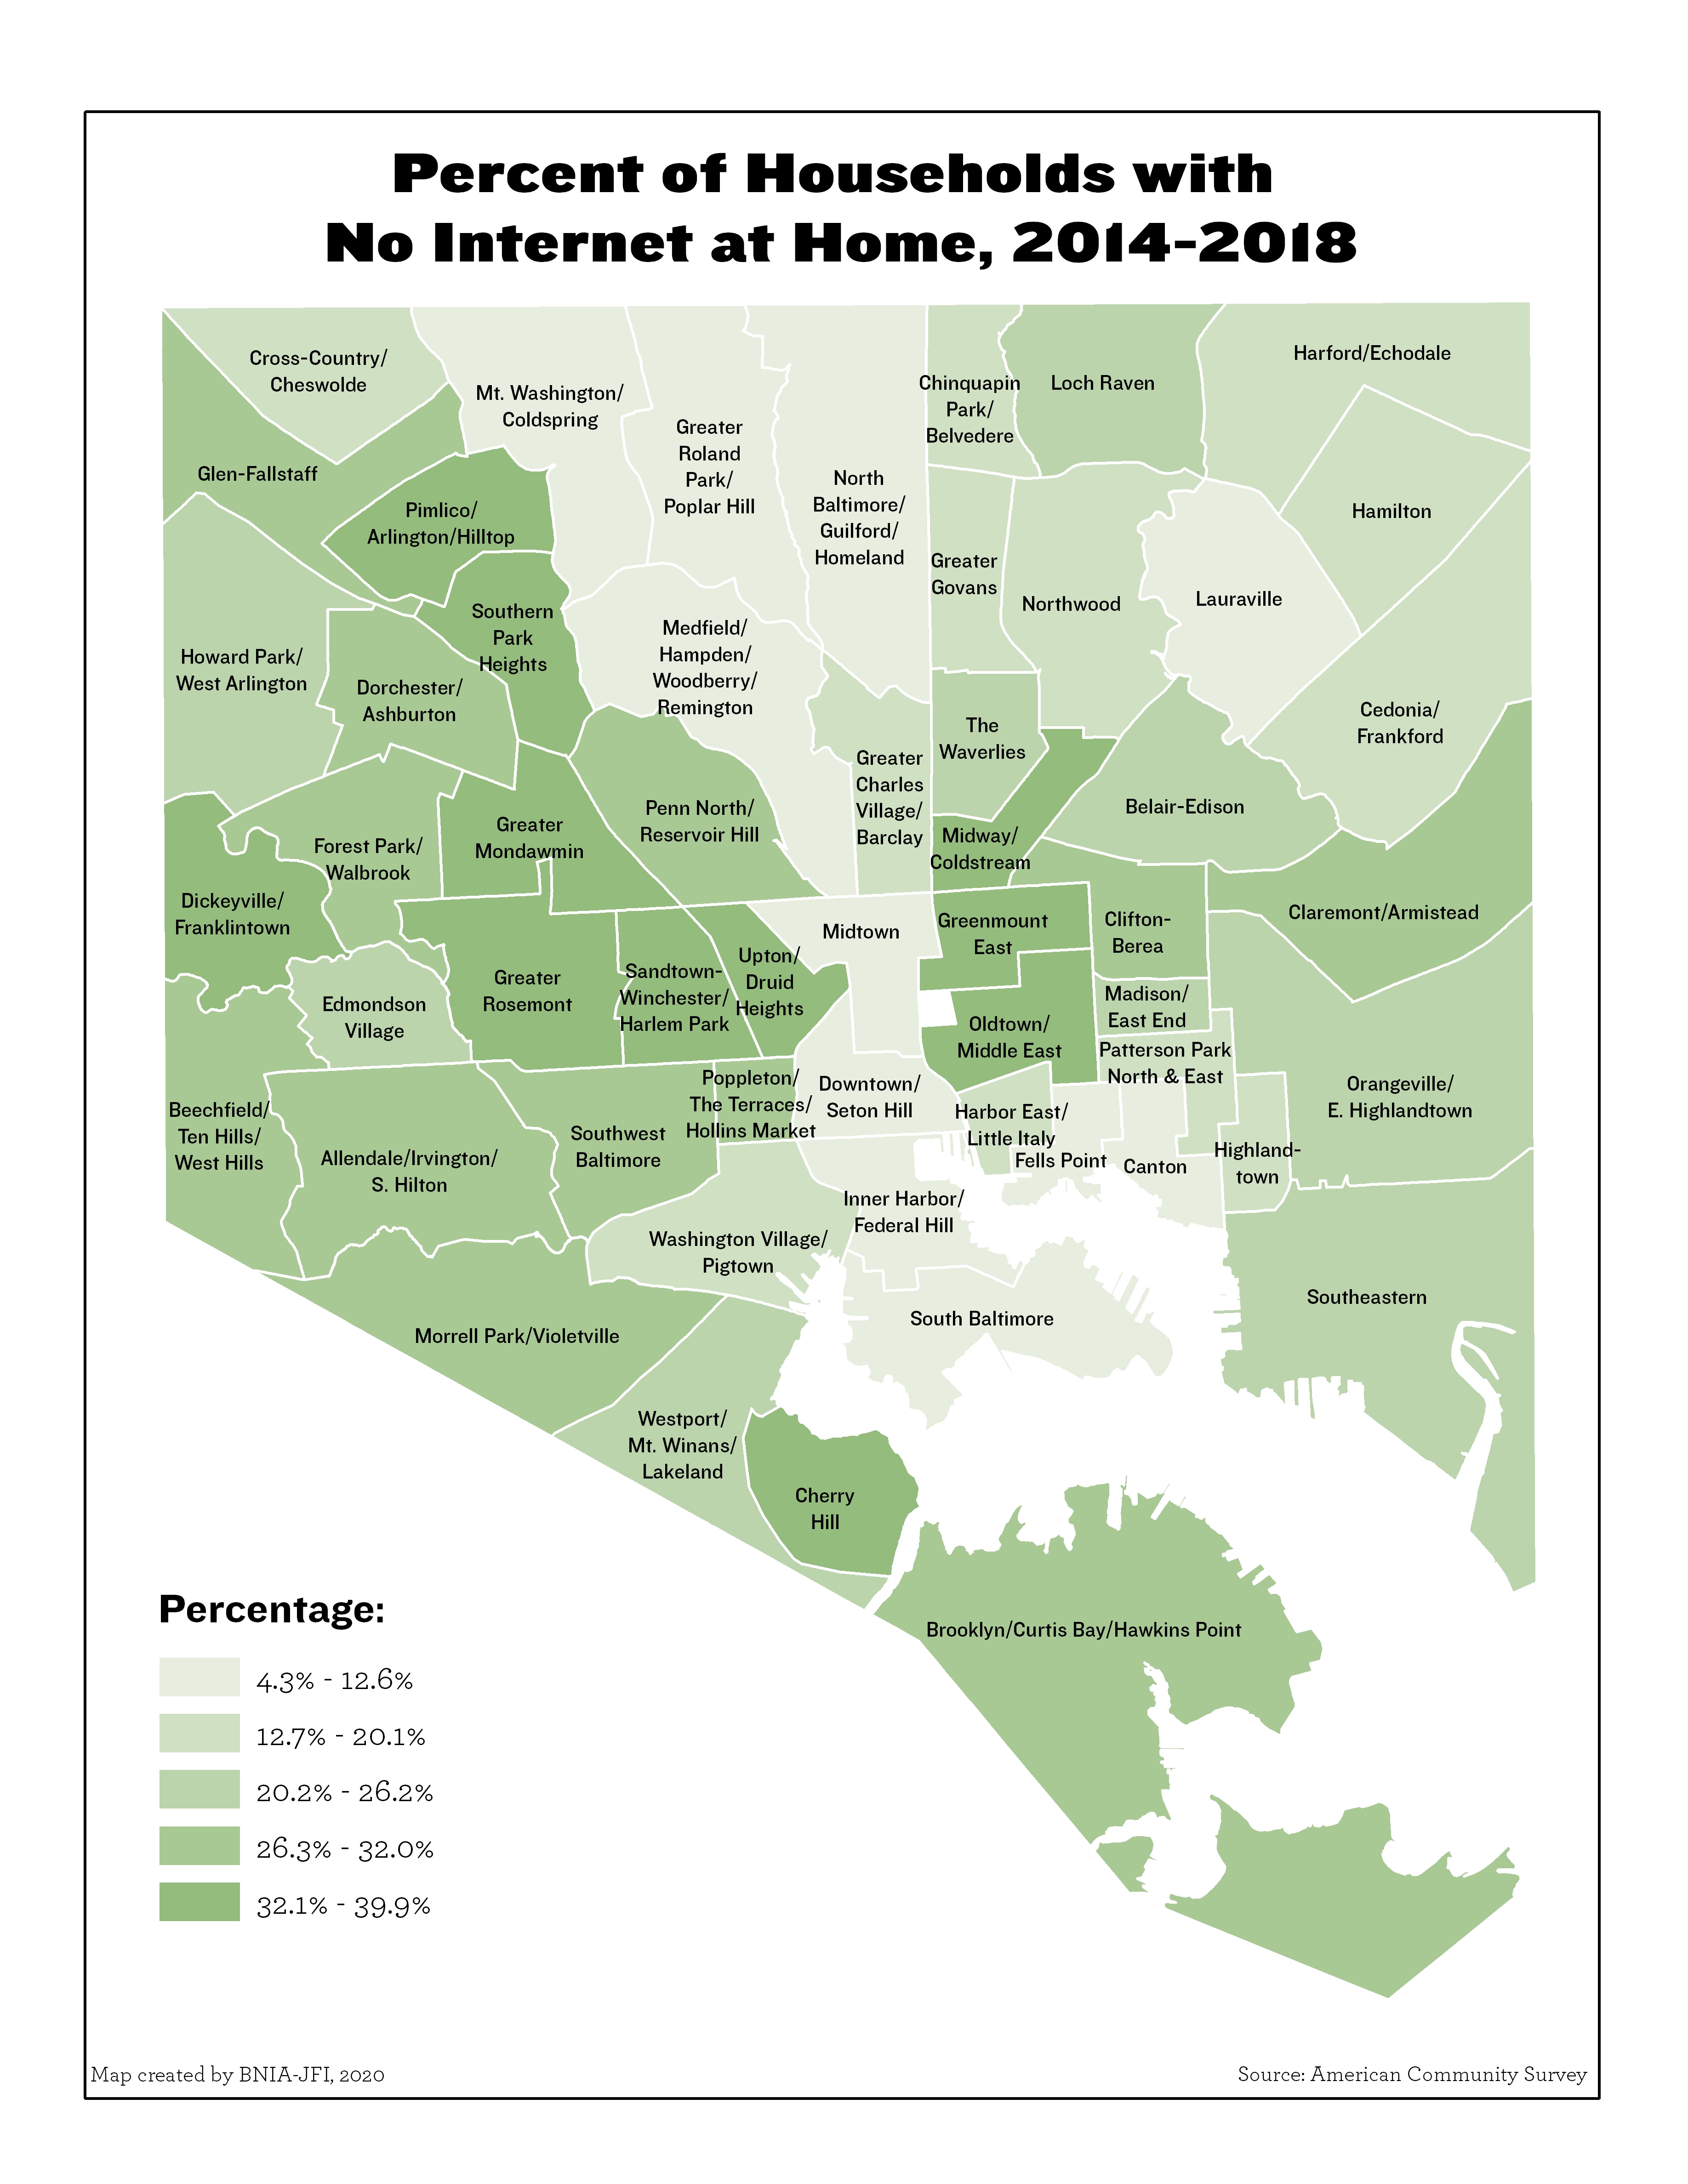
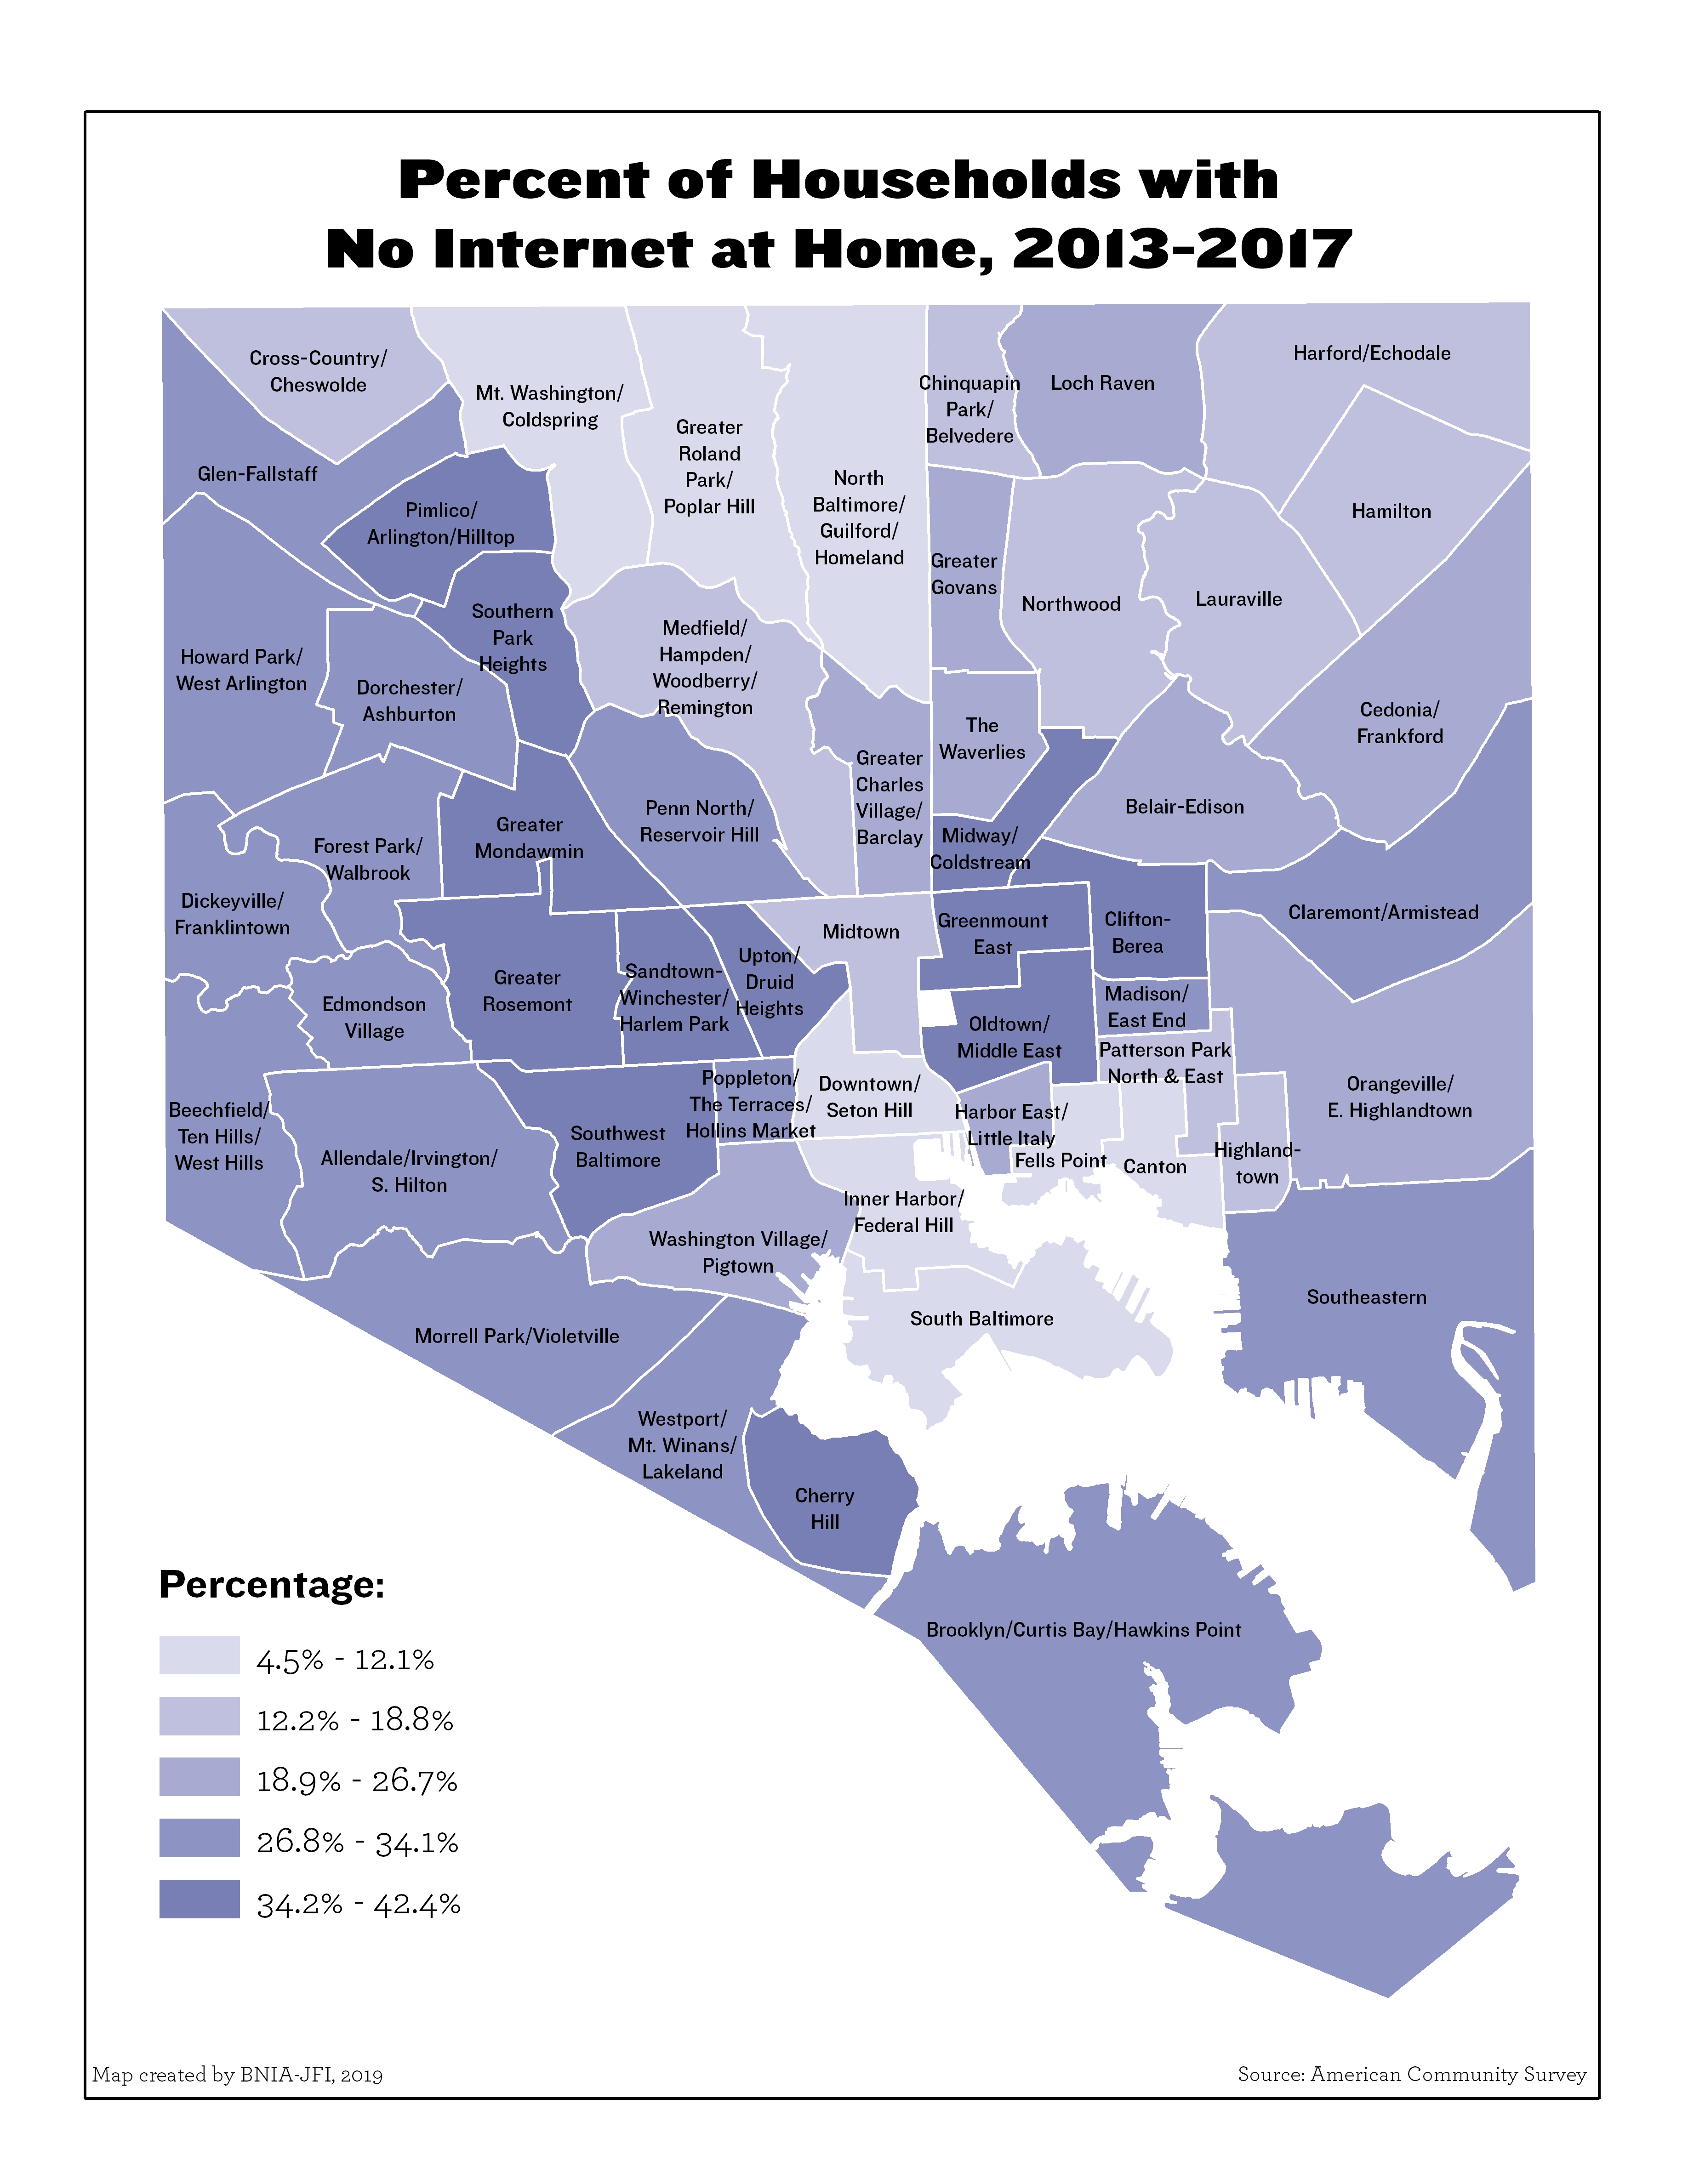
Percent of Households with No Internet at Home
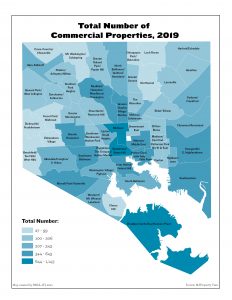
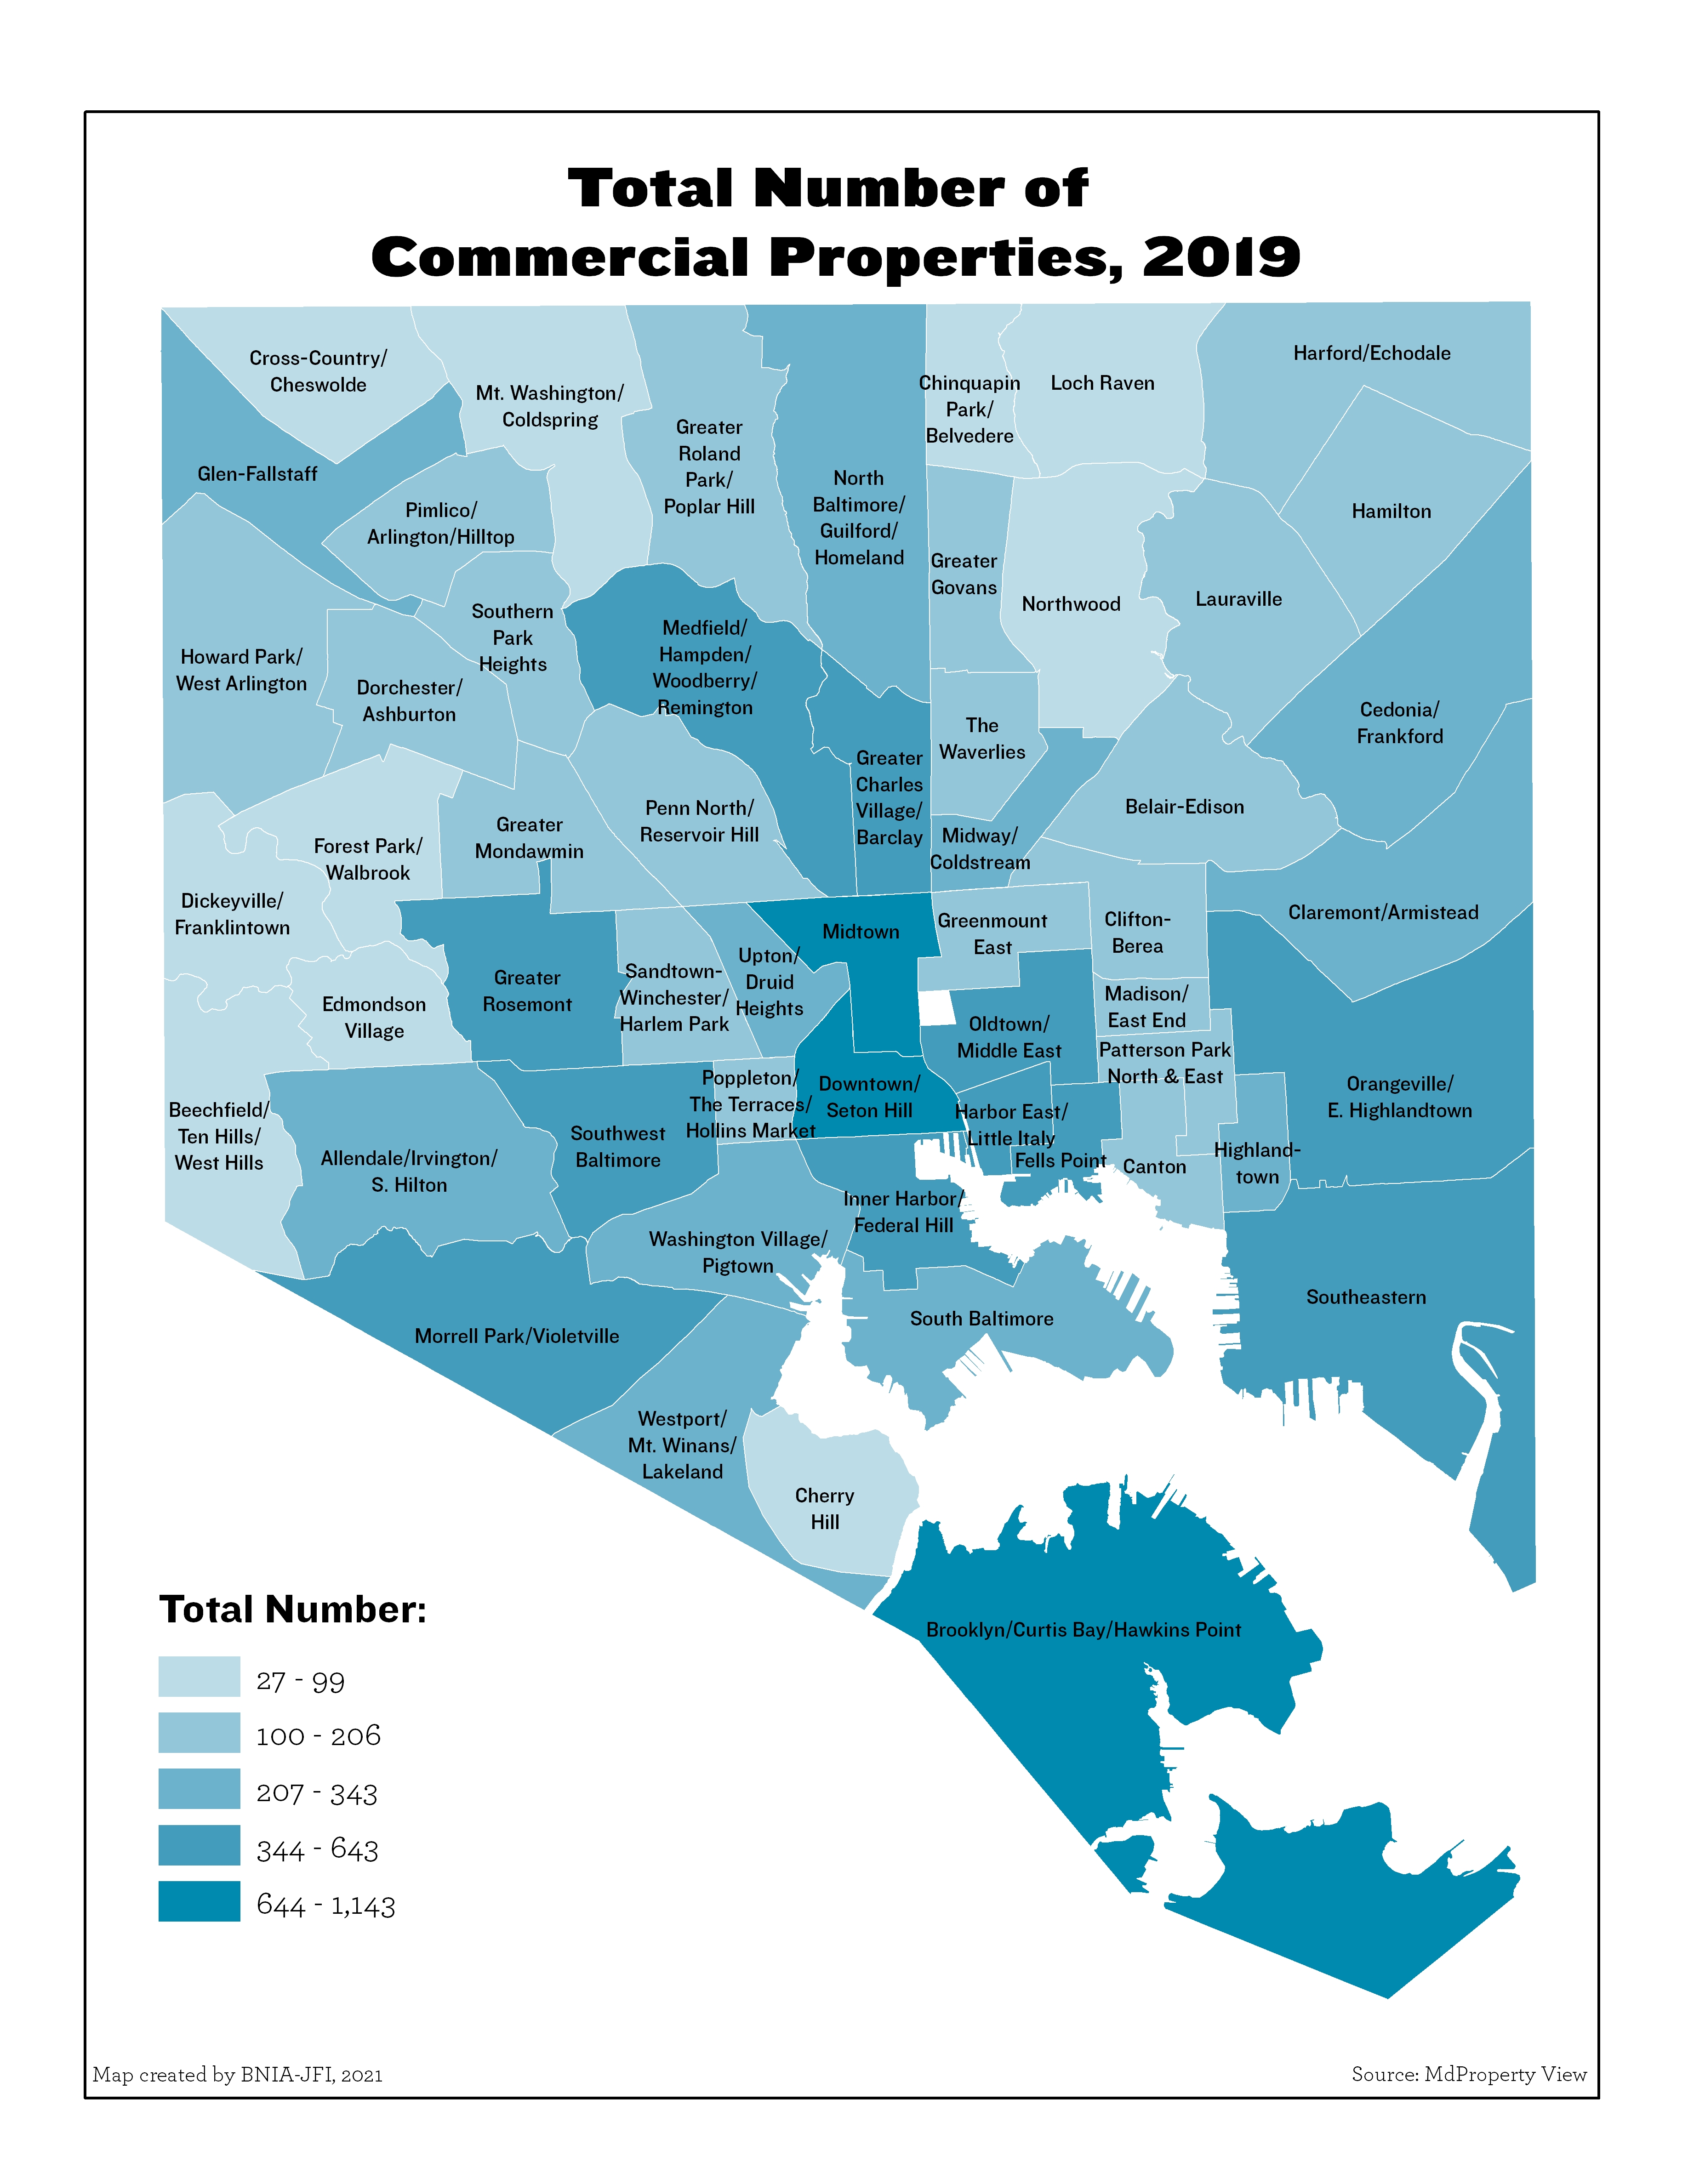
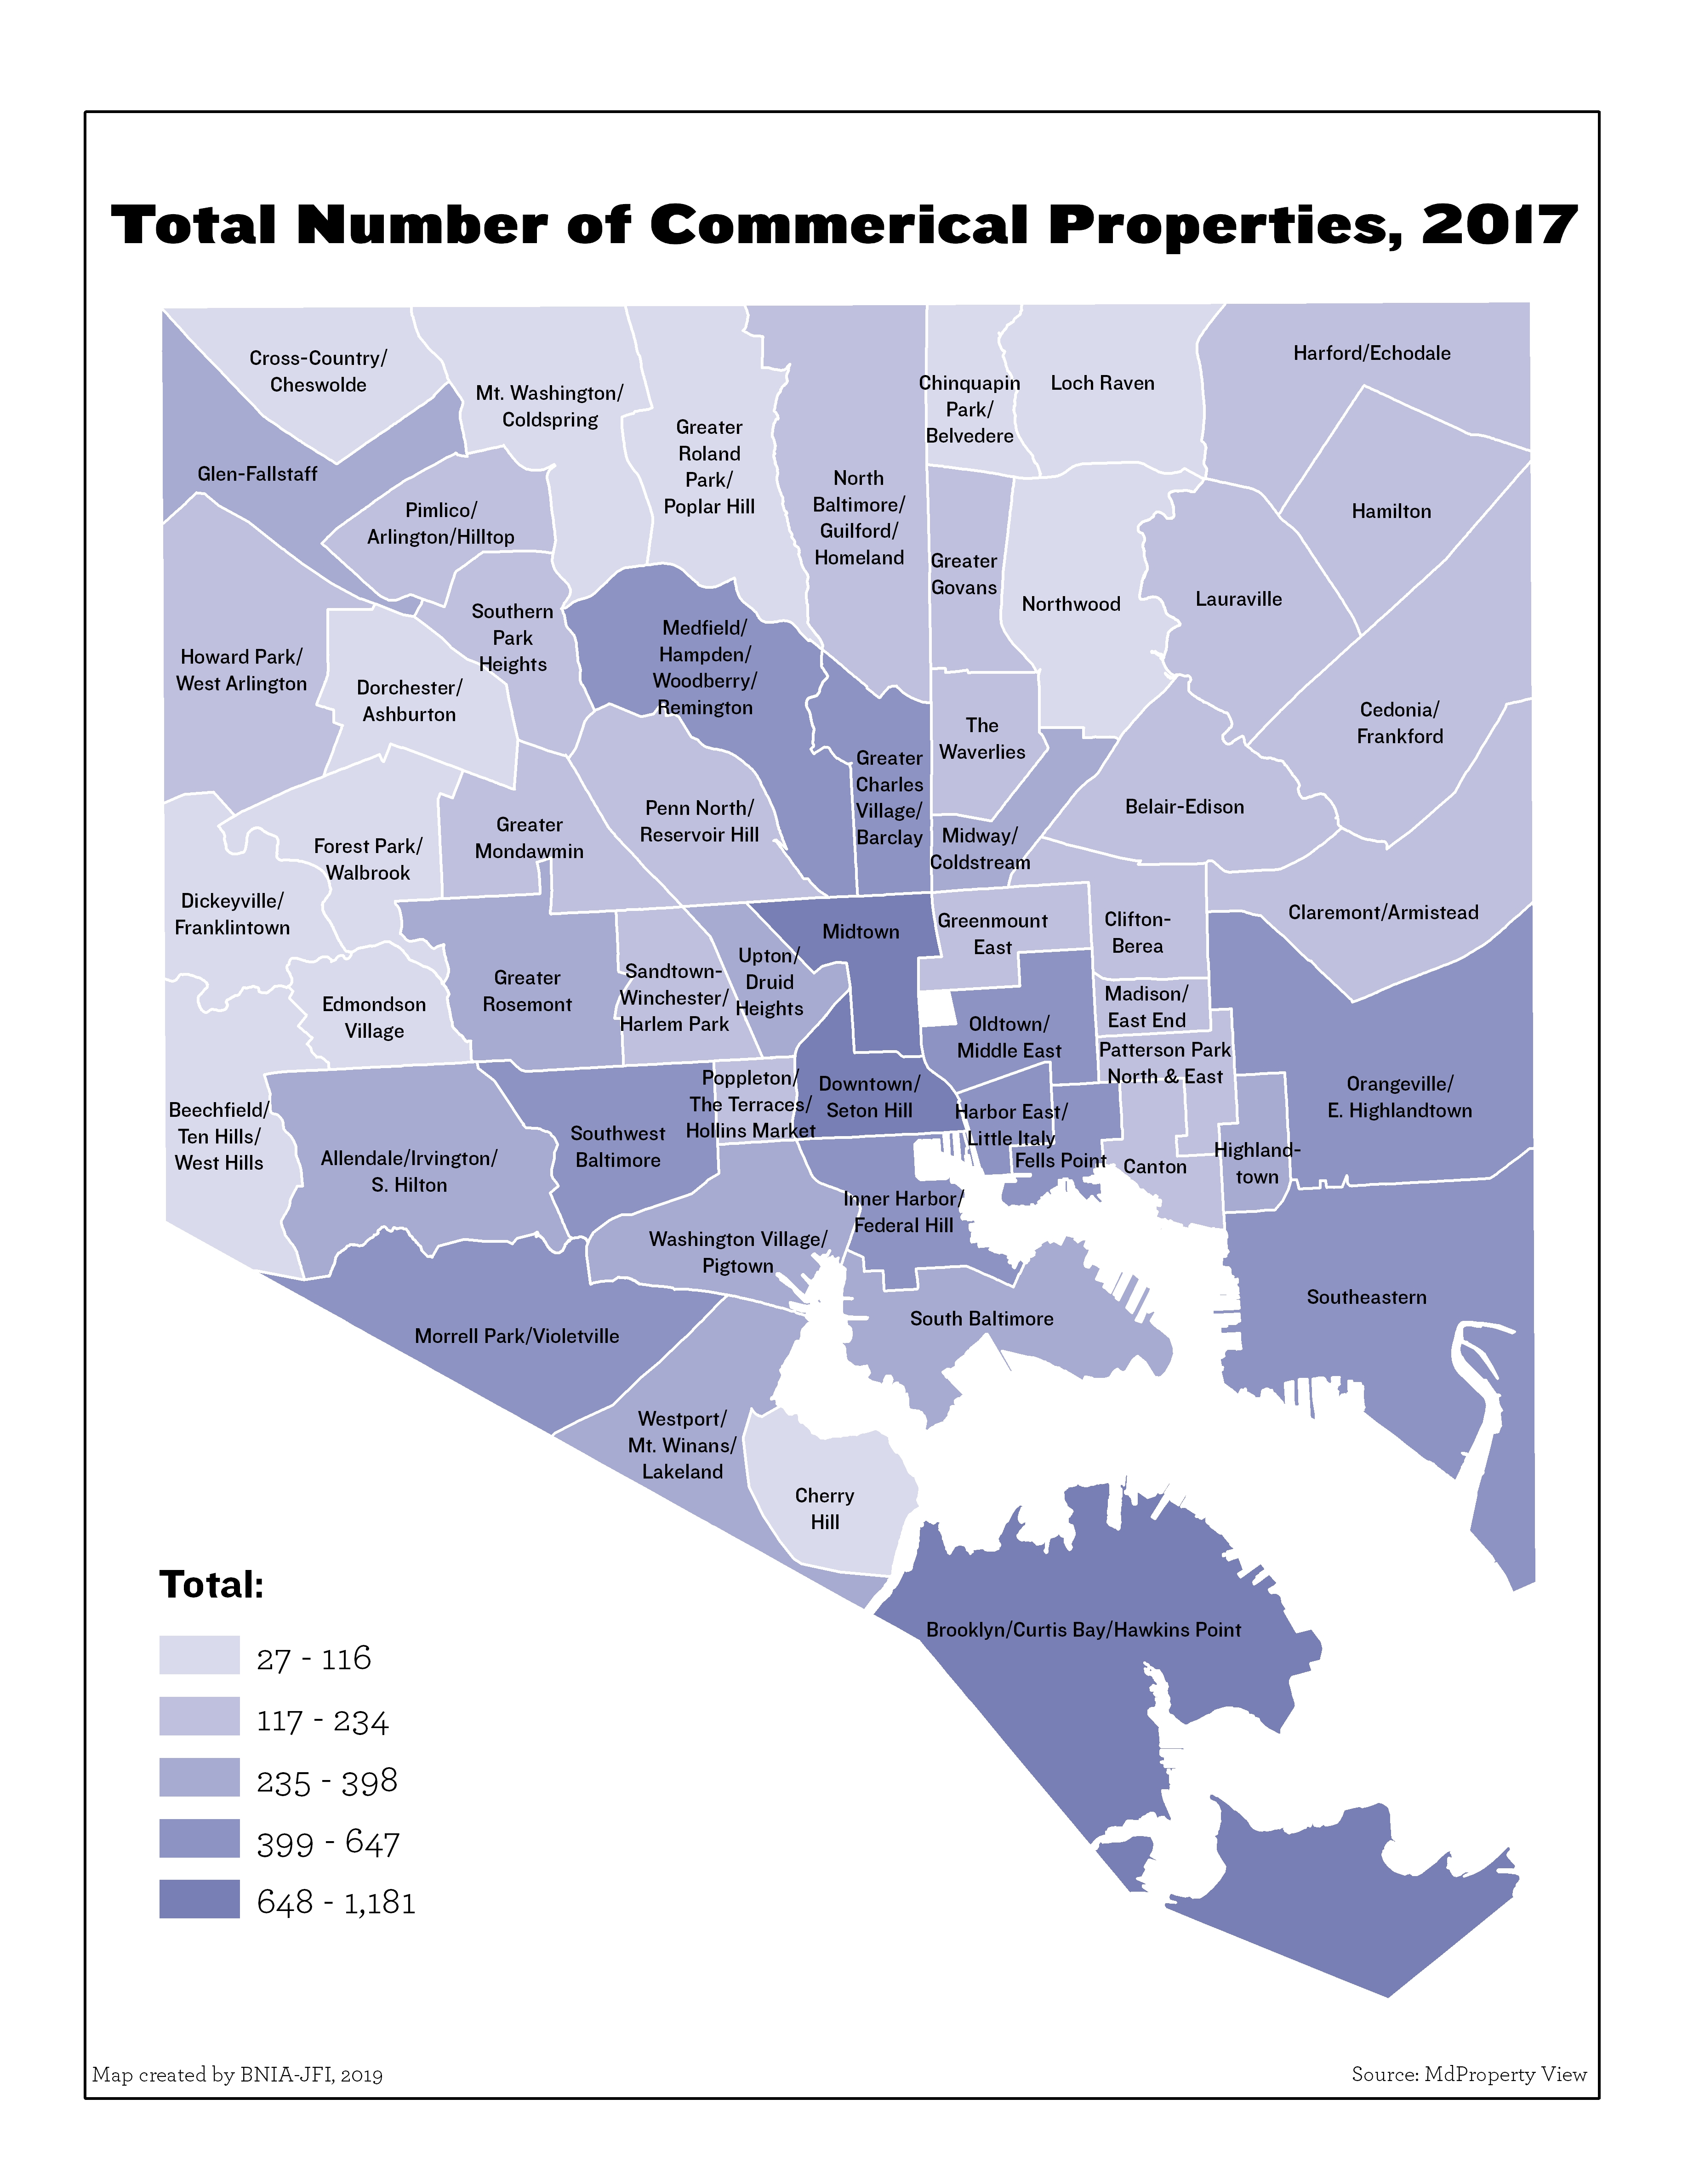
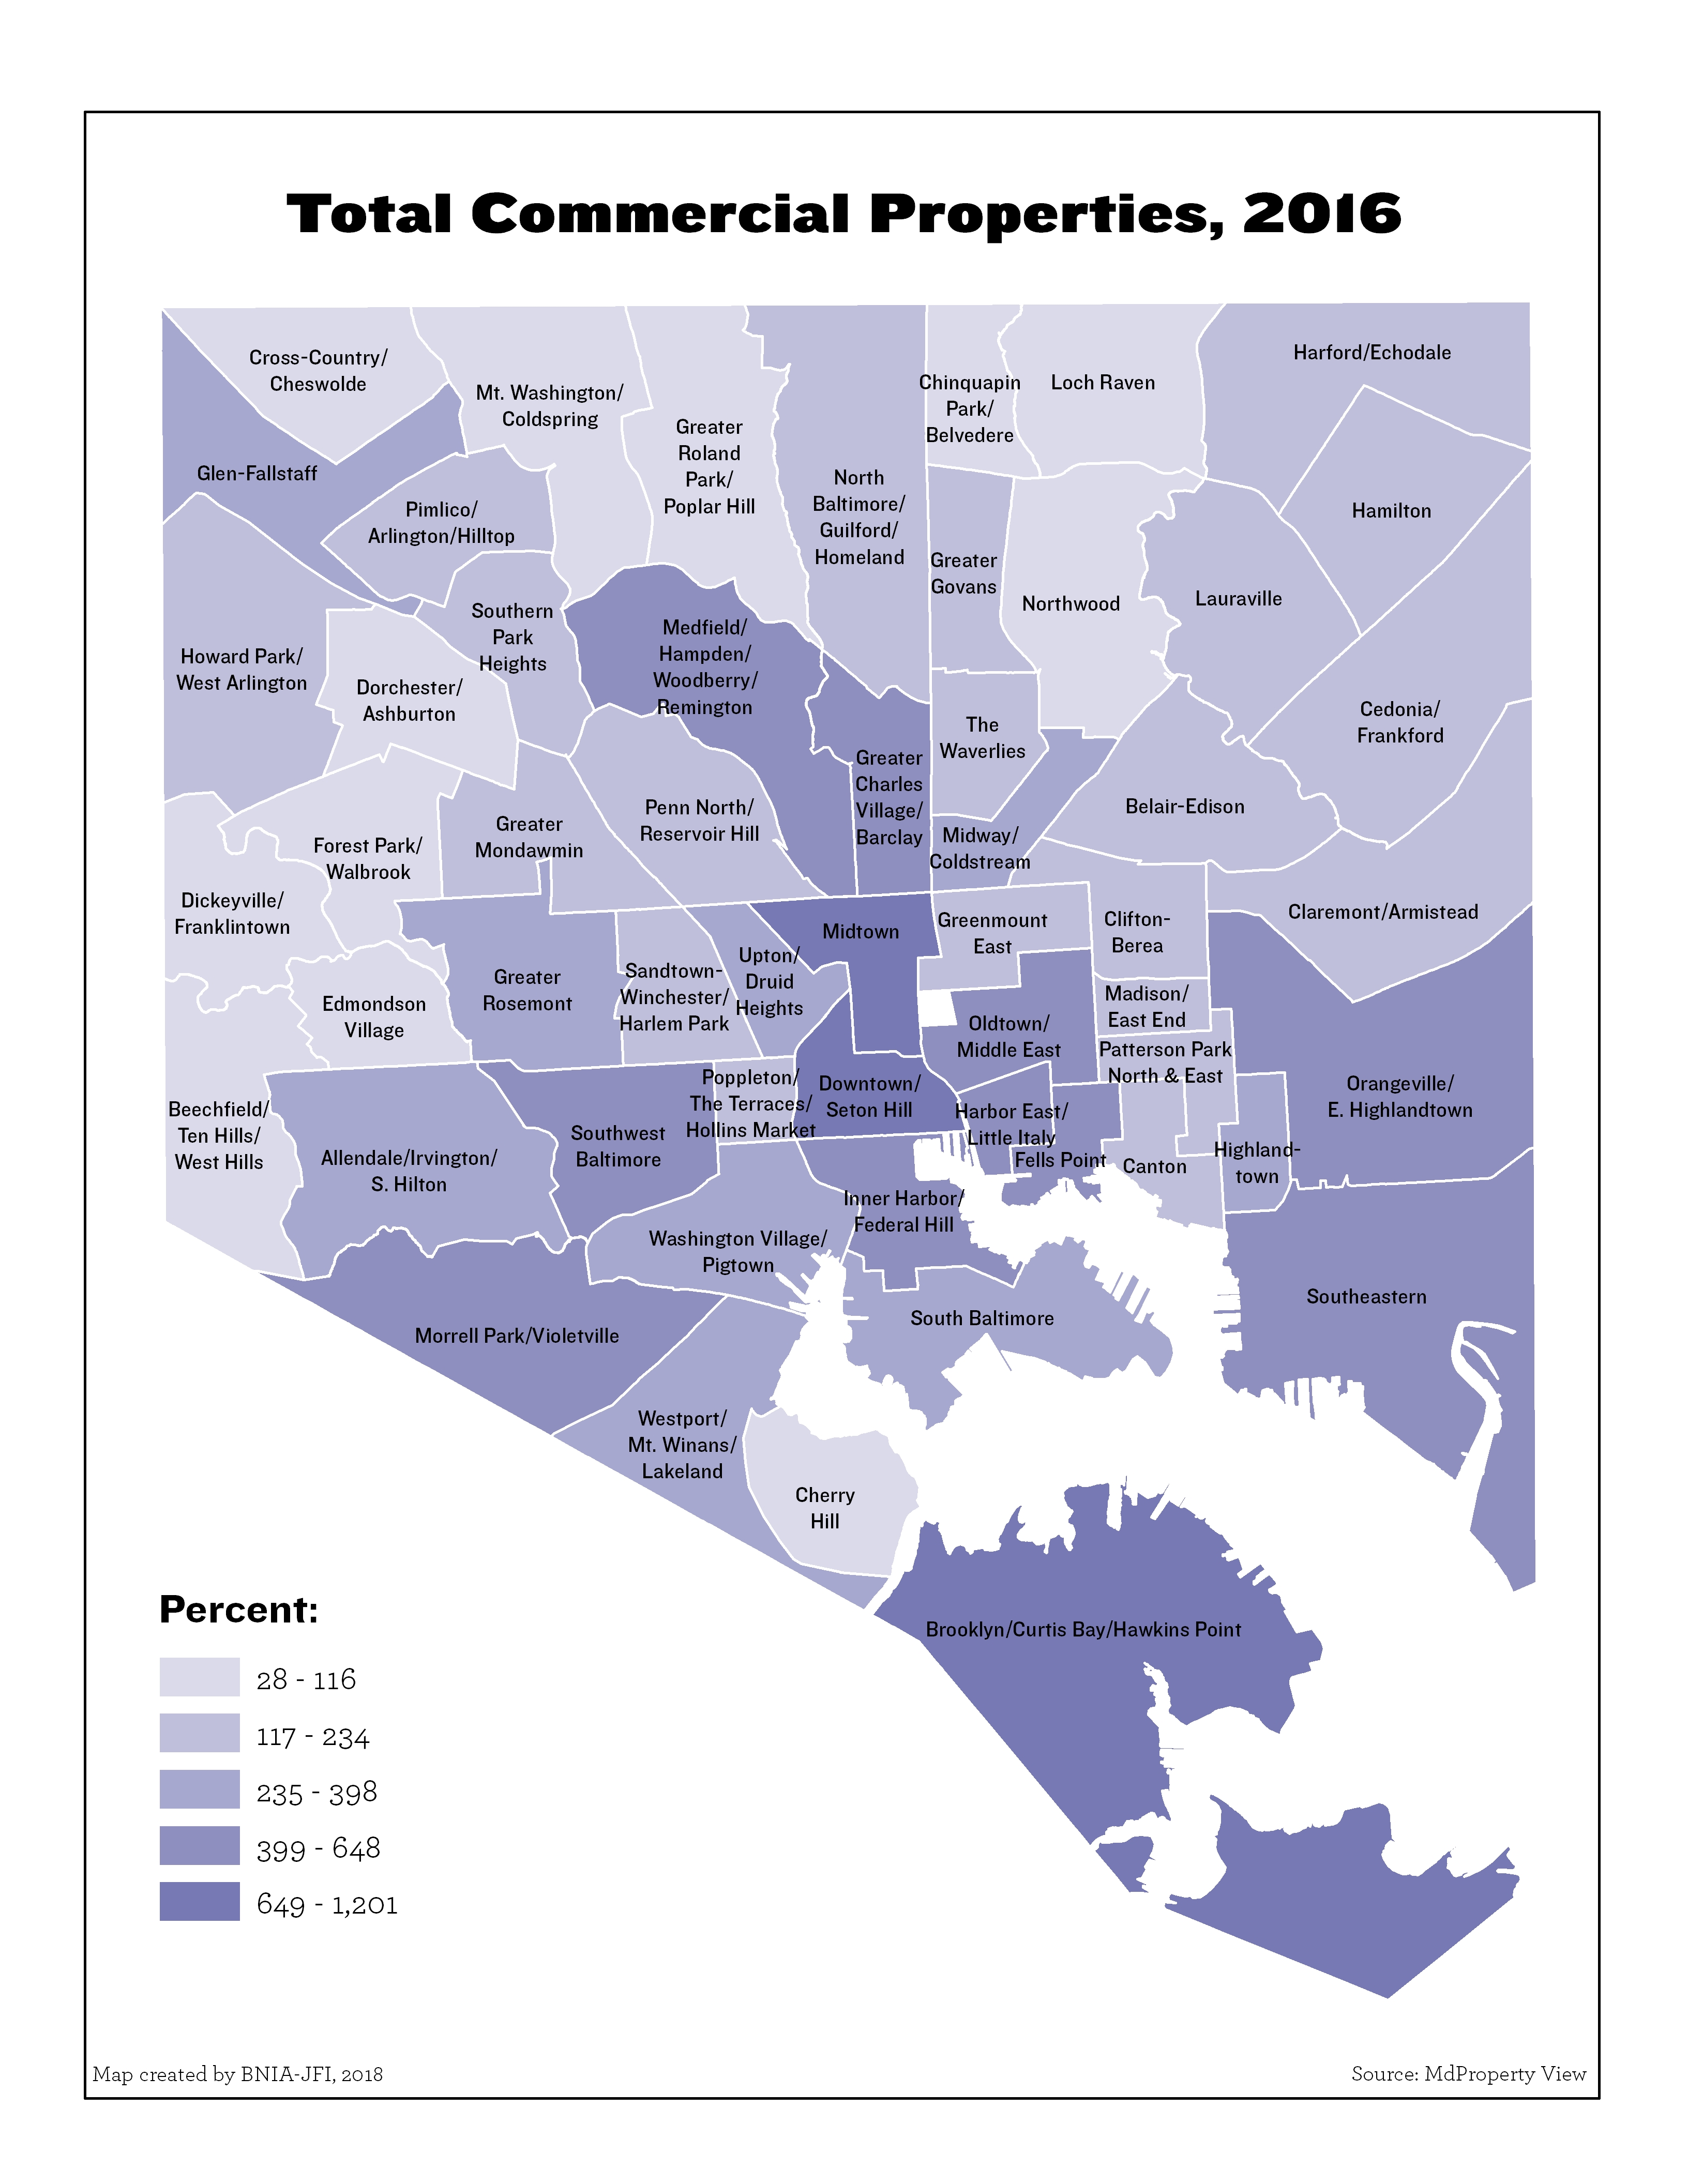
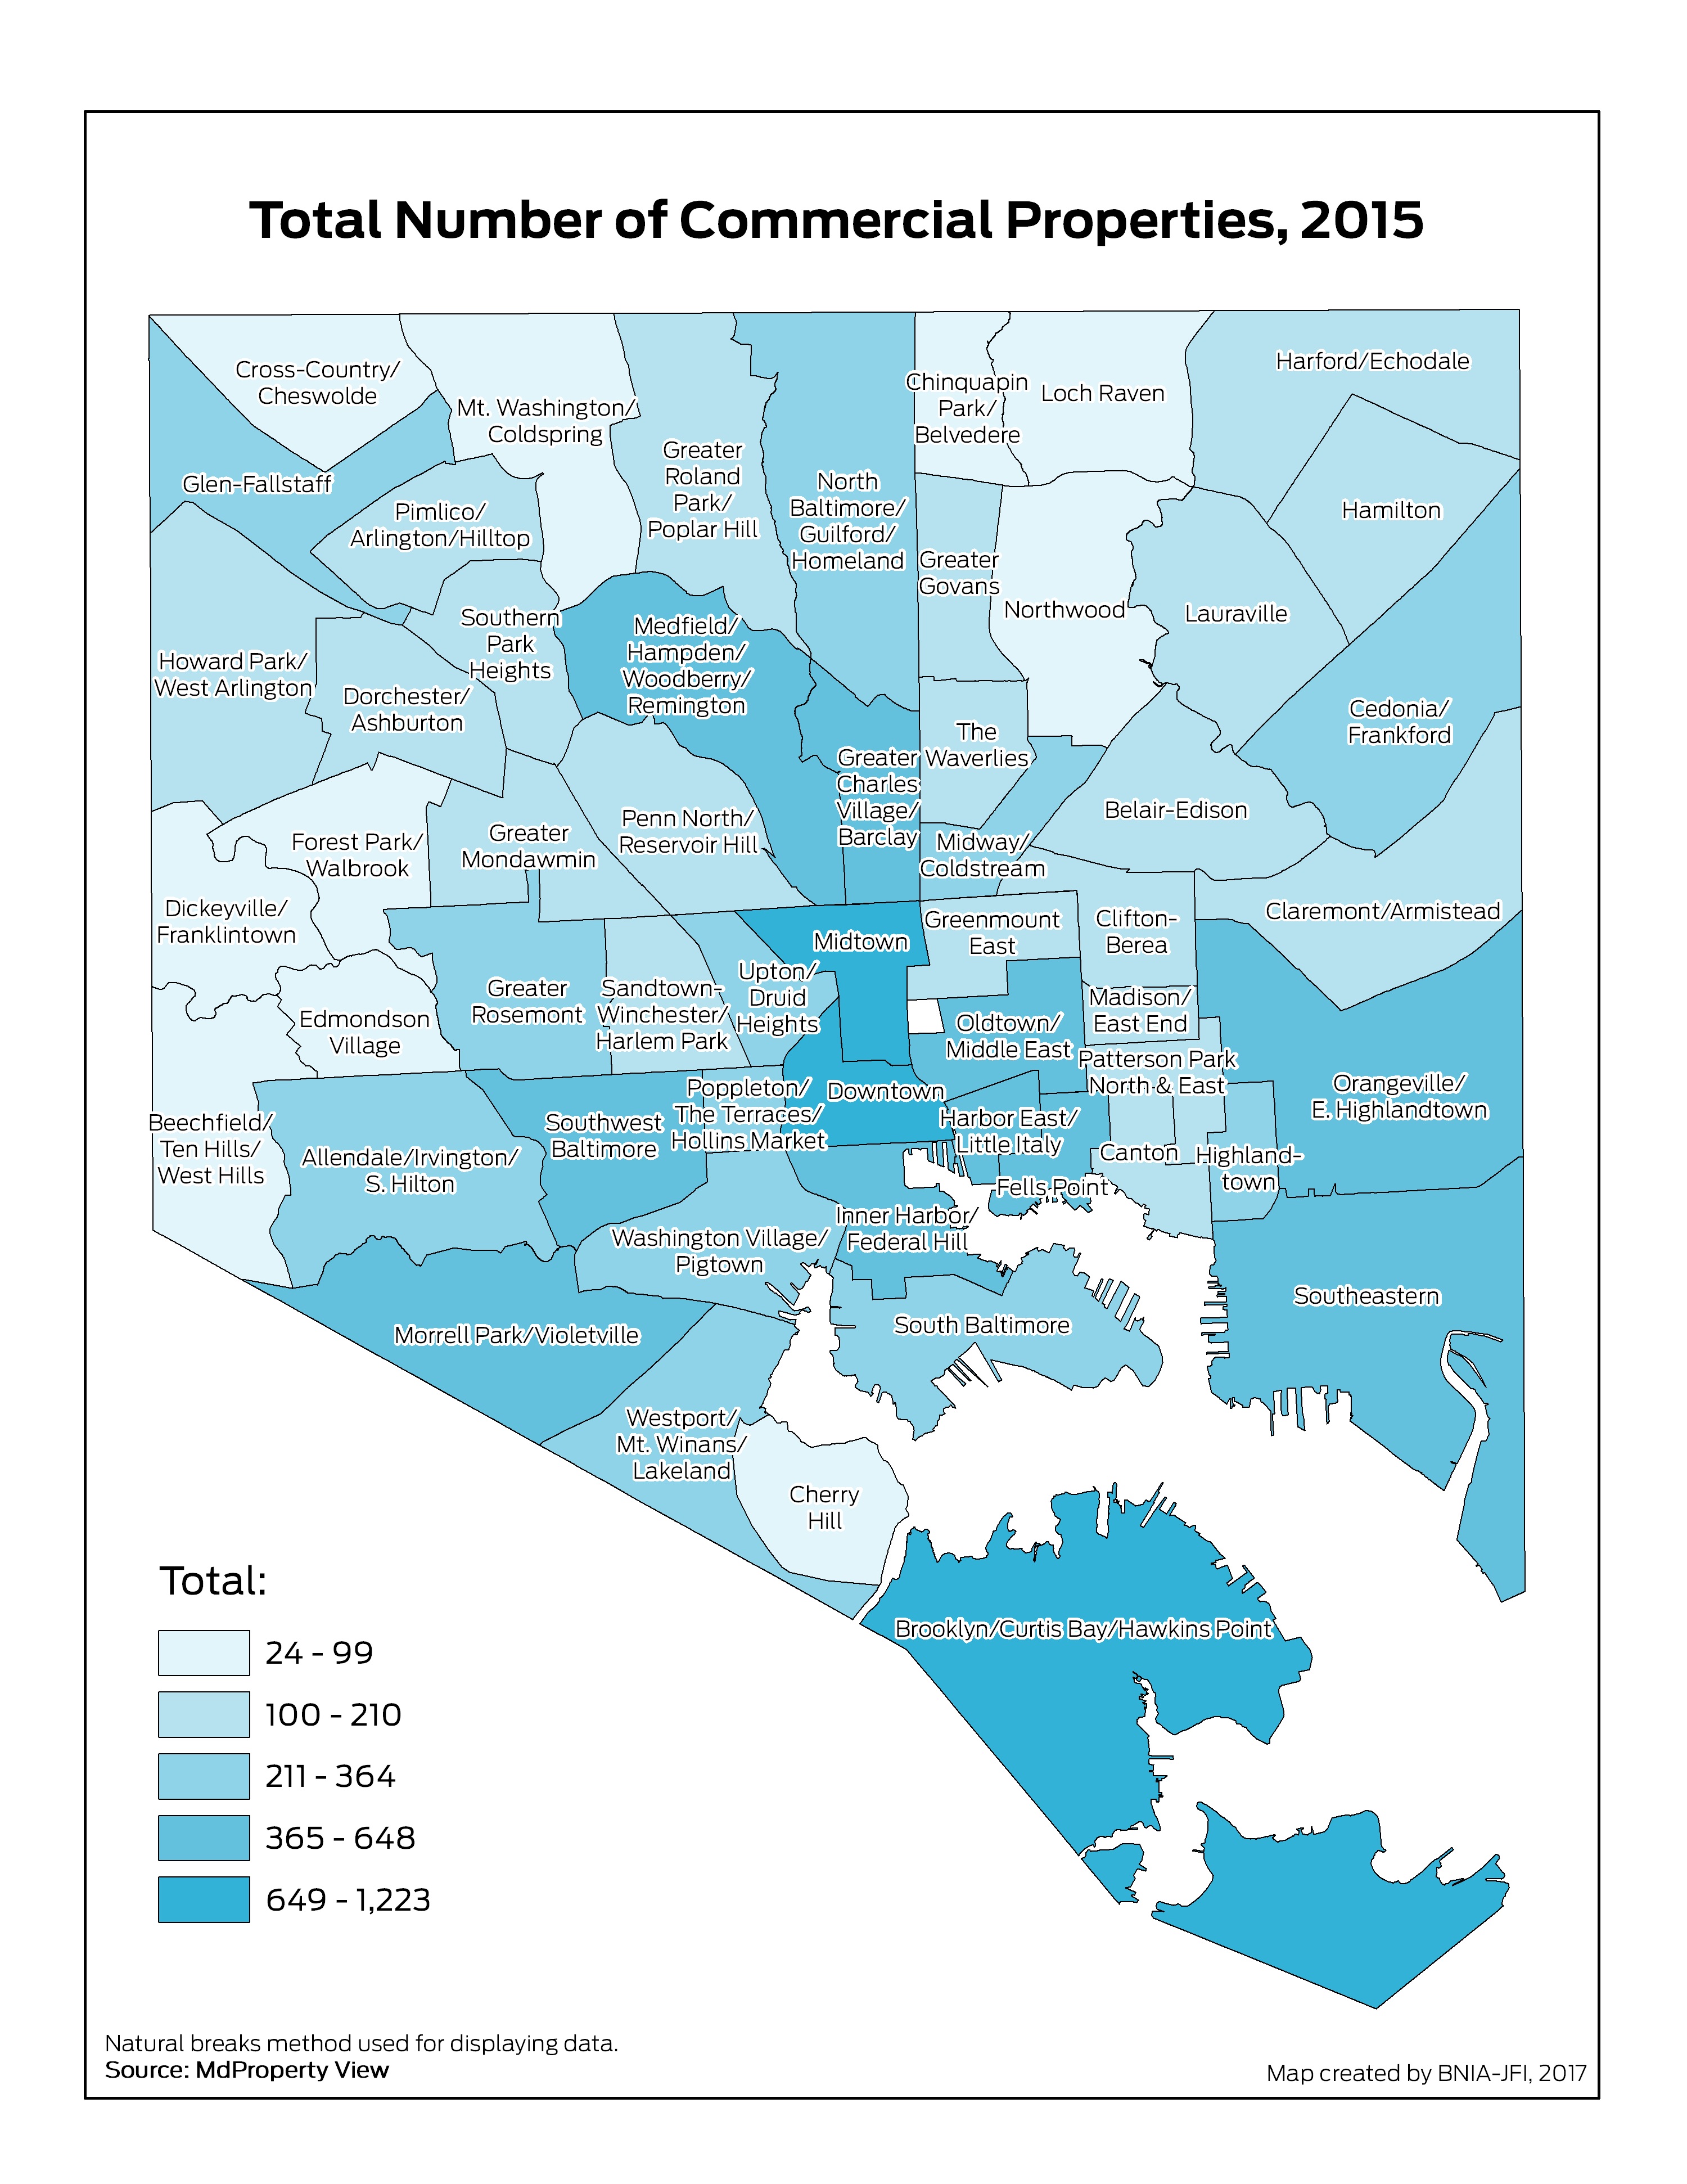
Total Number of Commercial Properties
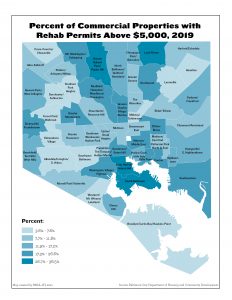
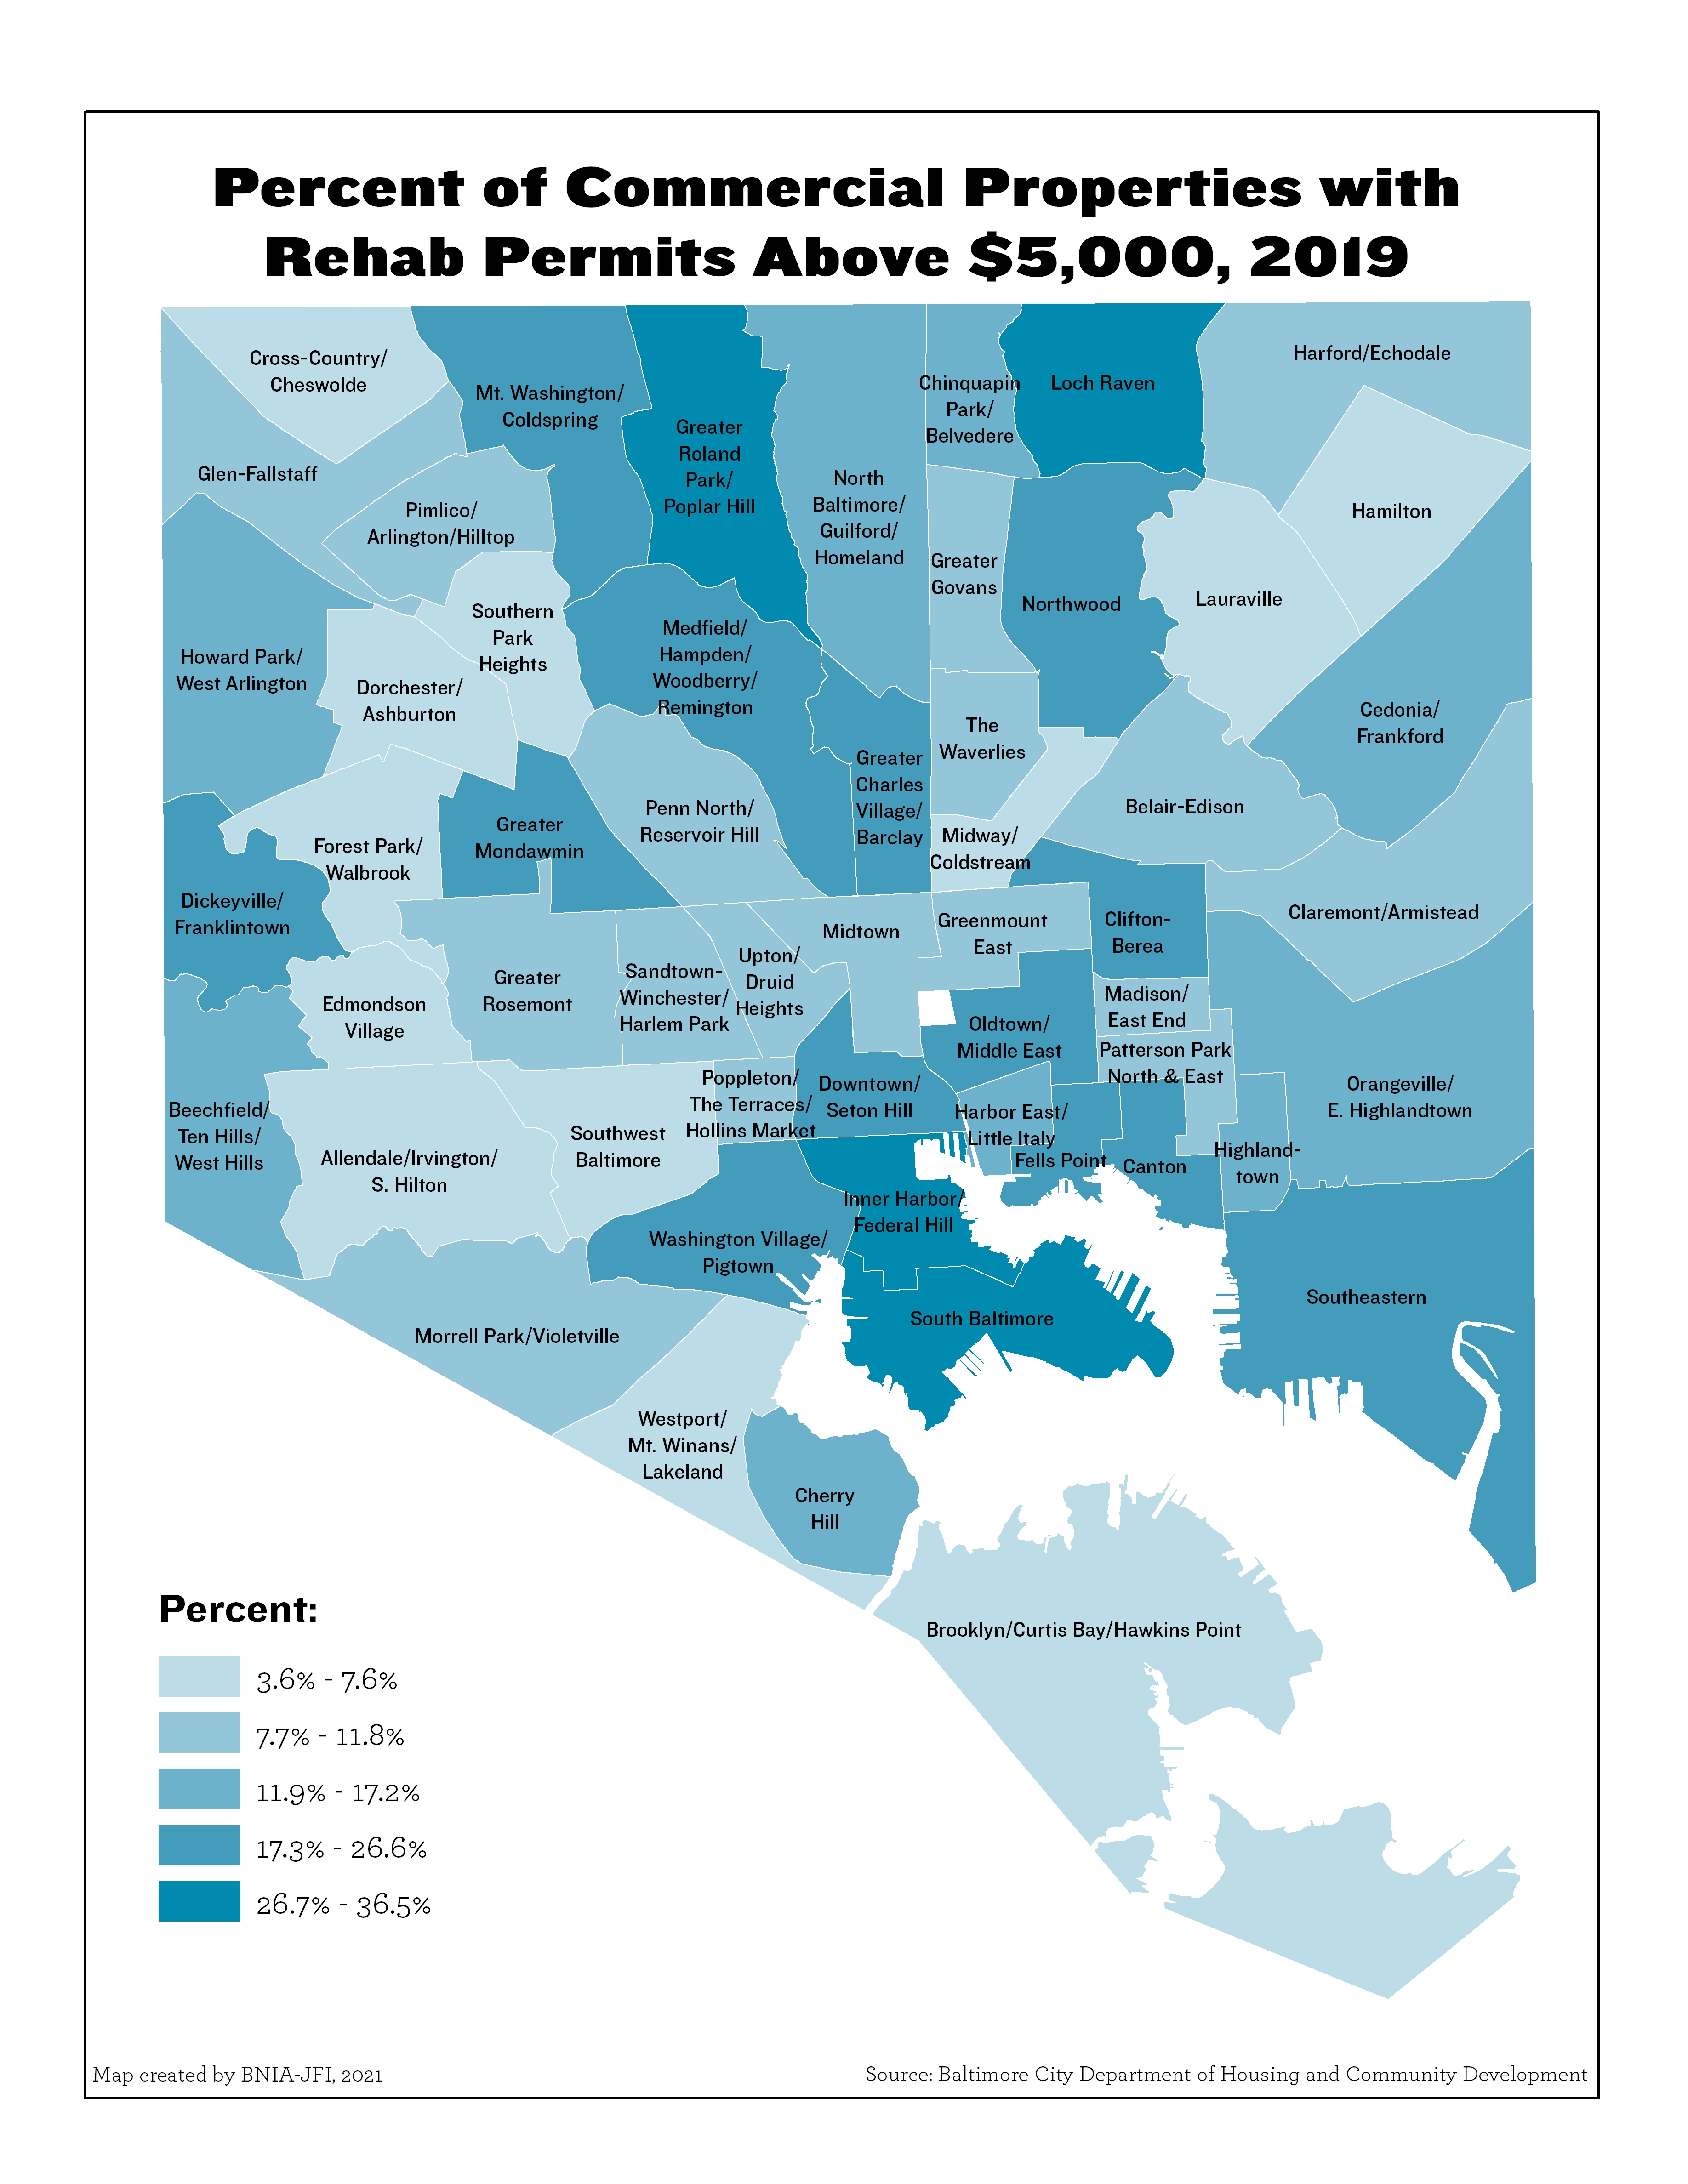
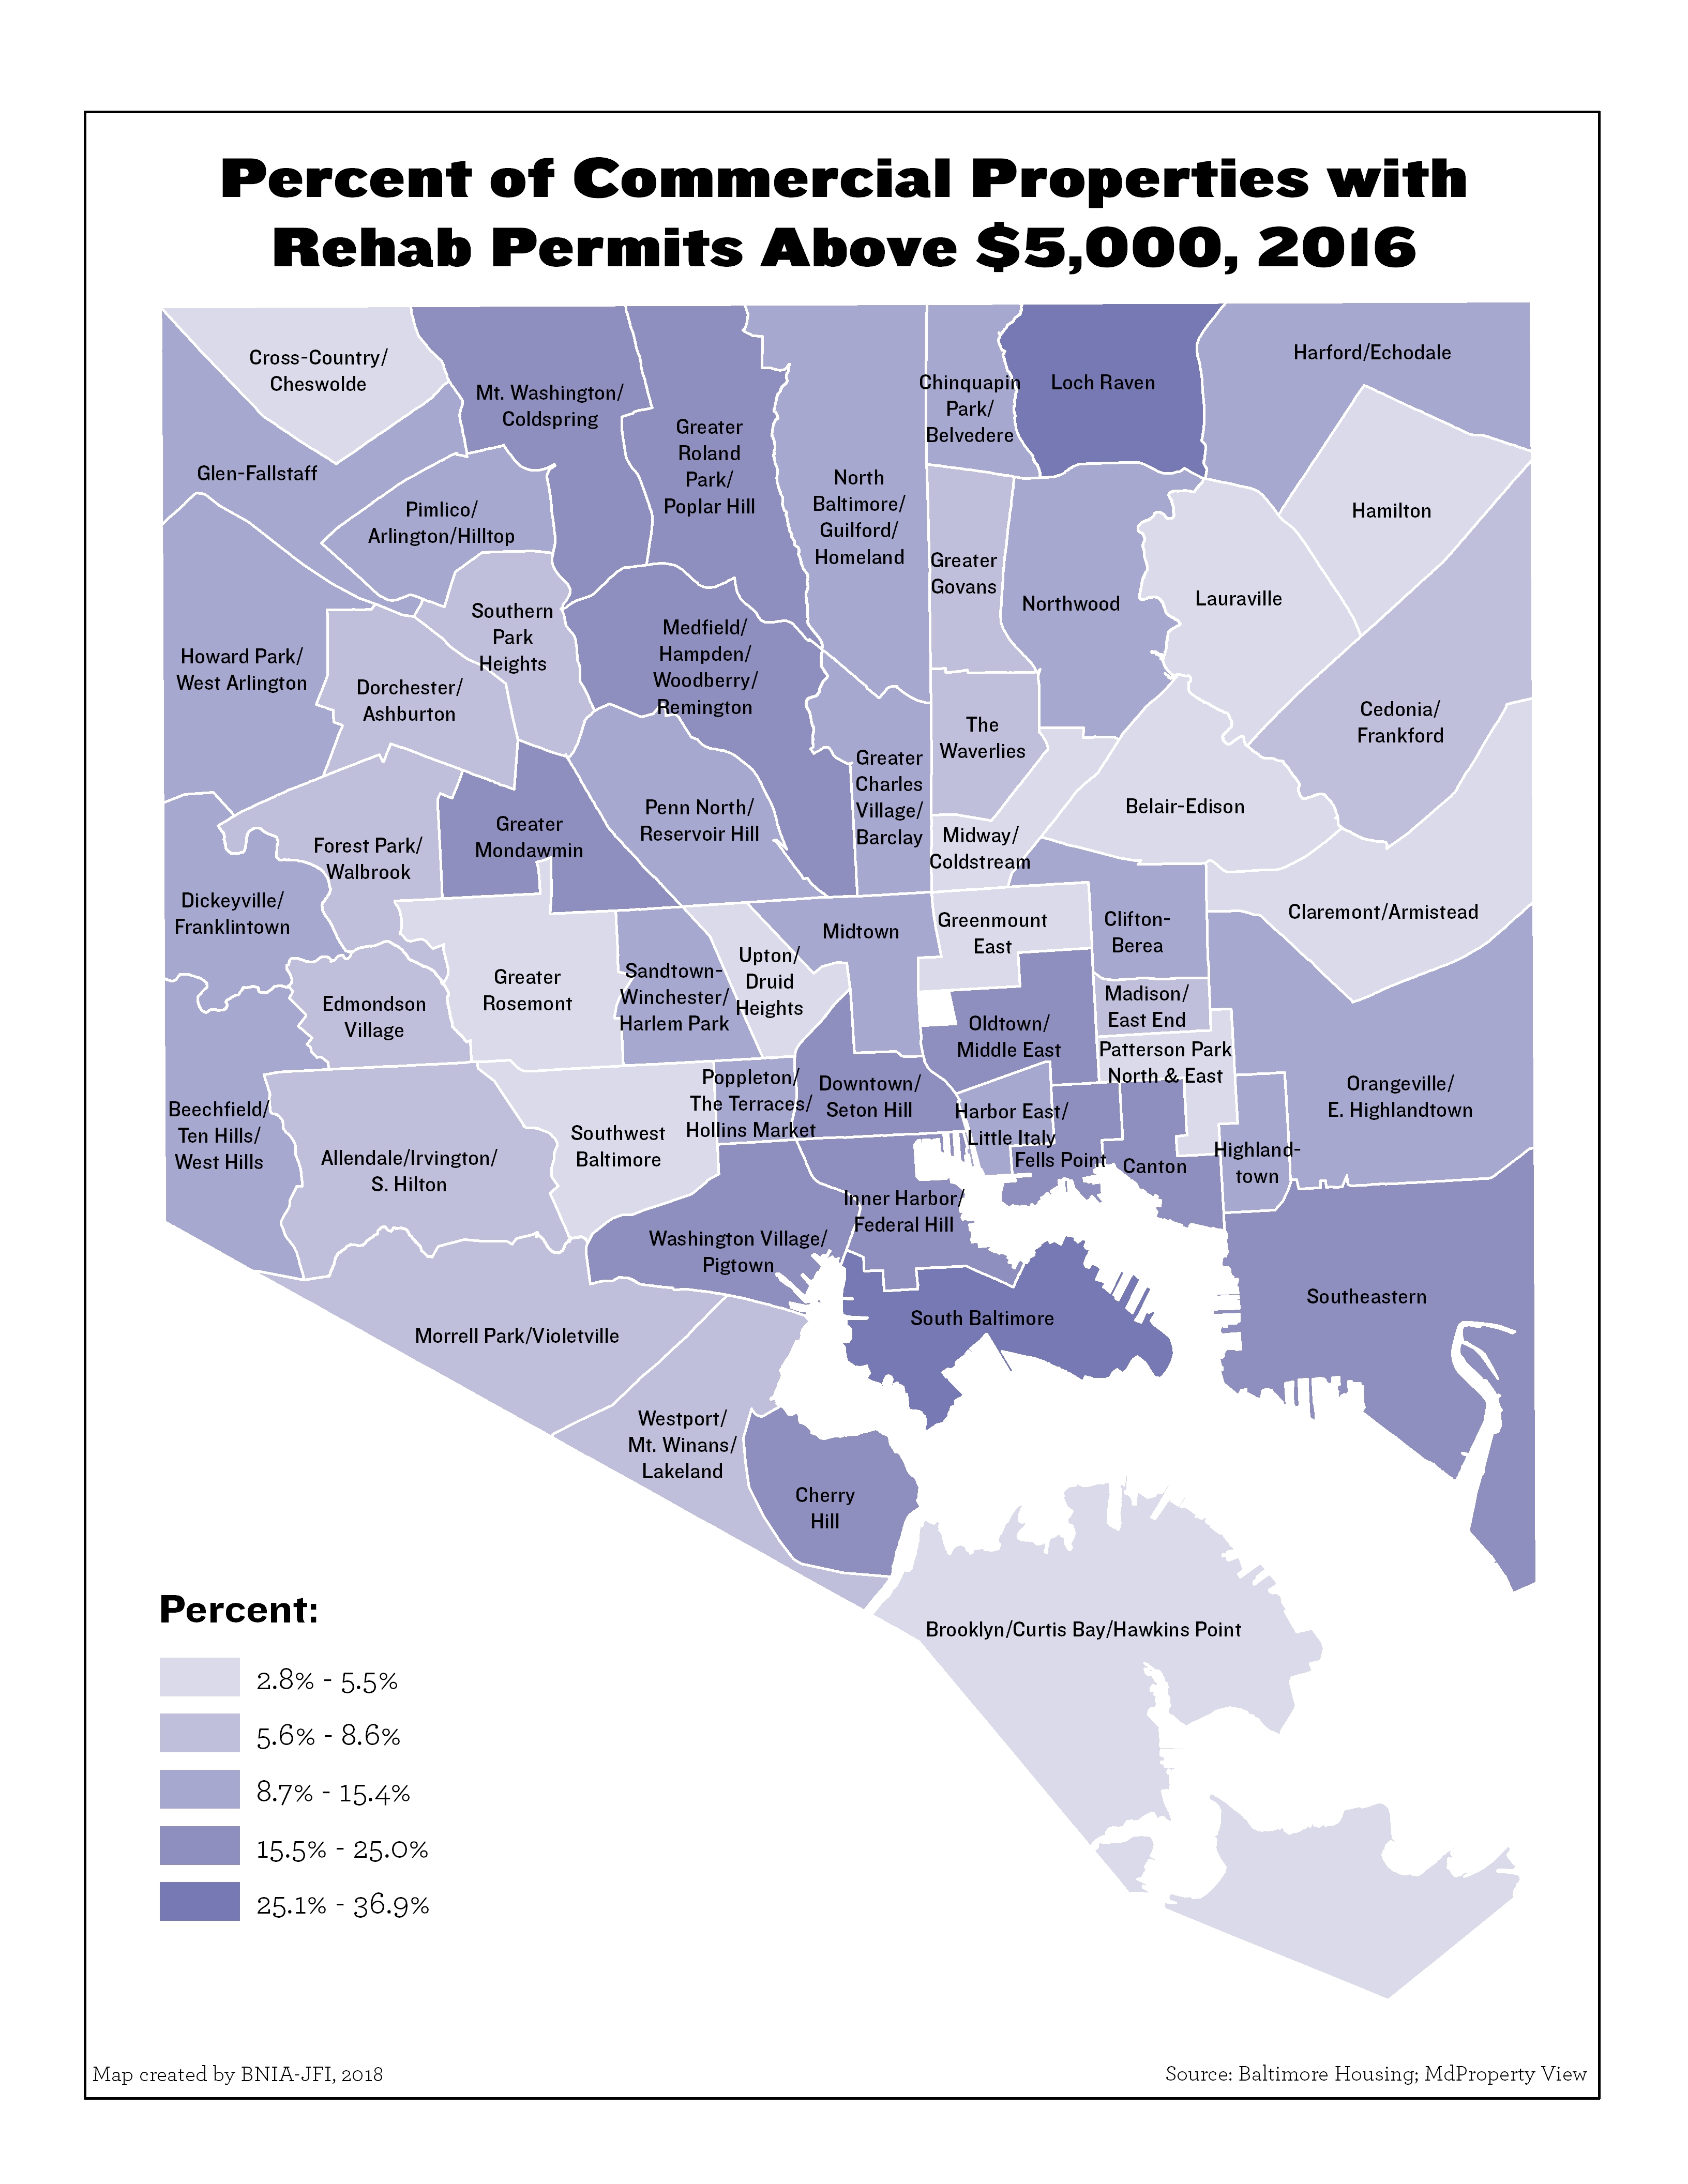
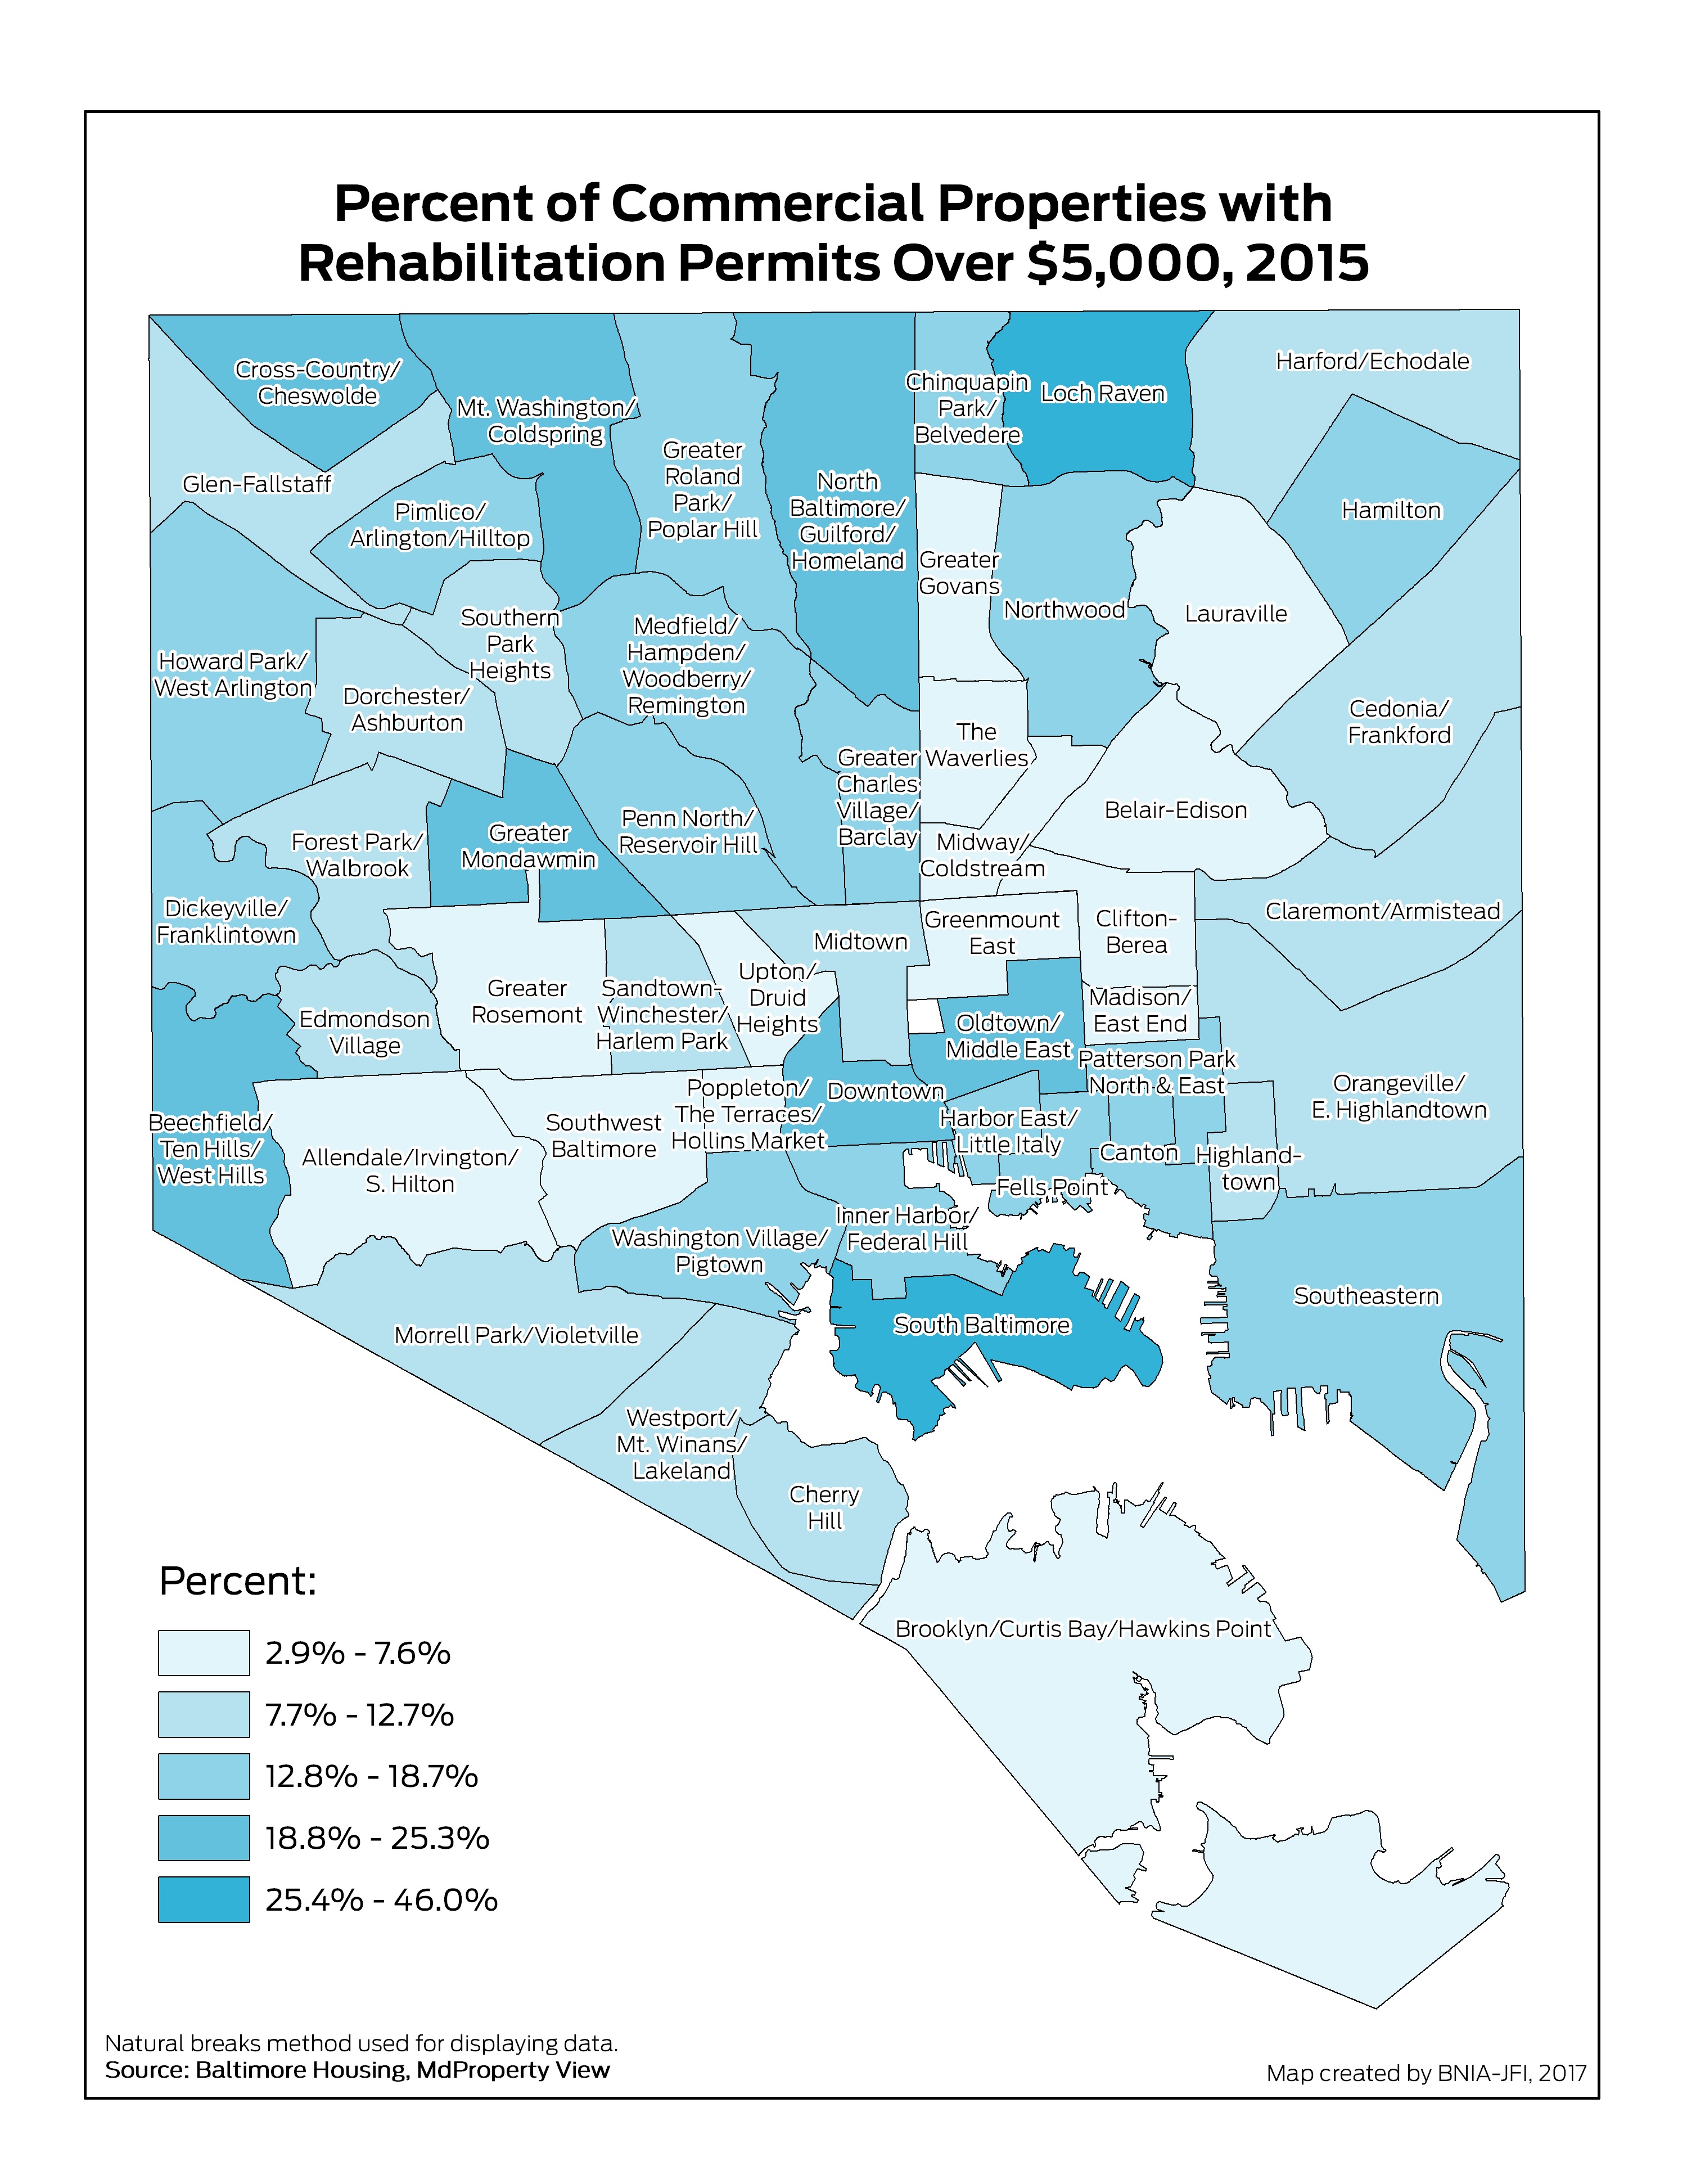
Percent of Commercial Properties with Rehab Permits Above $5,000
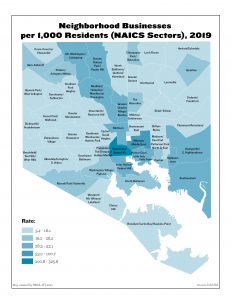
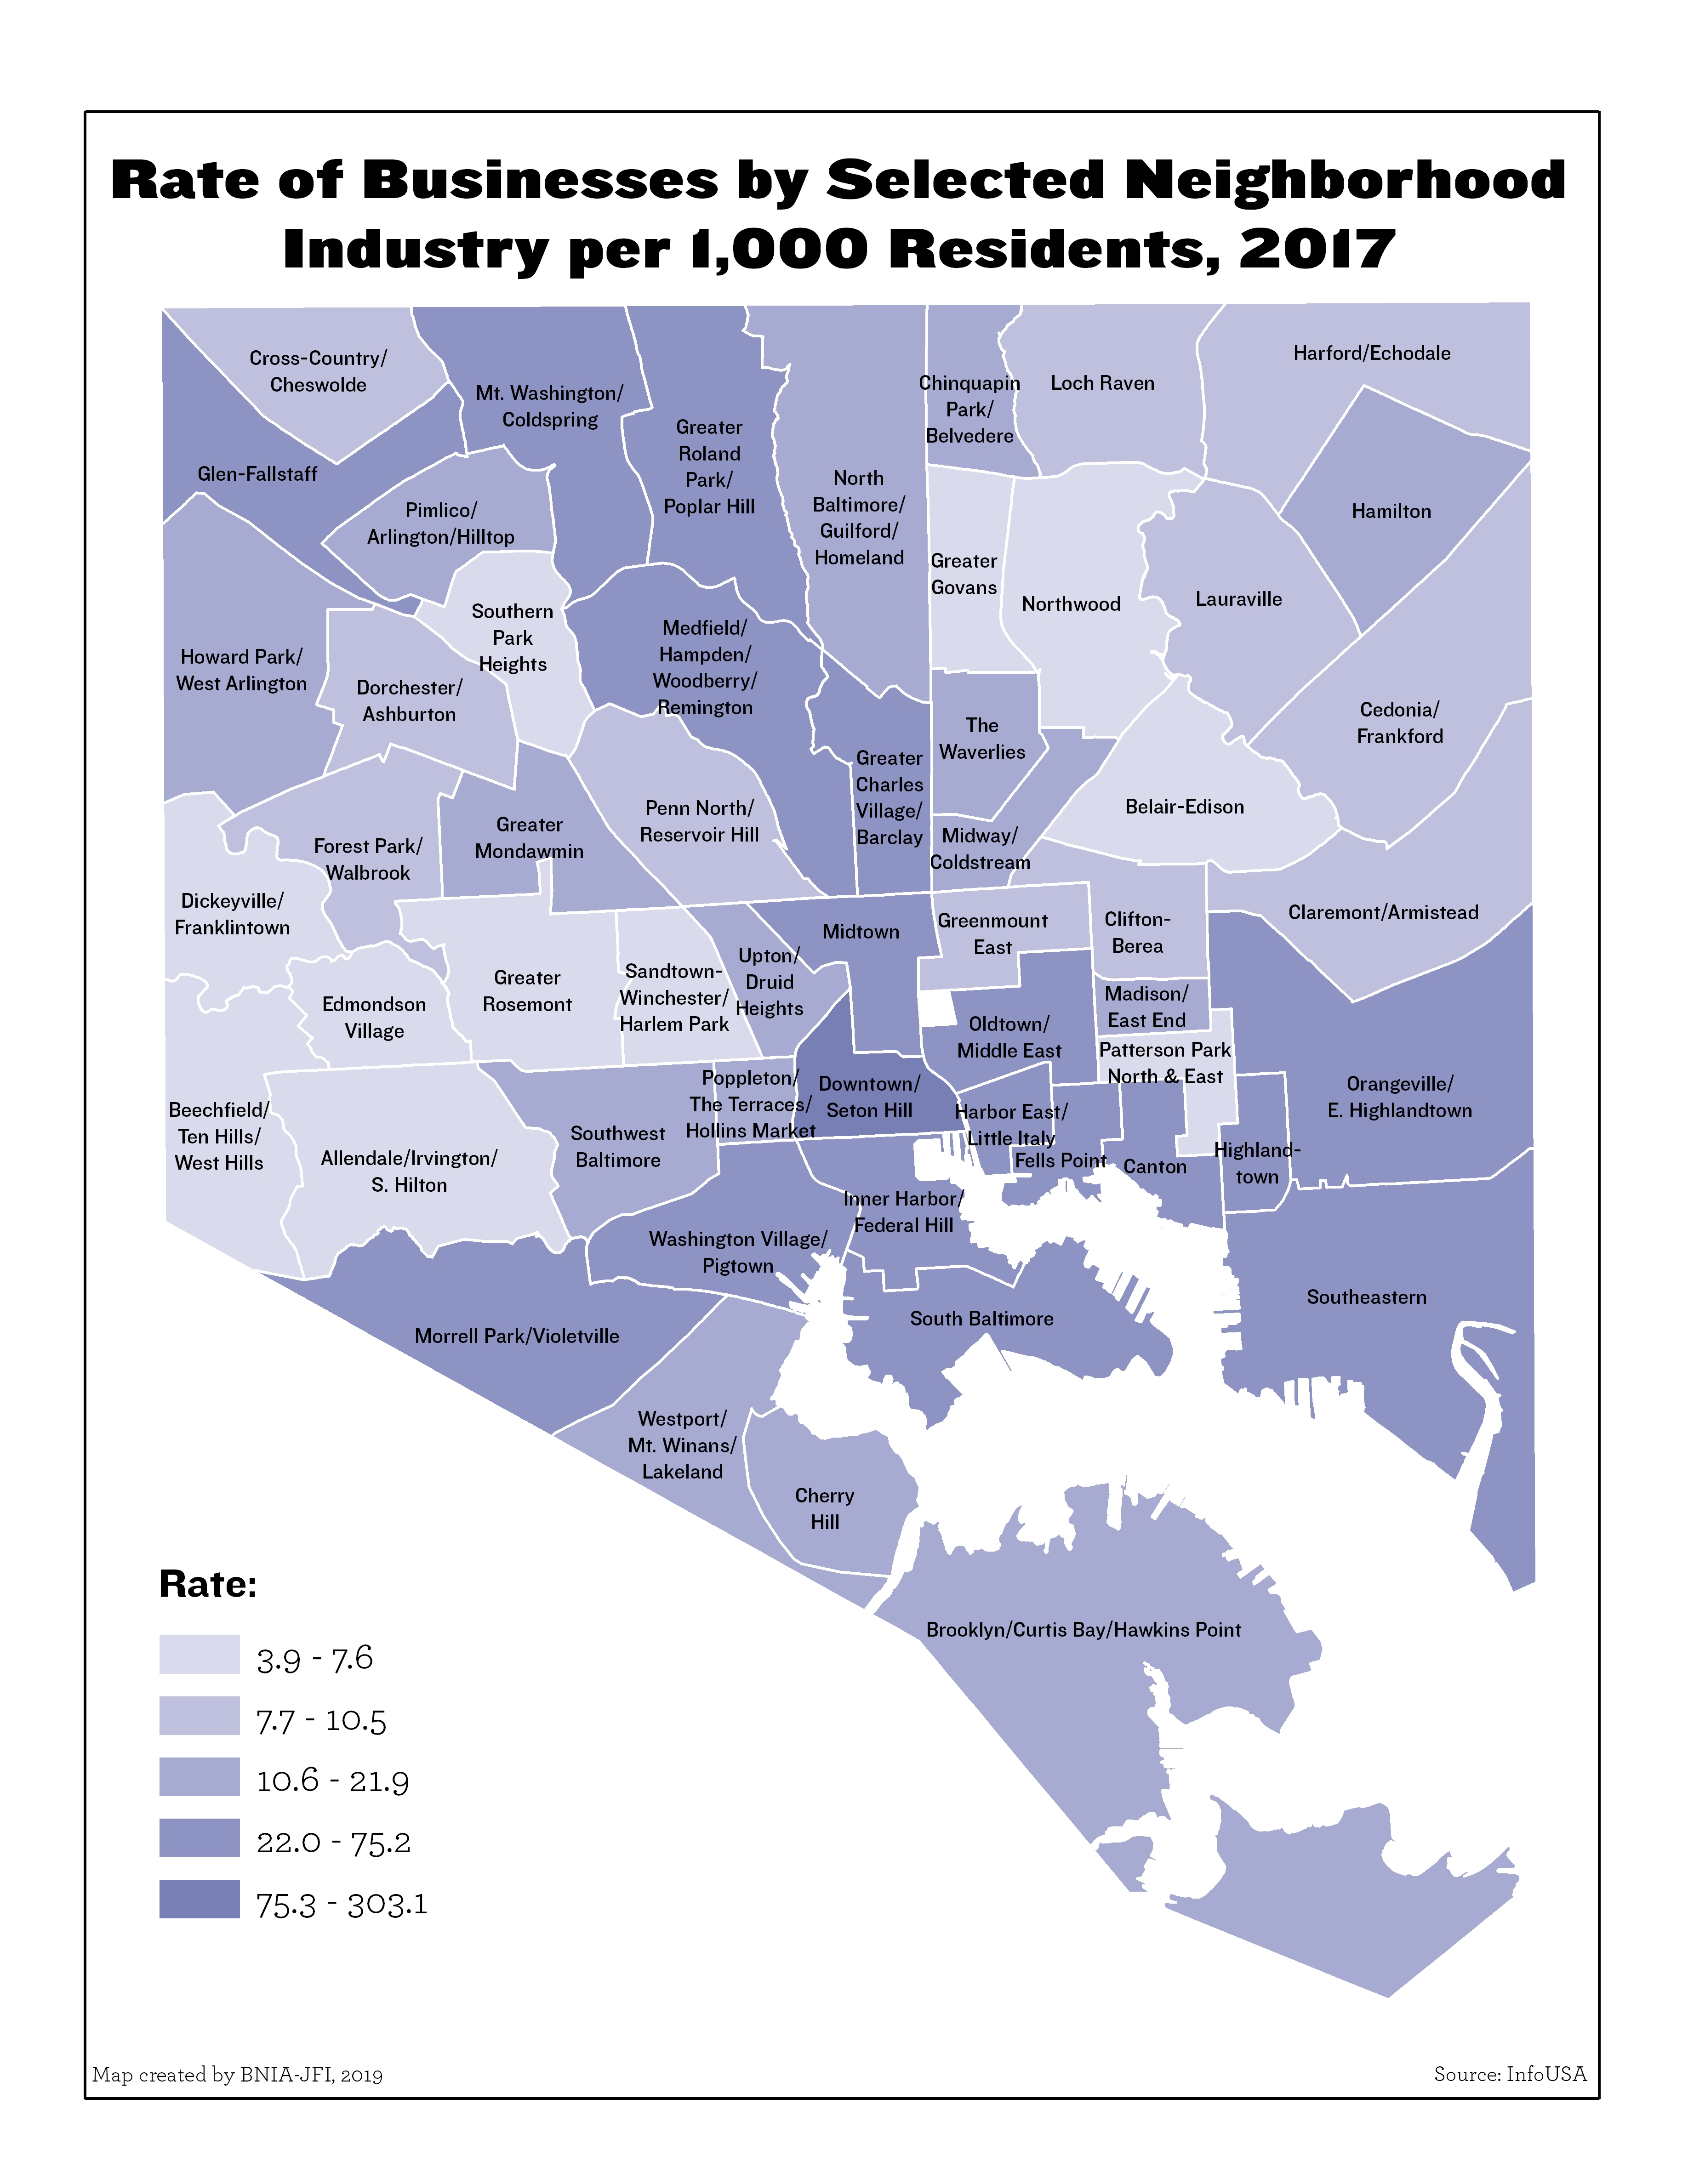
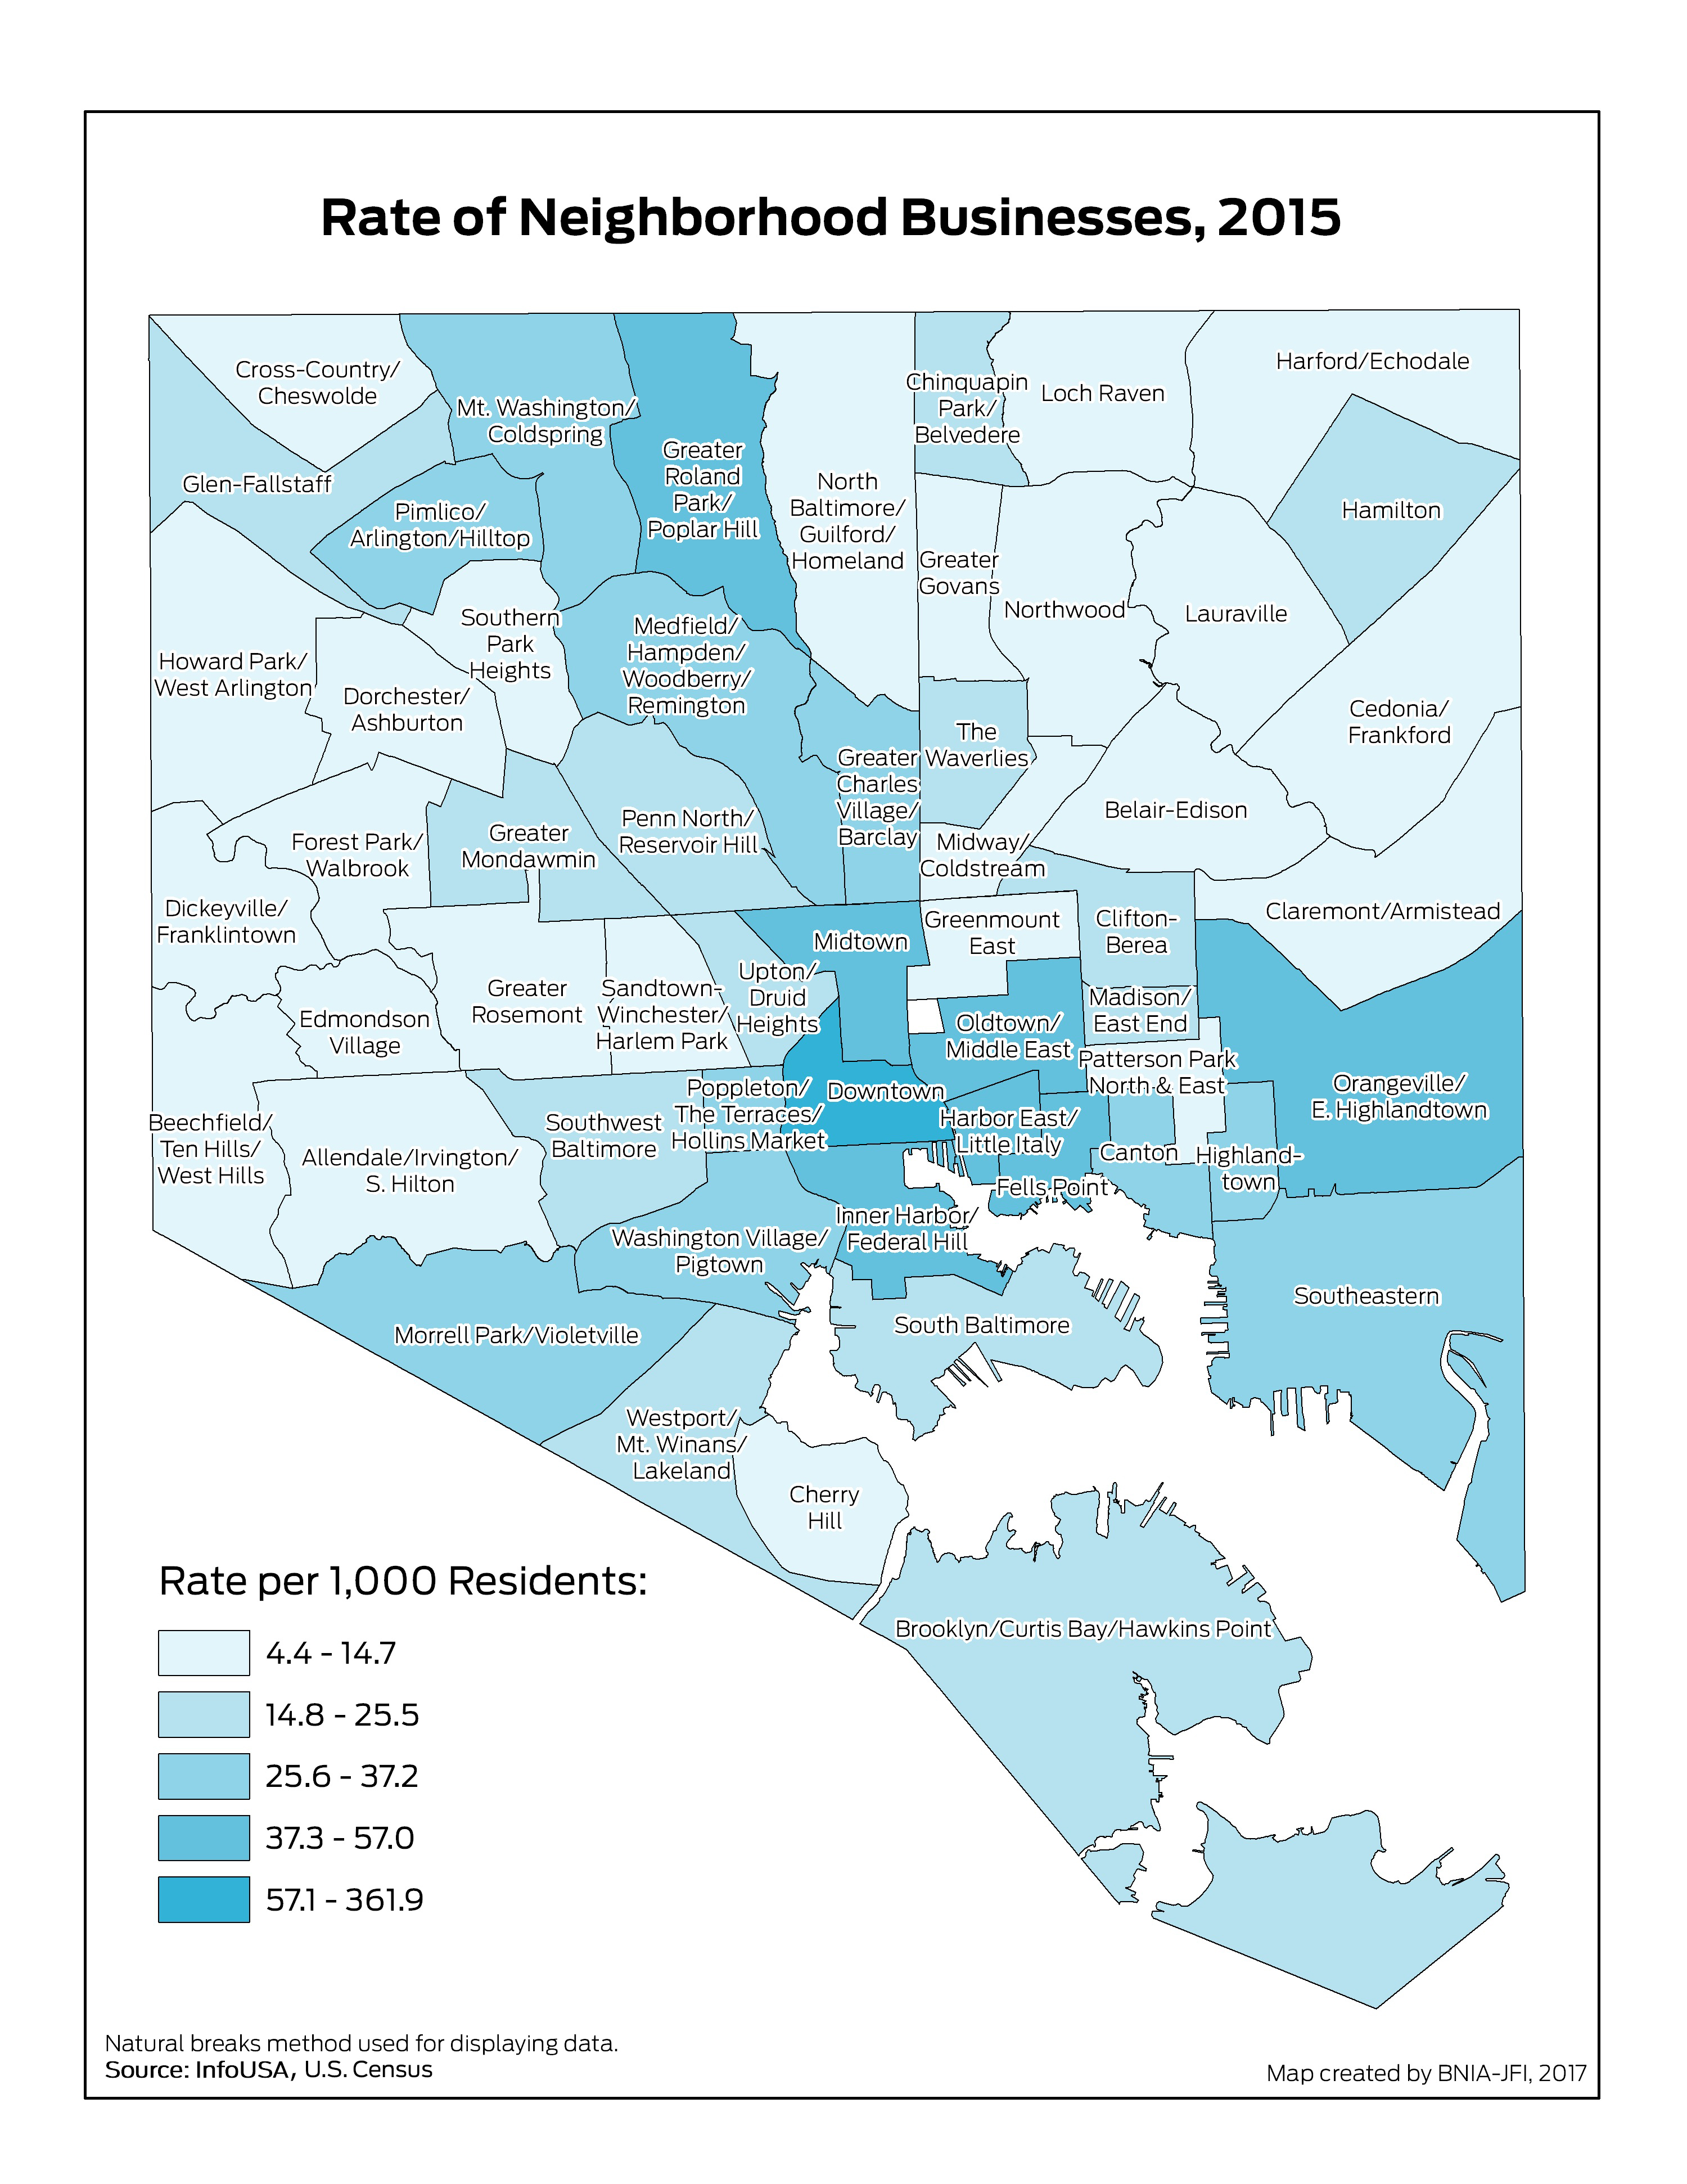
Neighborhood Businesses per 1,000 Residents (NAICS Sectors)
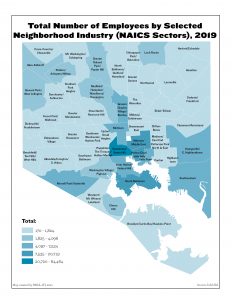
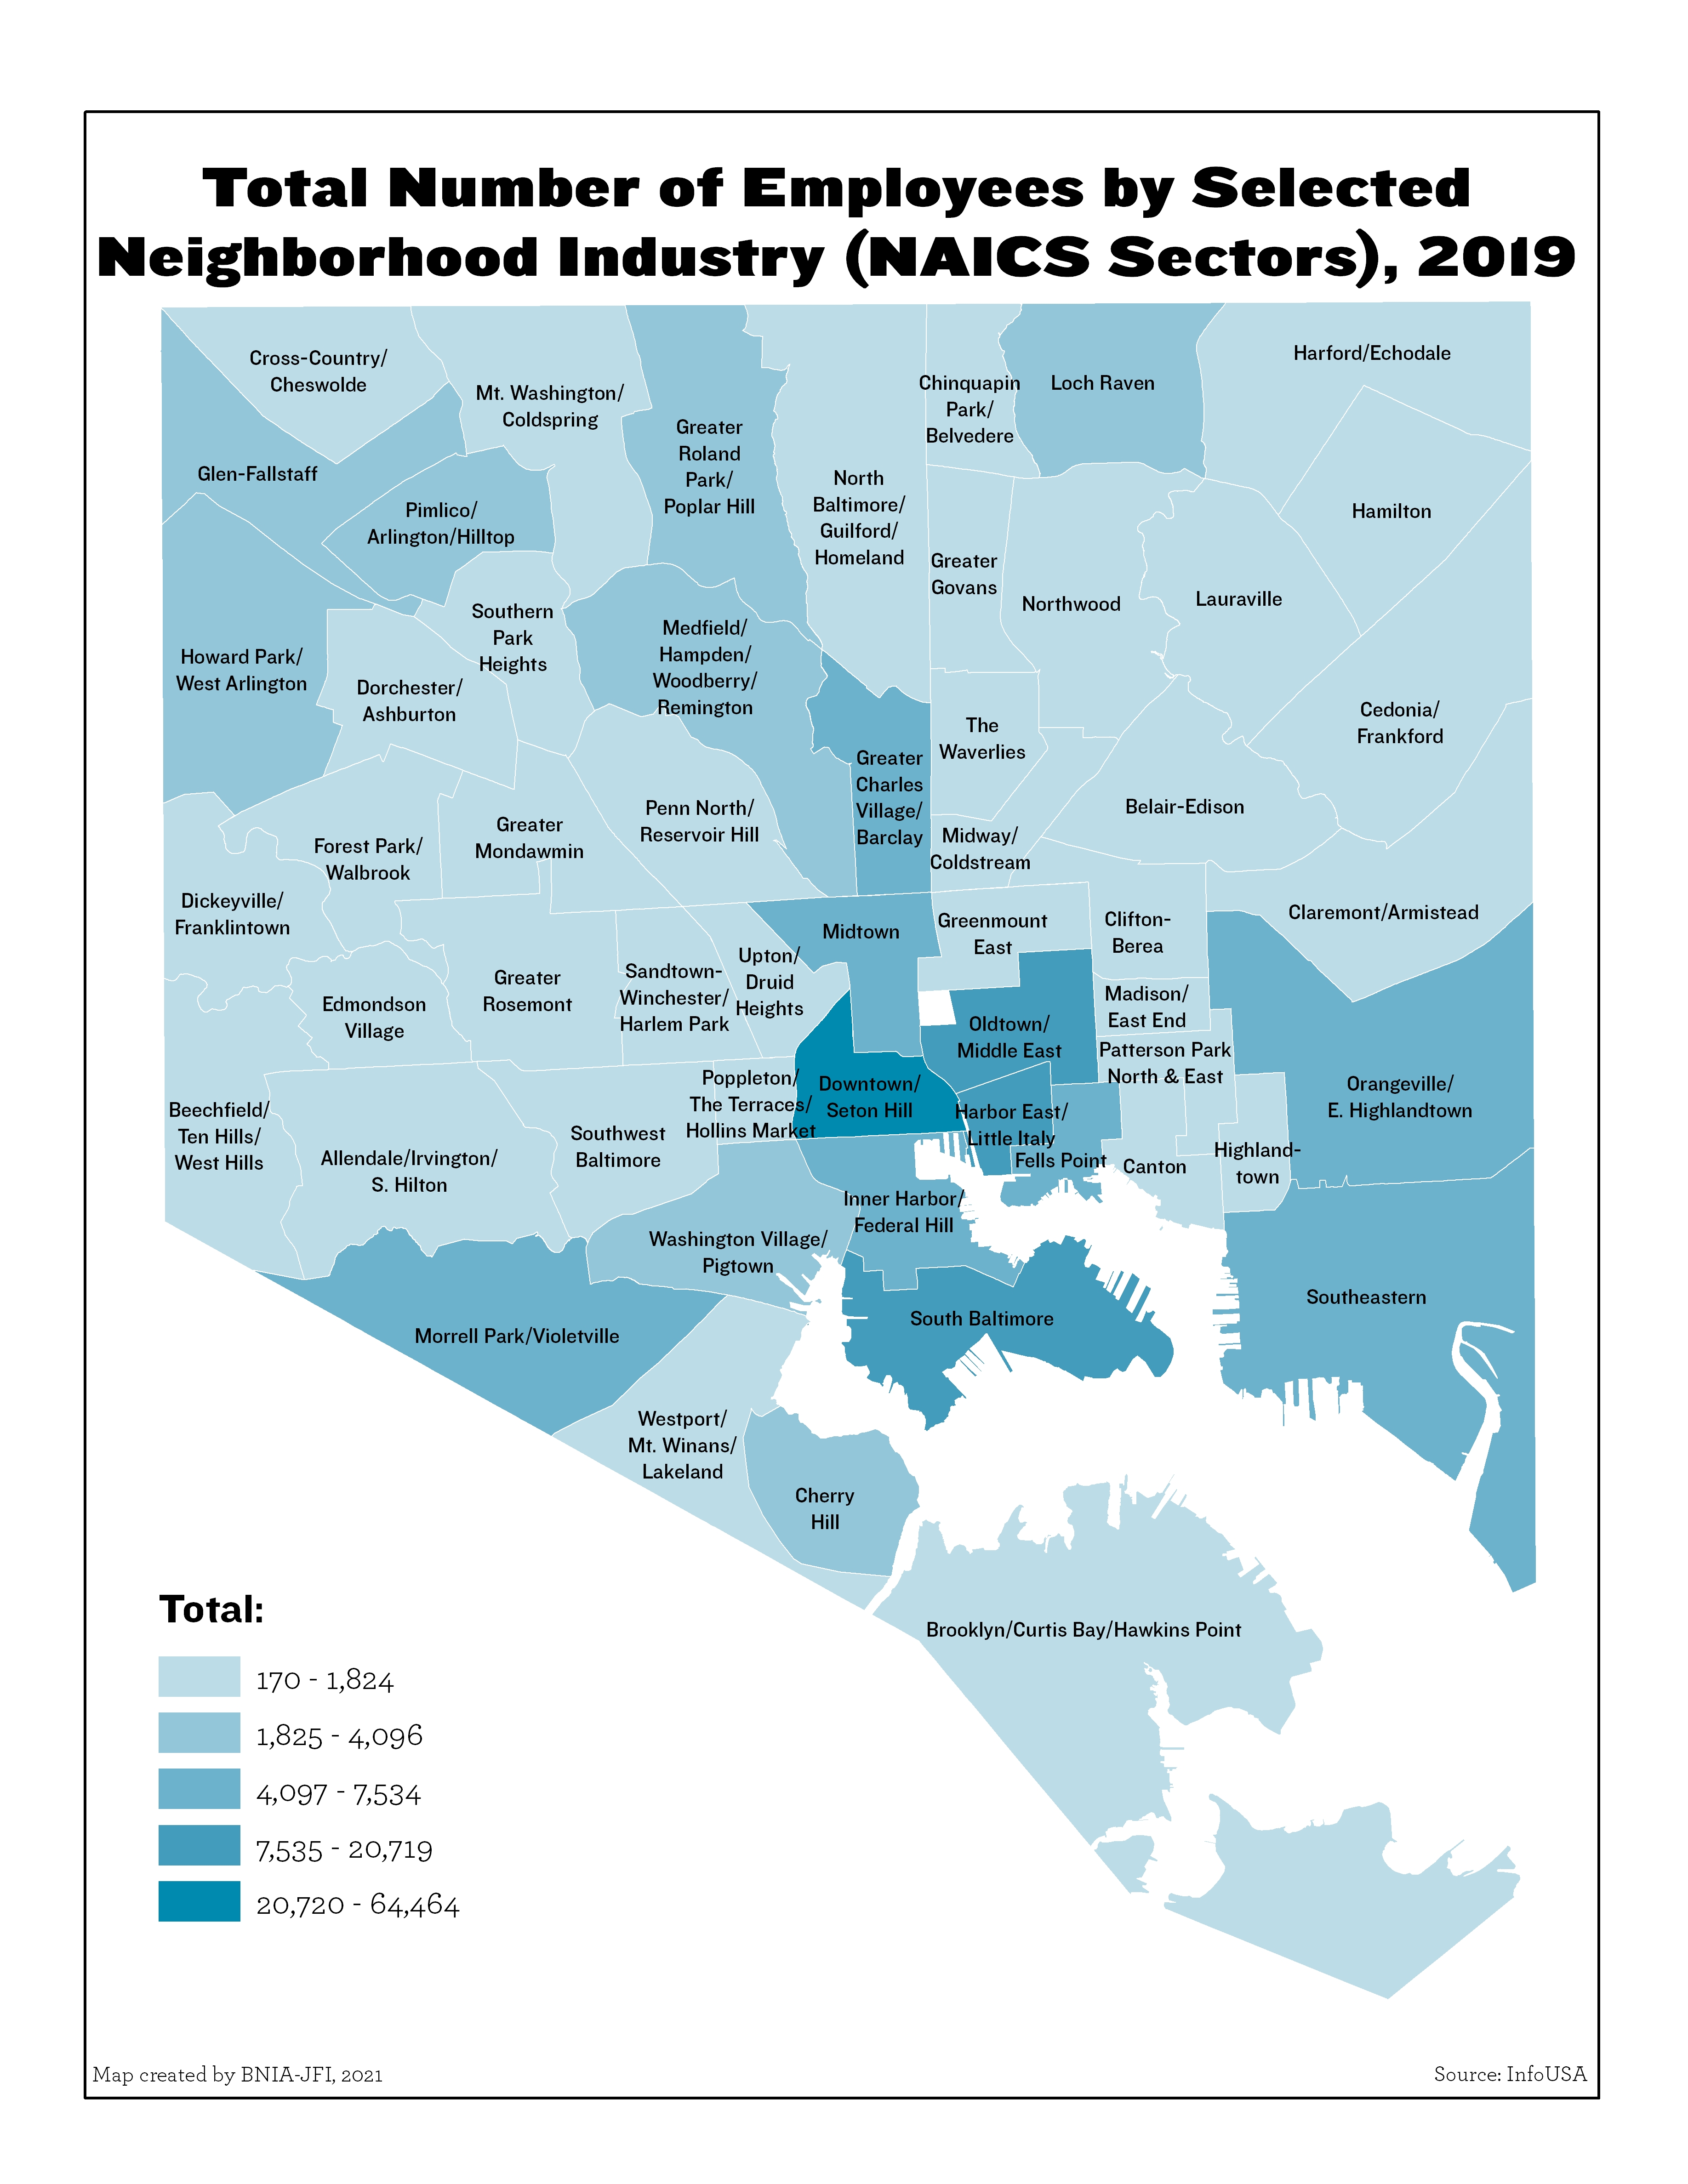
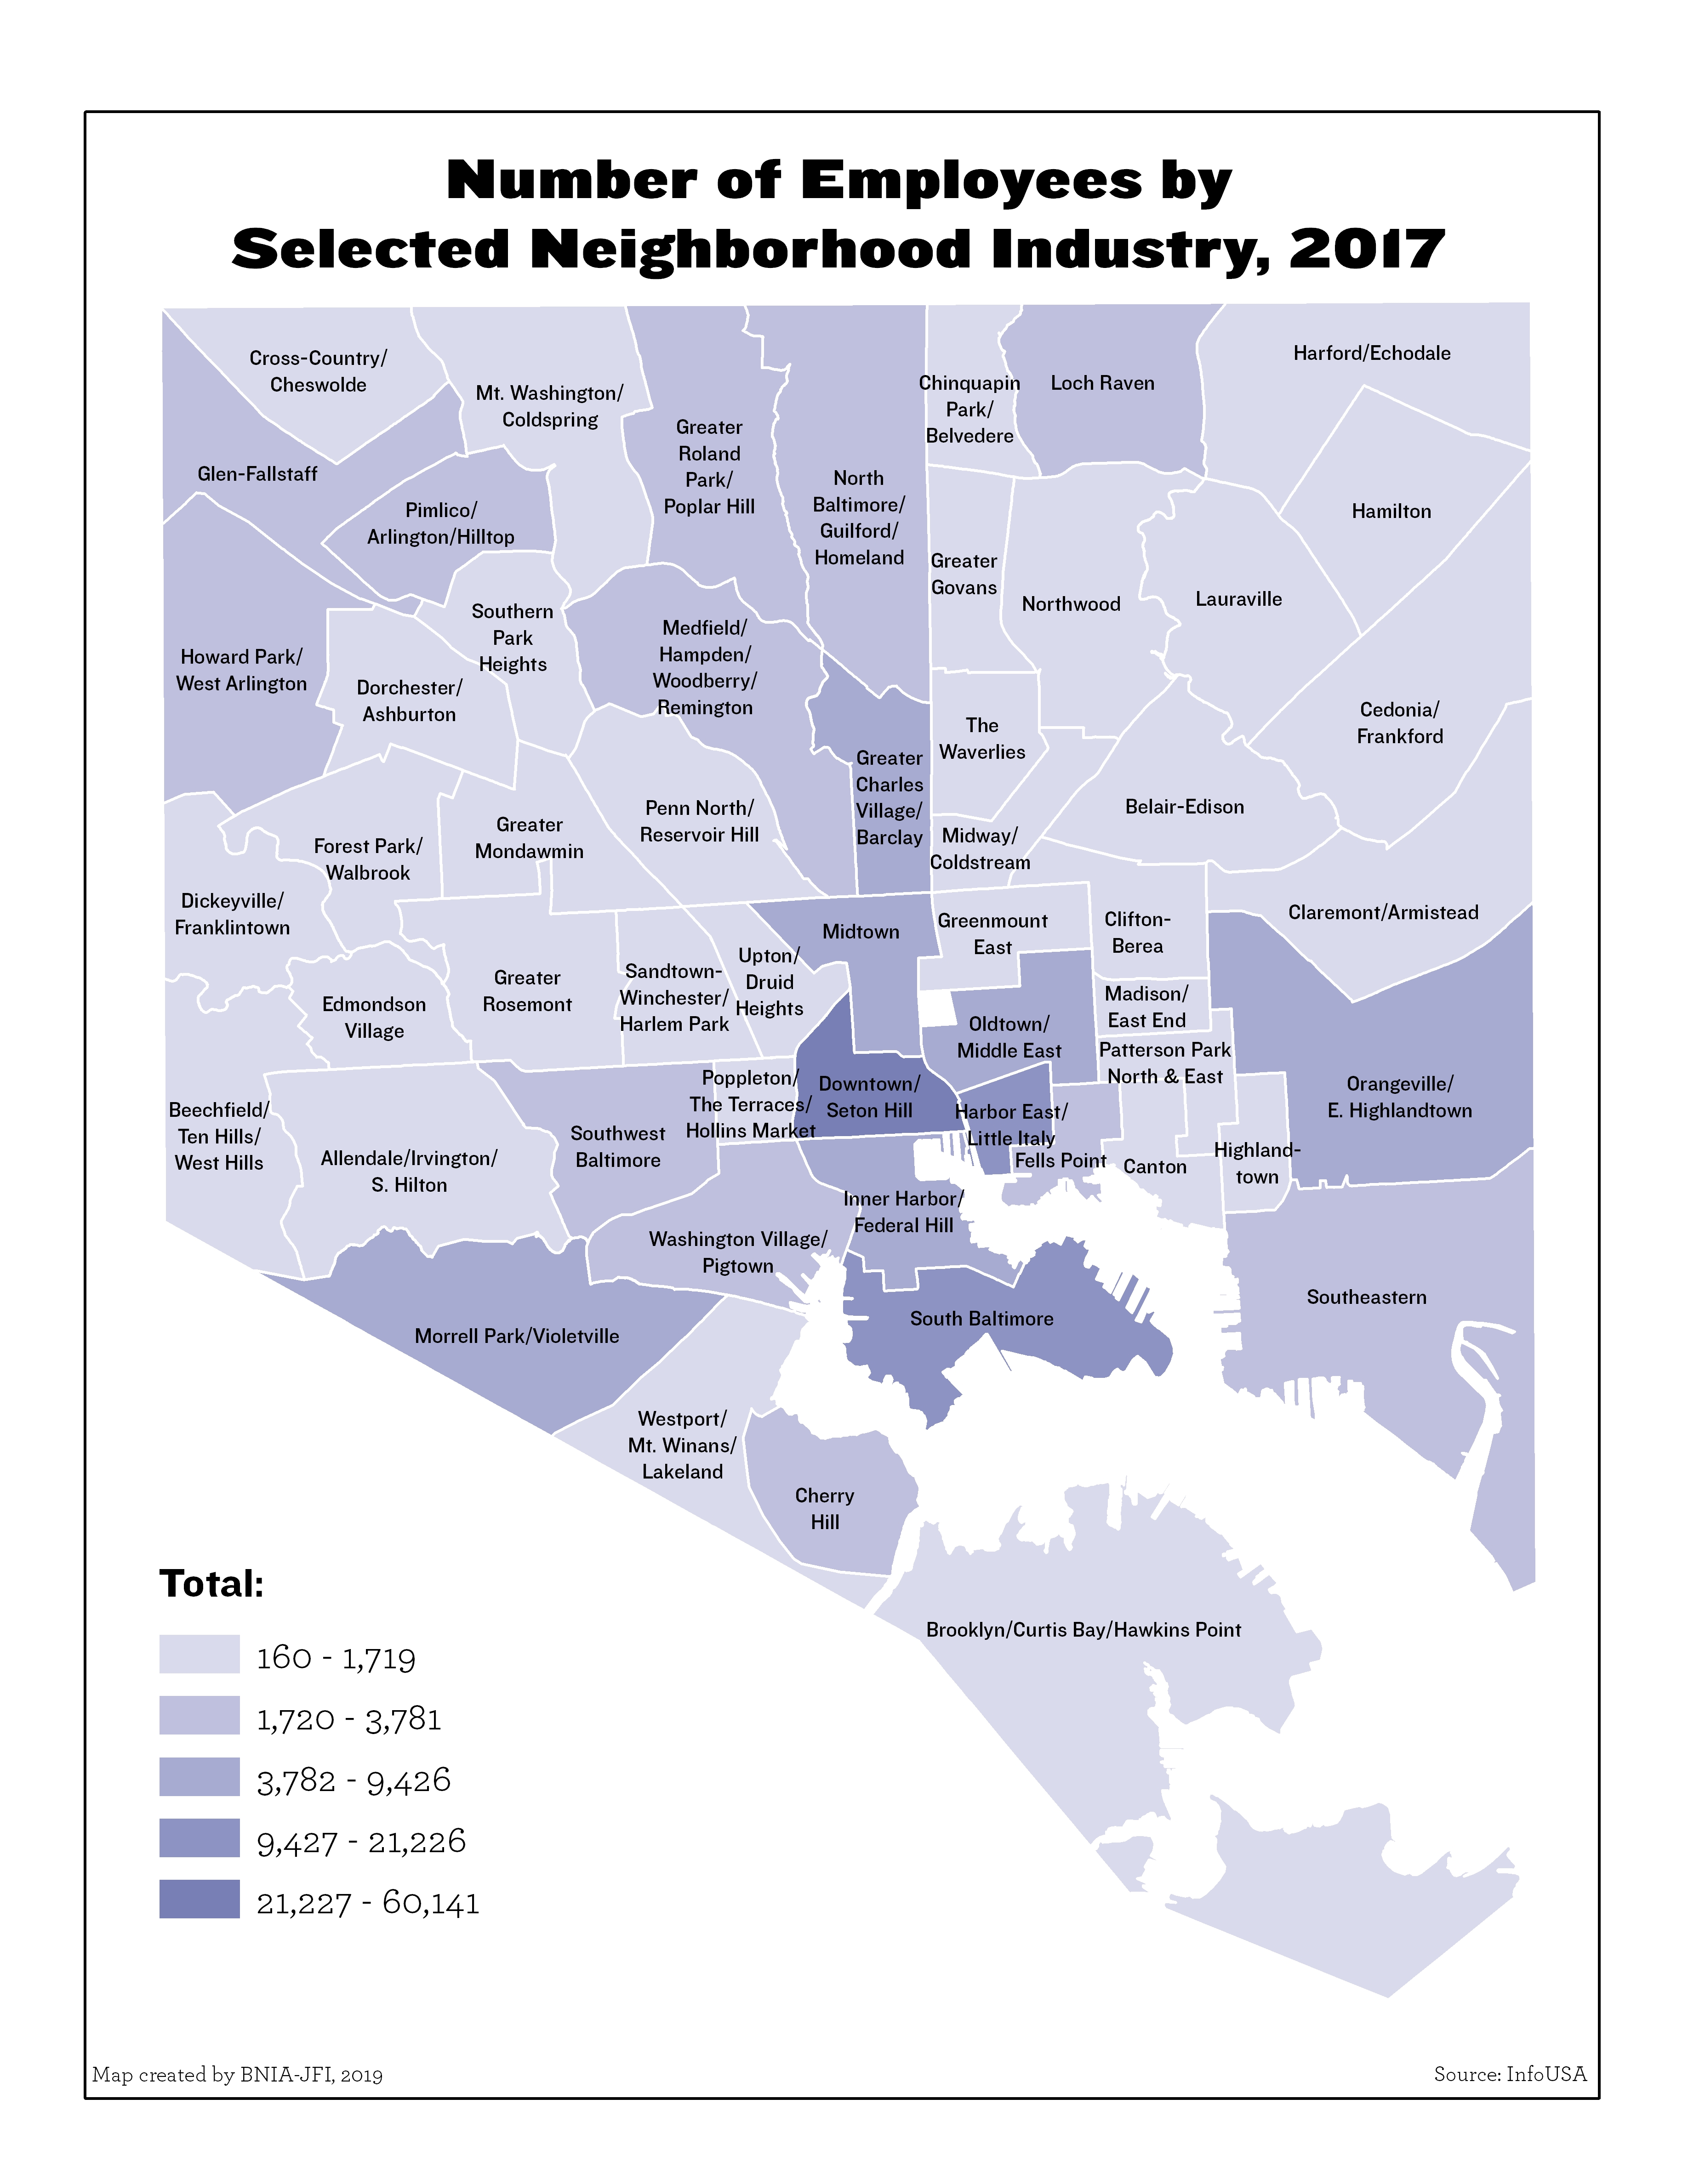
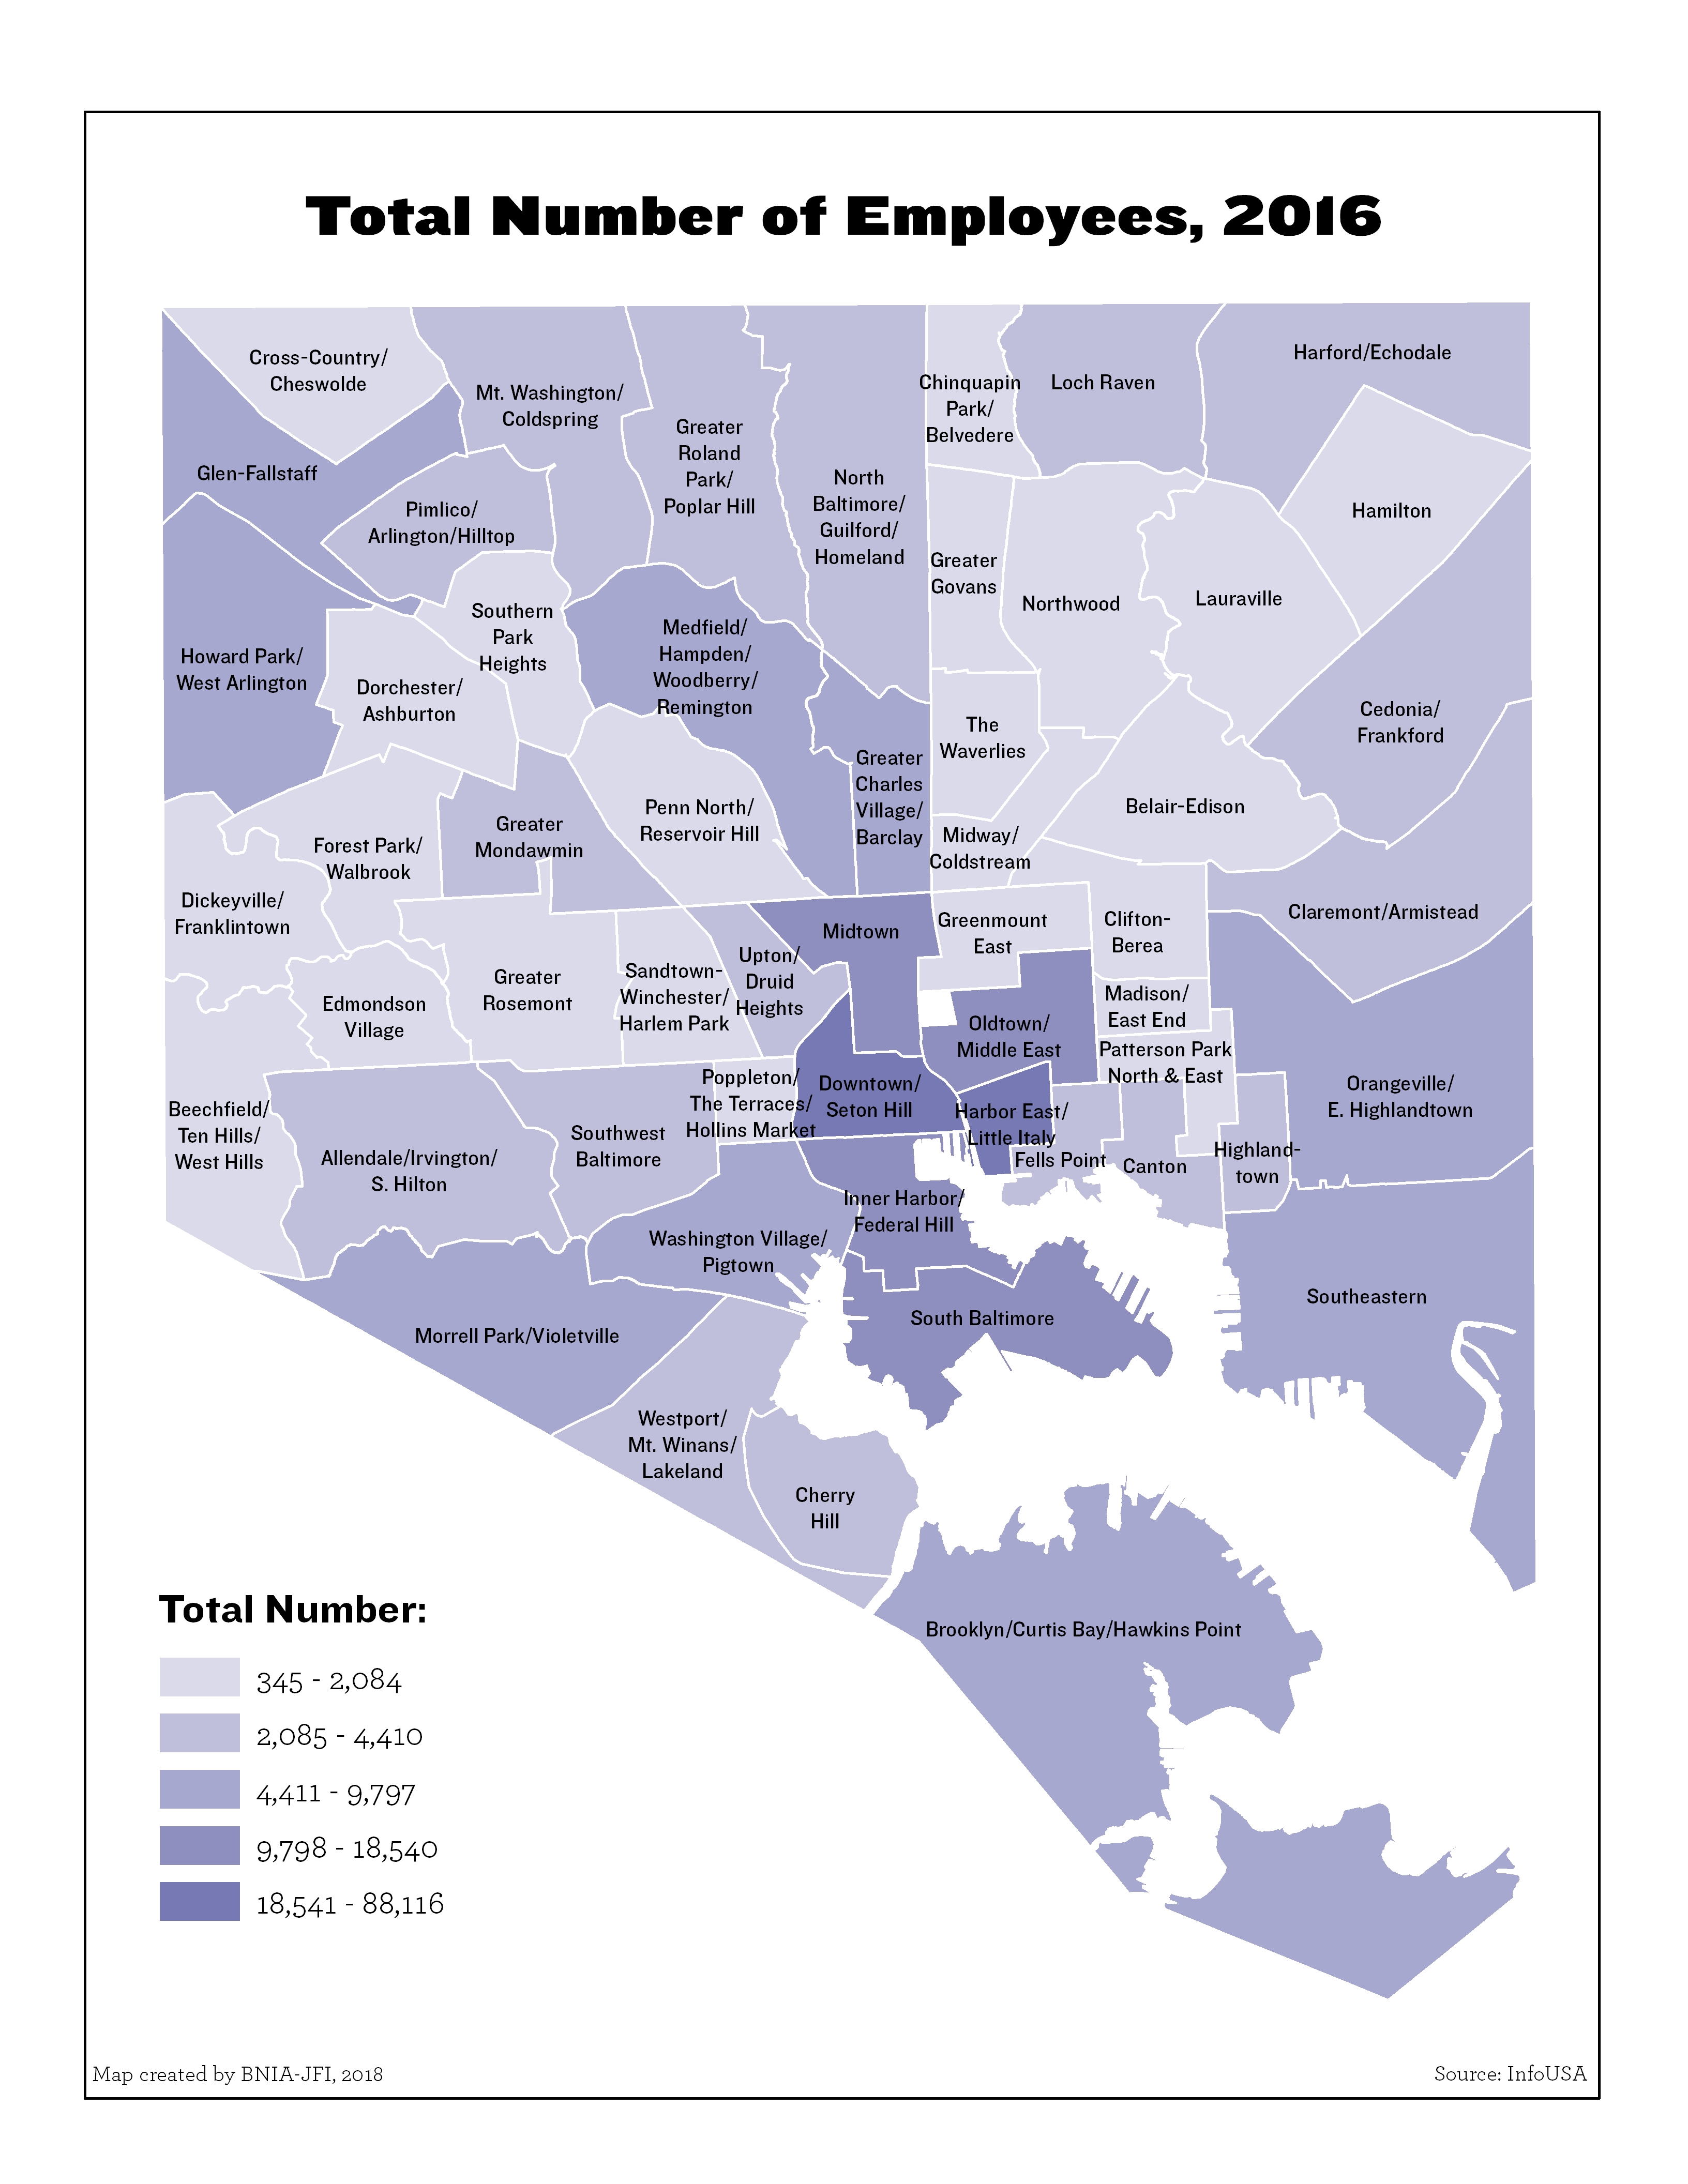
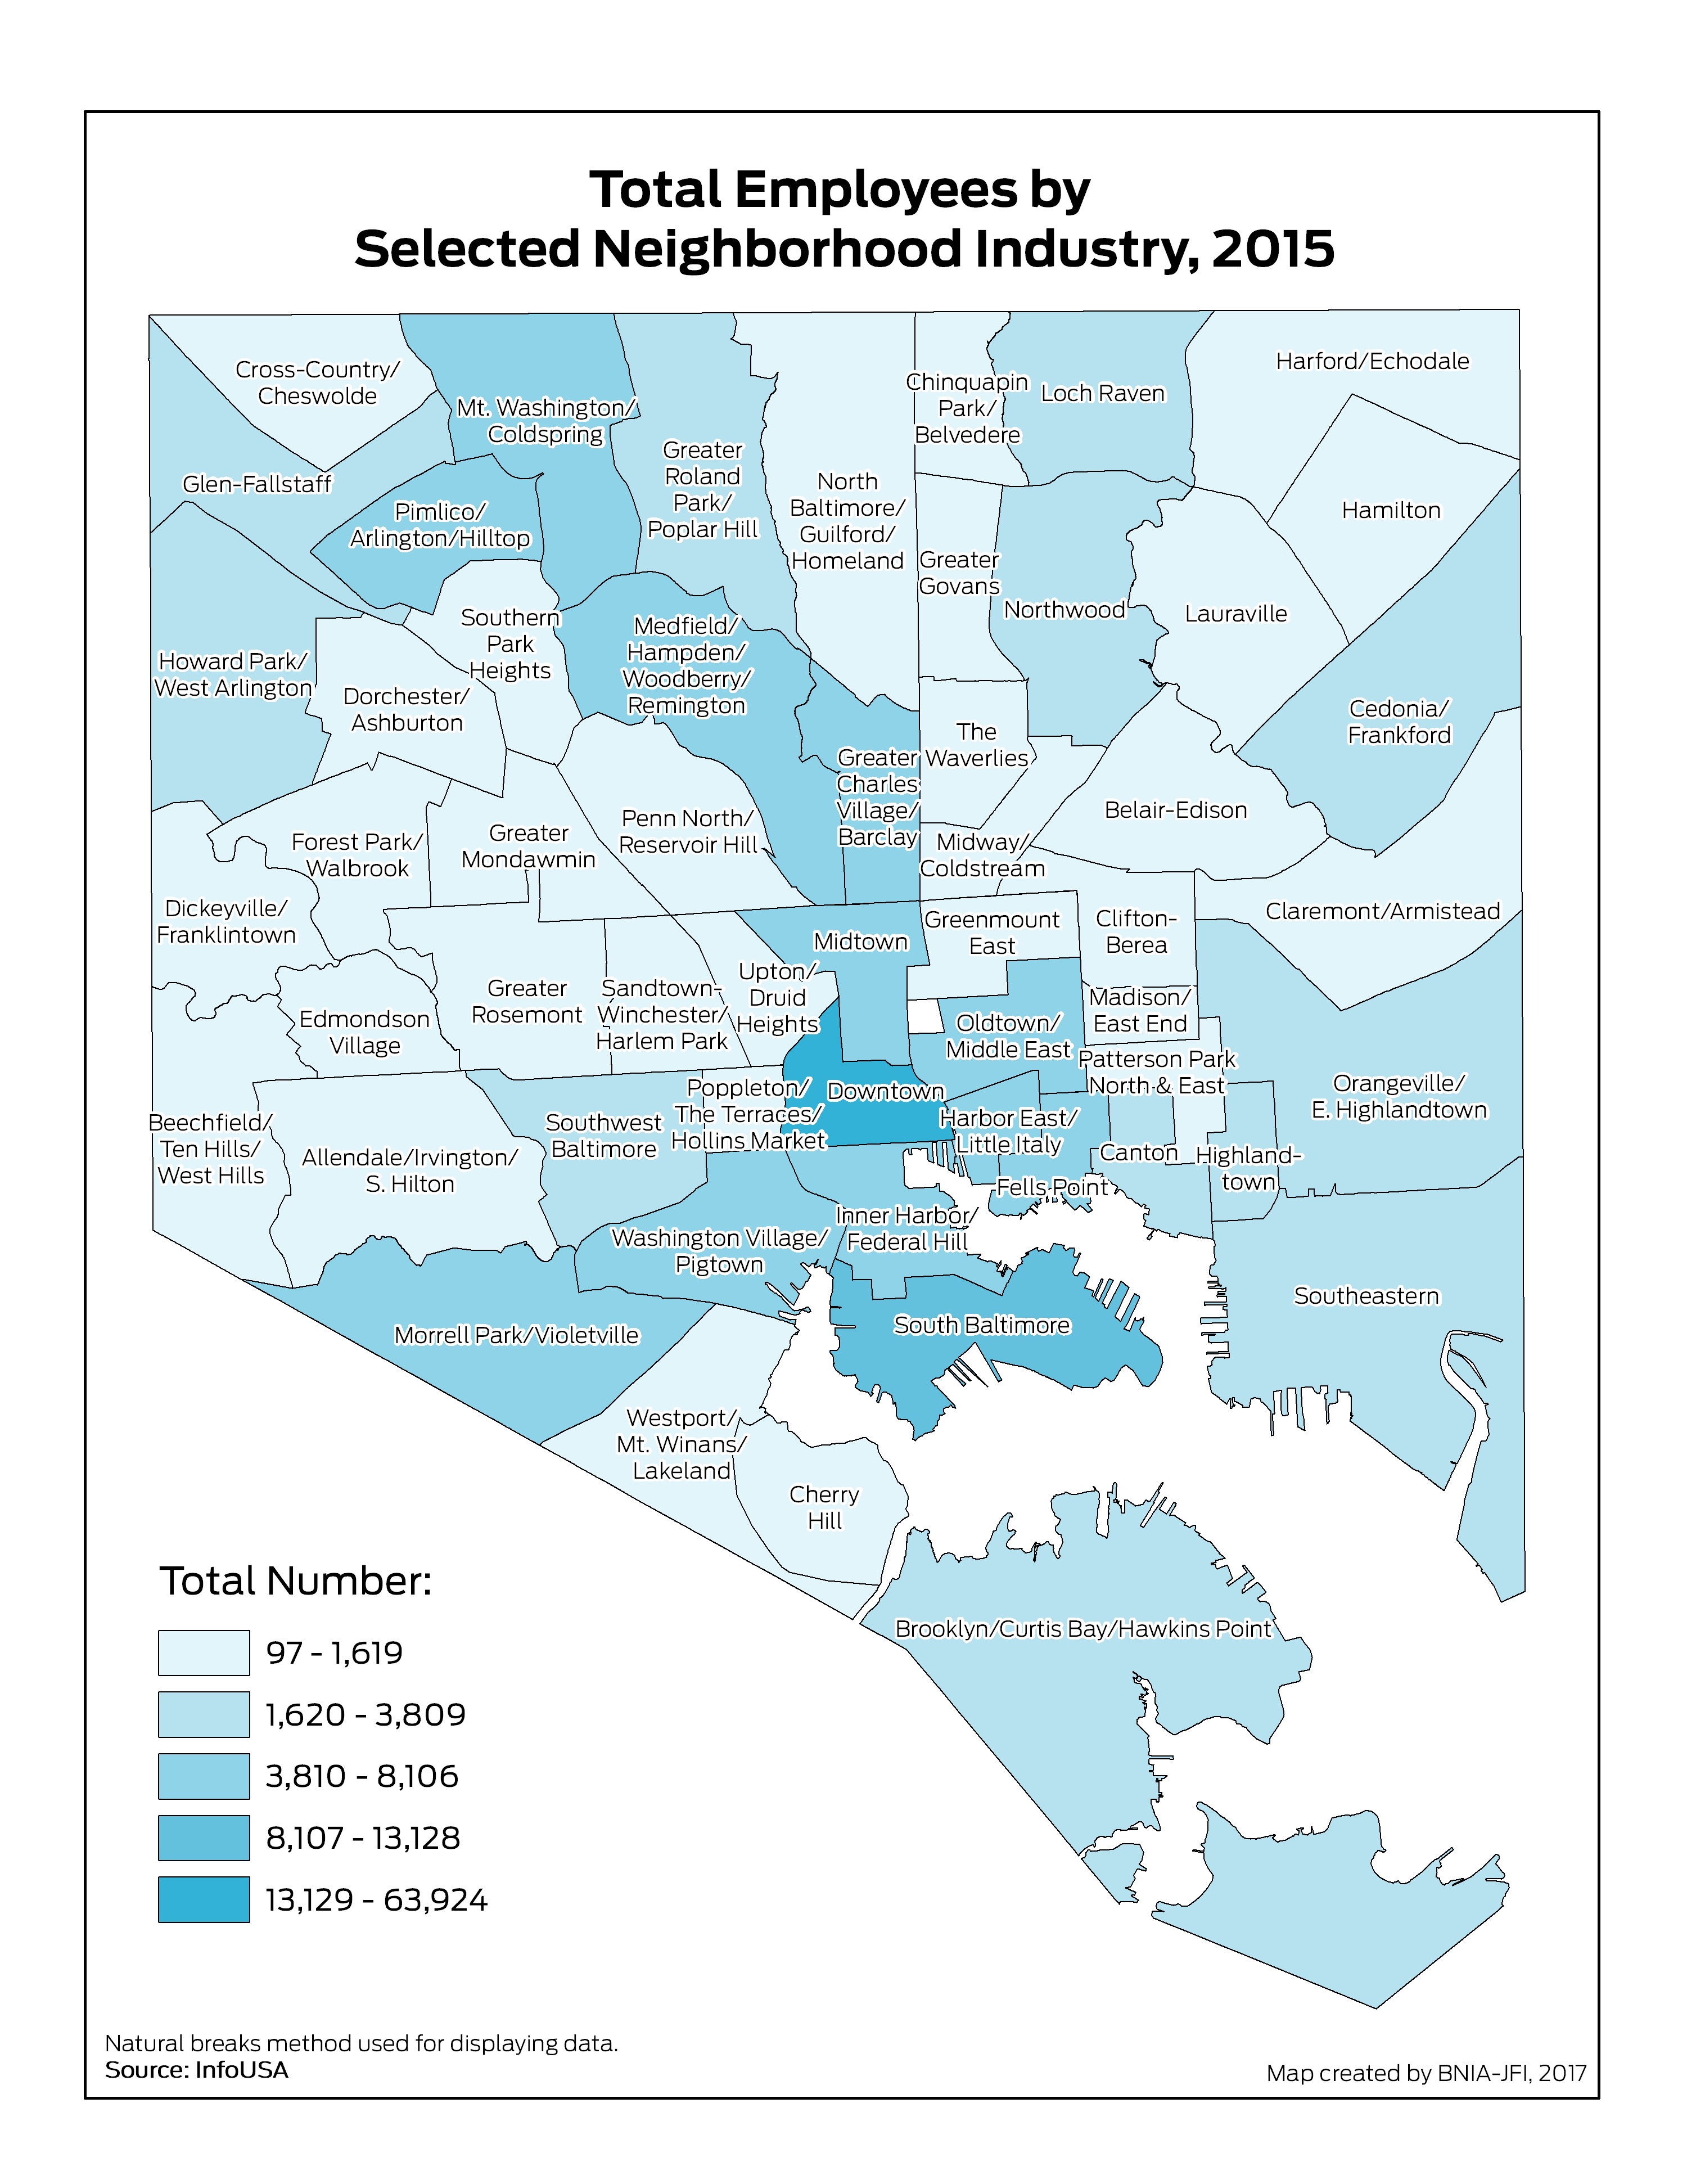
Total number of Employees by Selected Neighborhood Industry (NAICS Sectors)
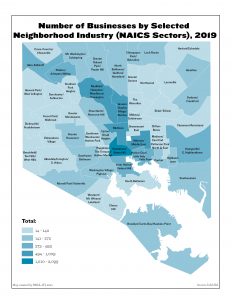
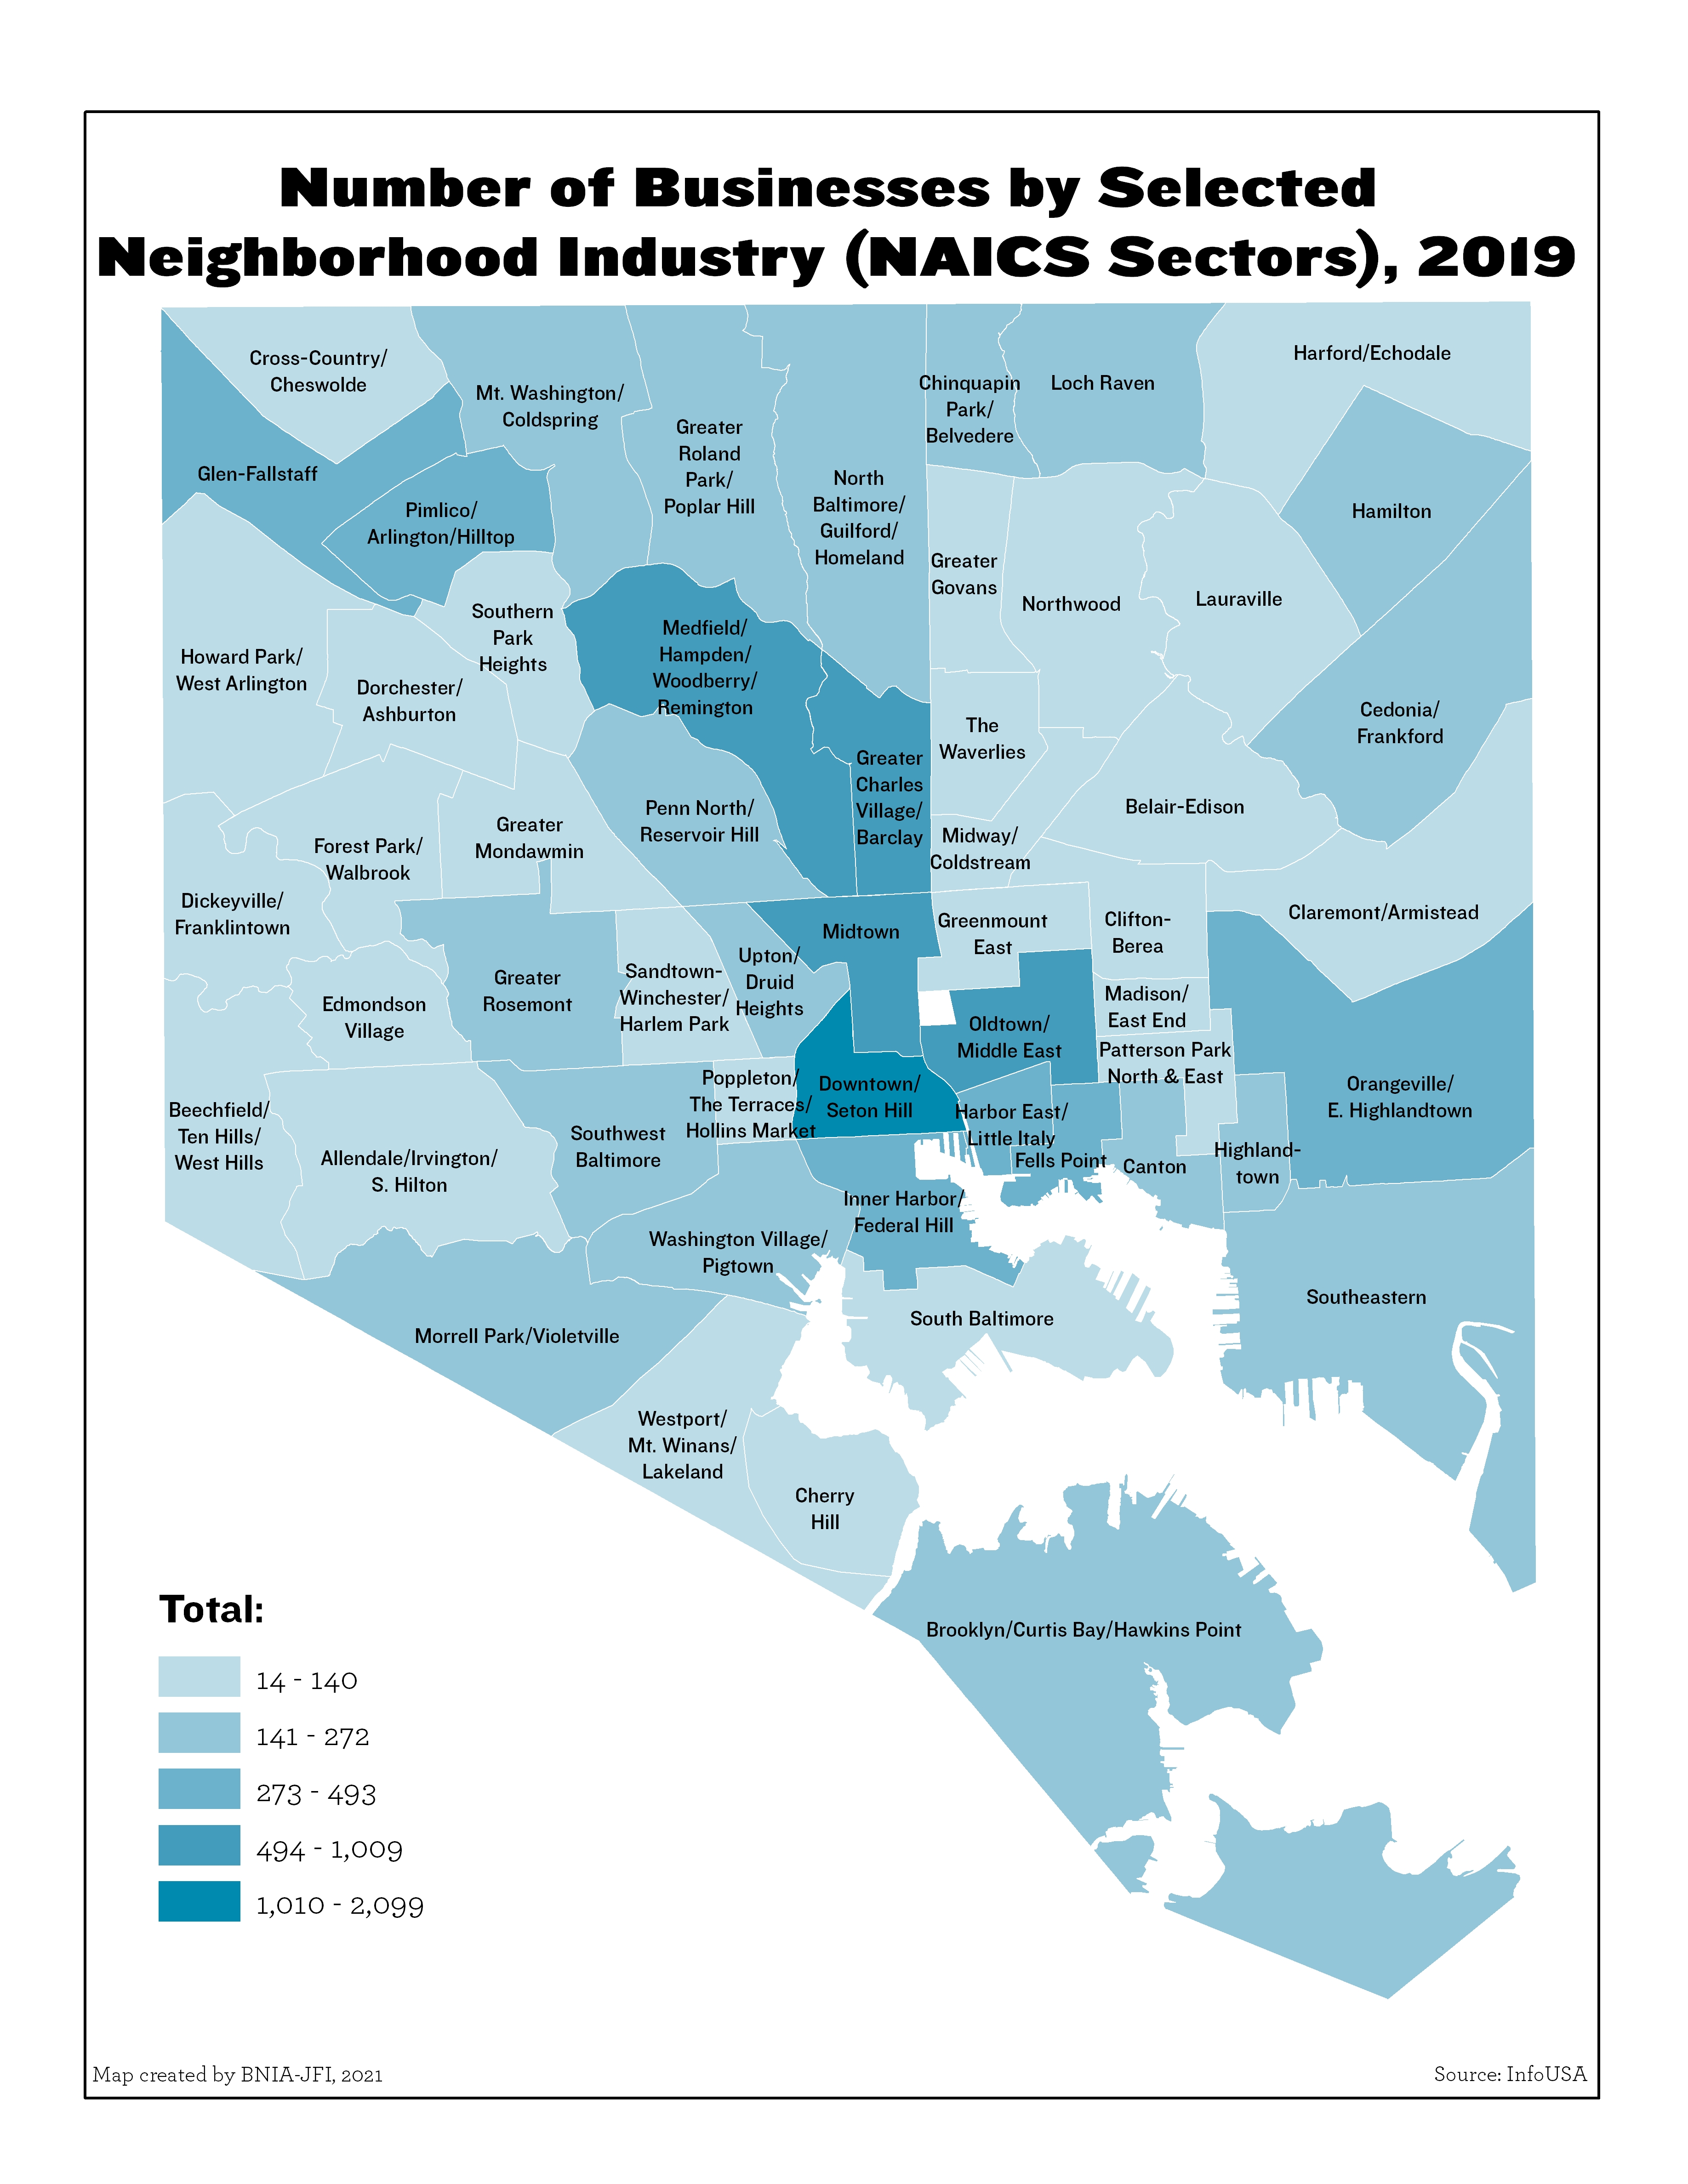
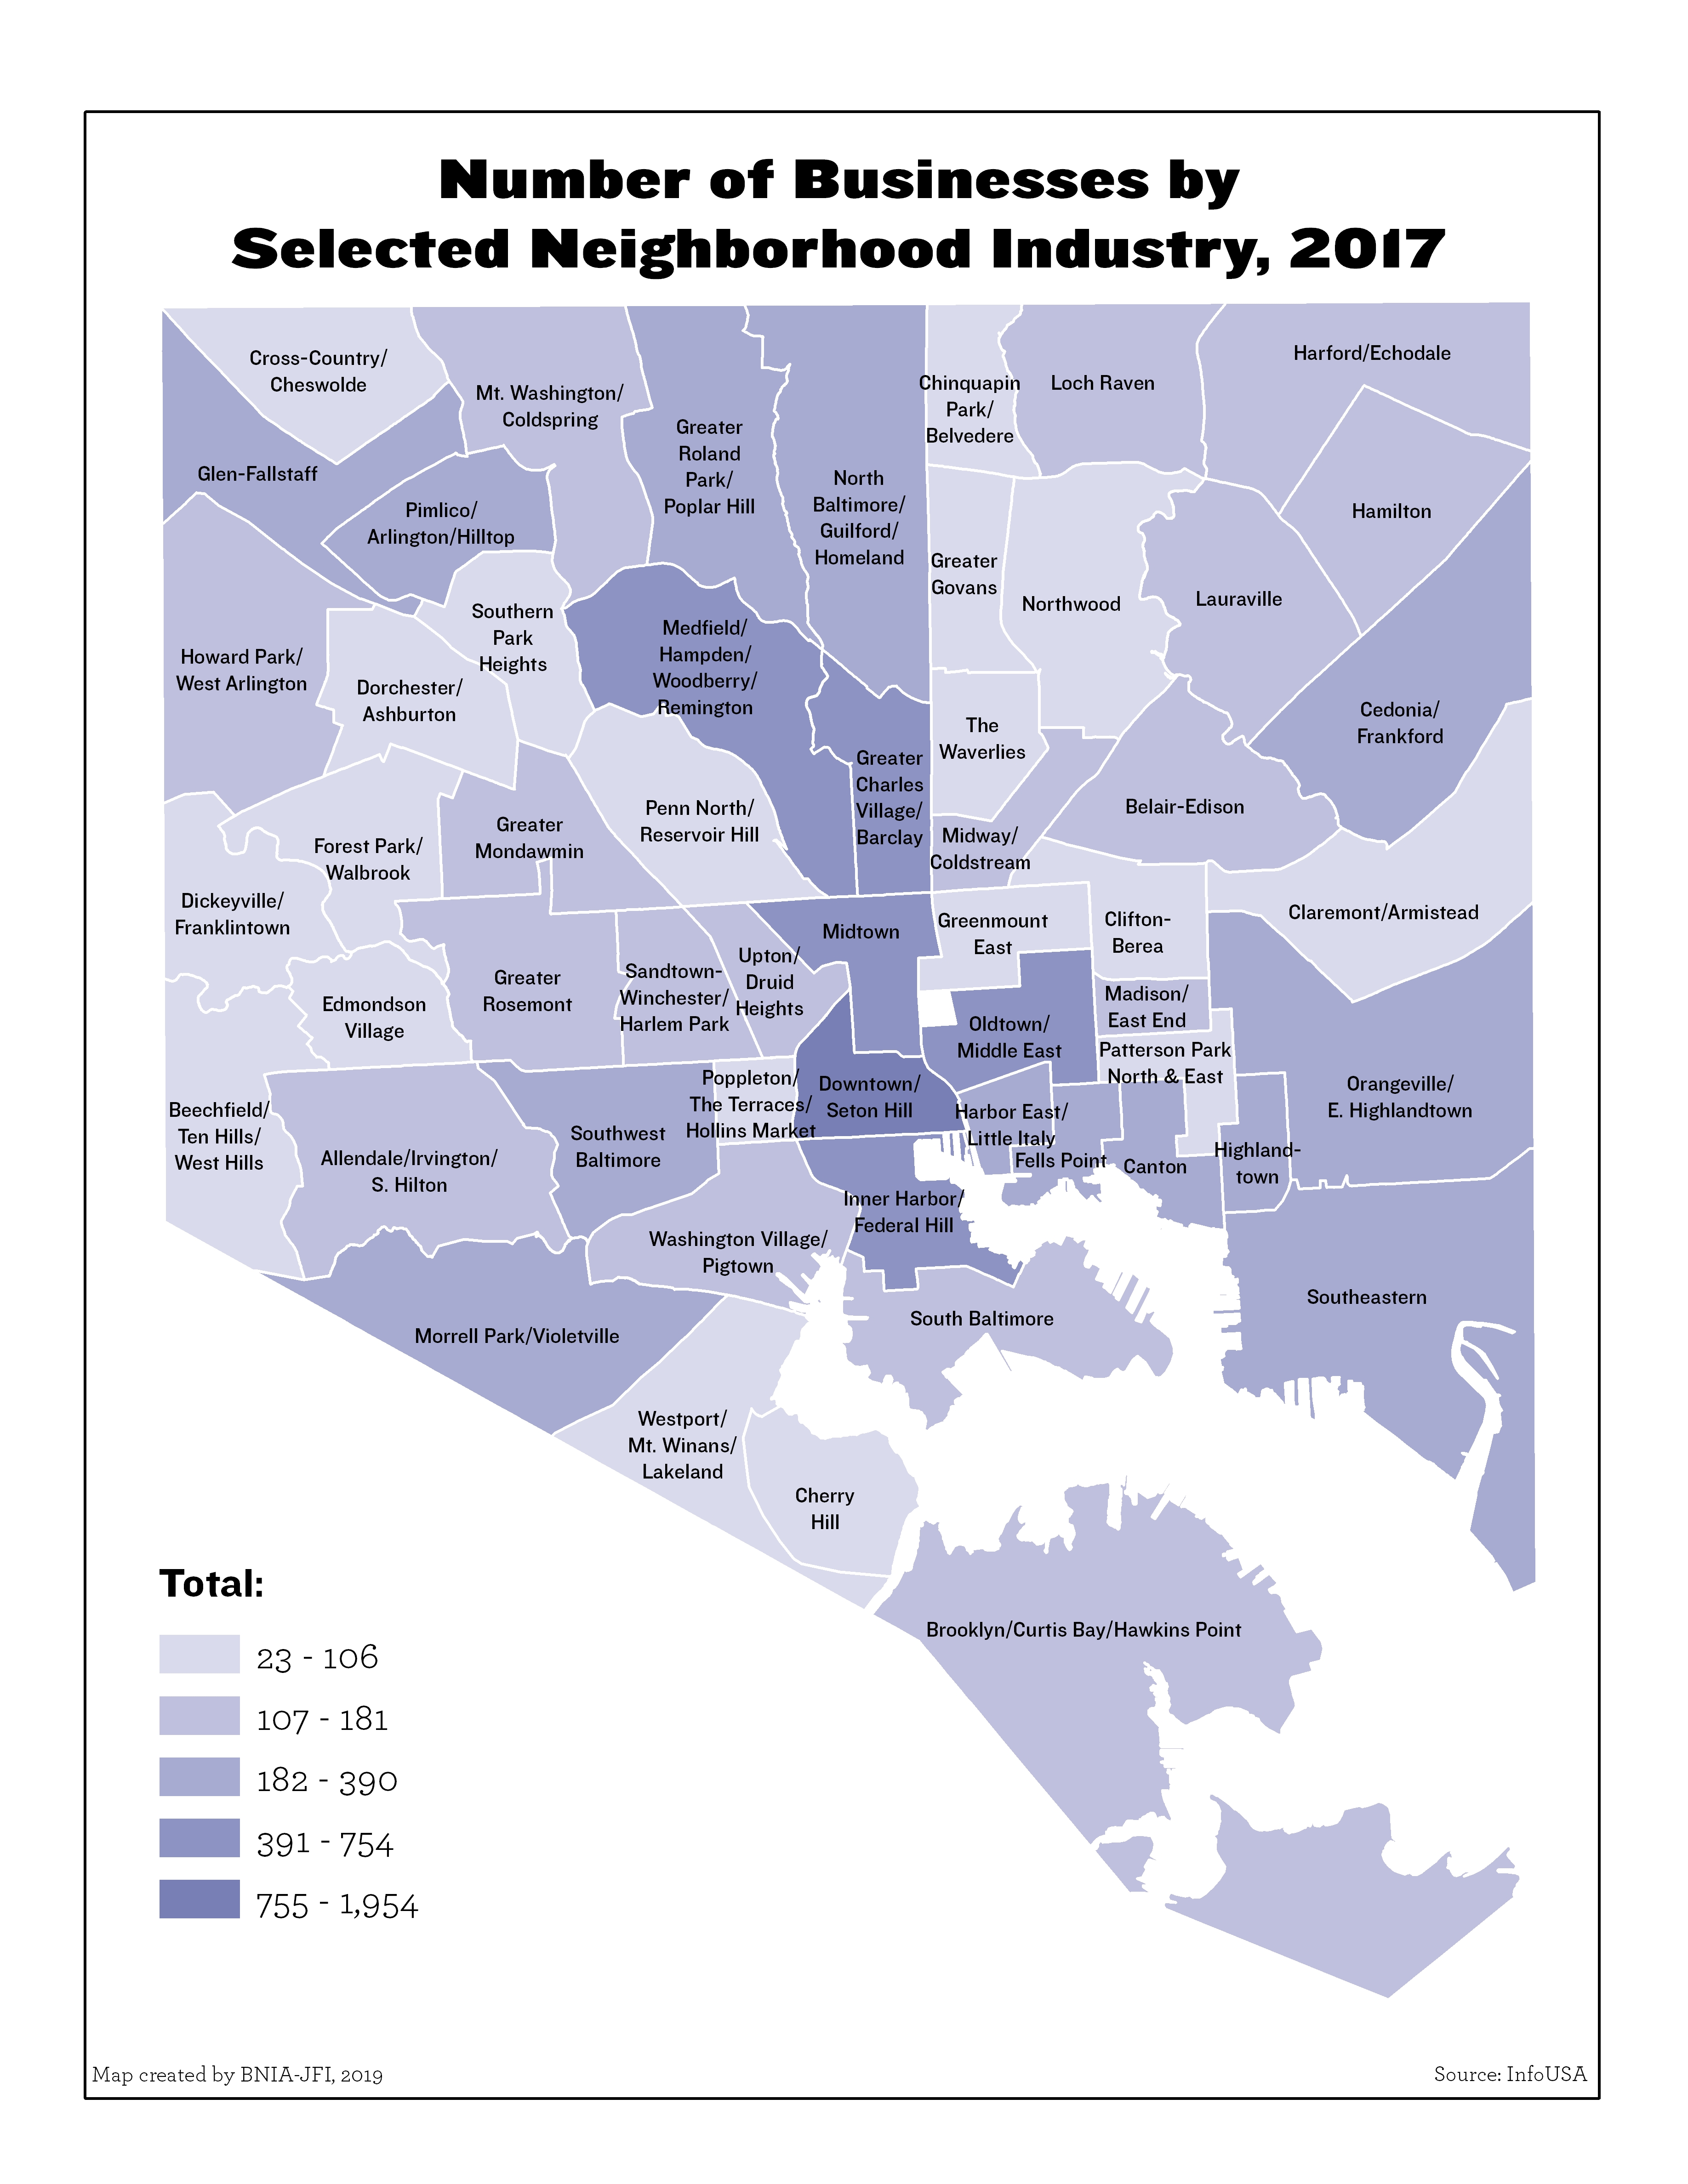
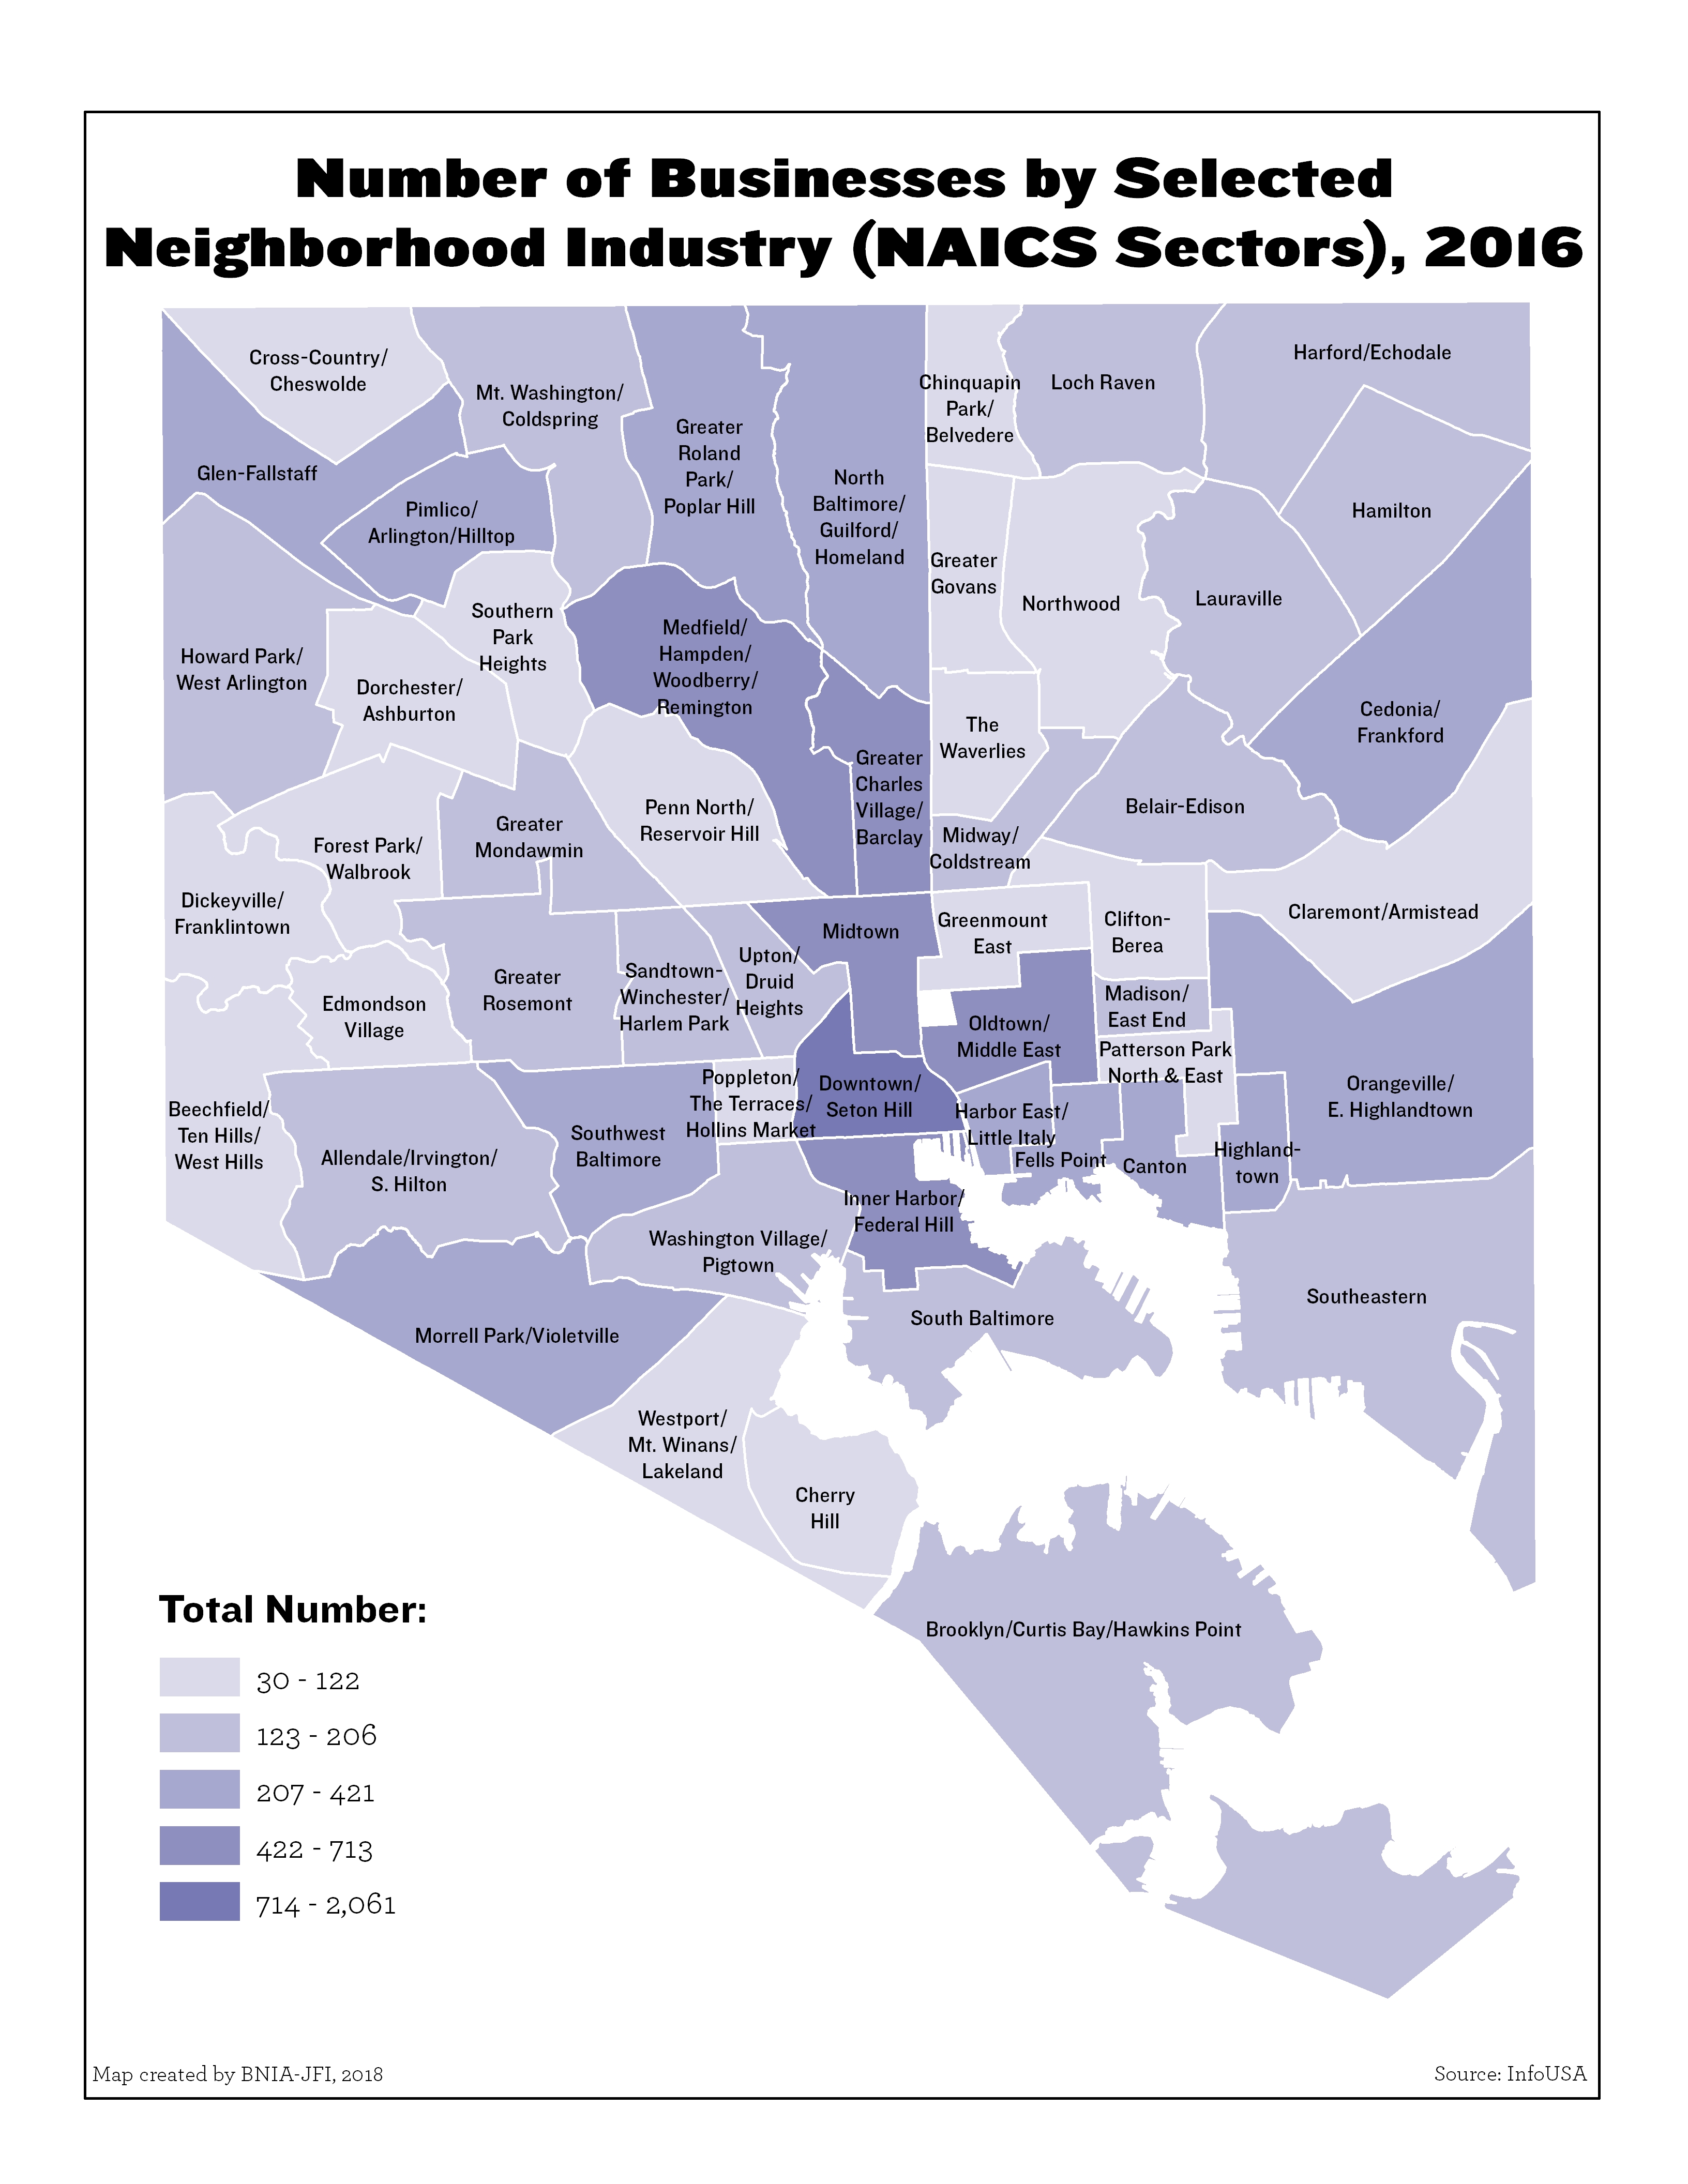
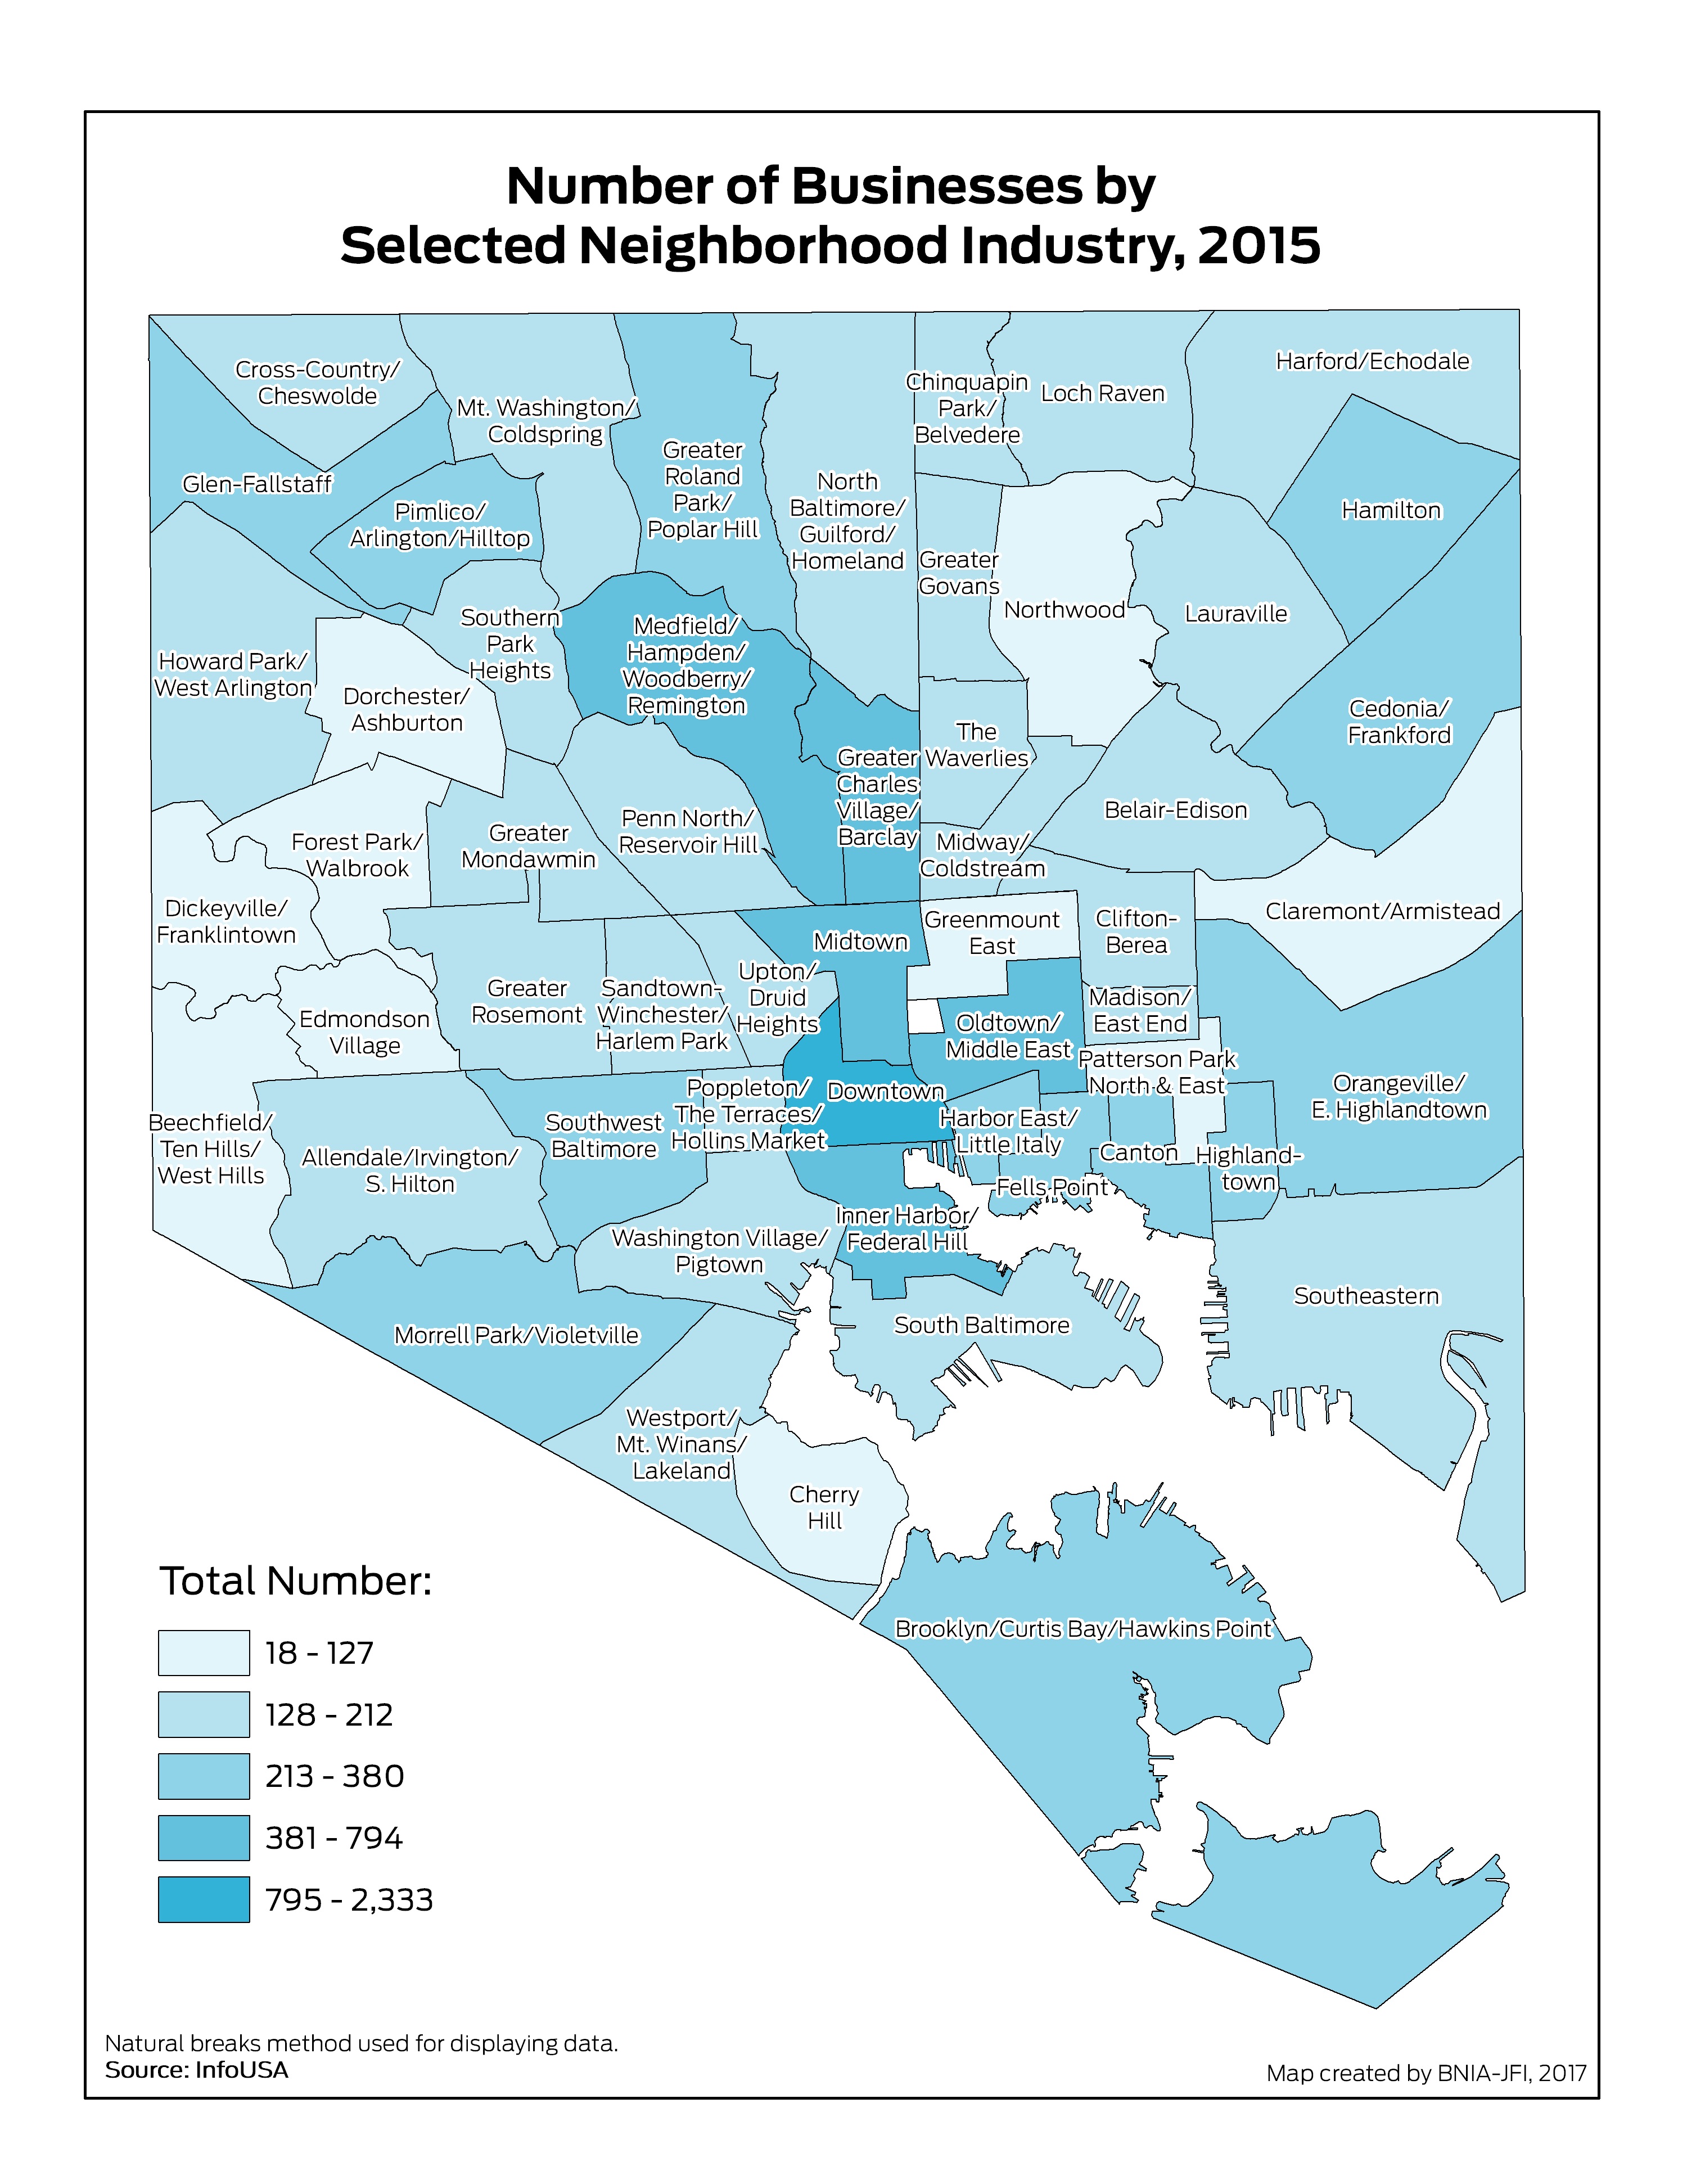
Number of Businesses by Selected Neighborhood Industry (NAICS Sectors)
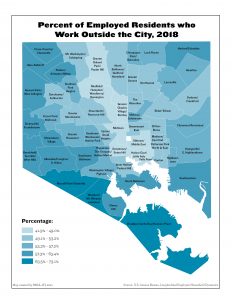
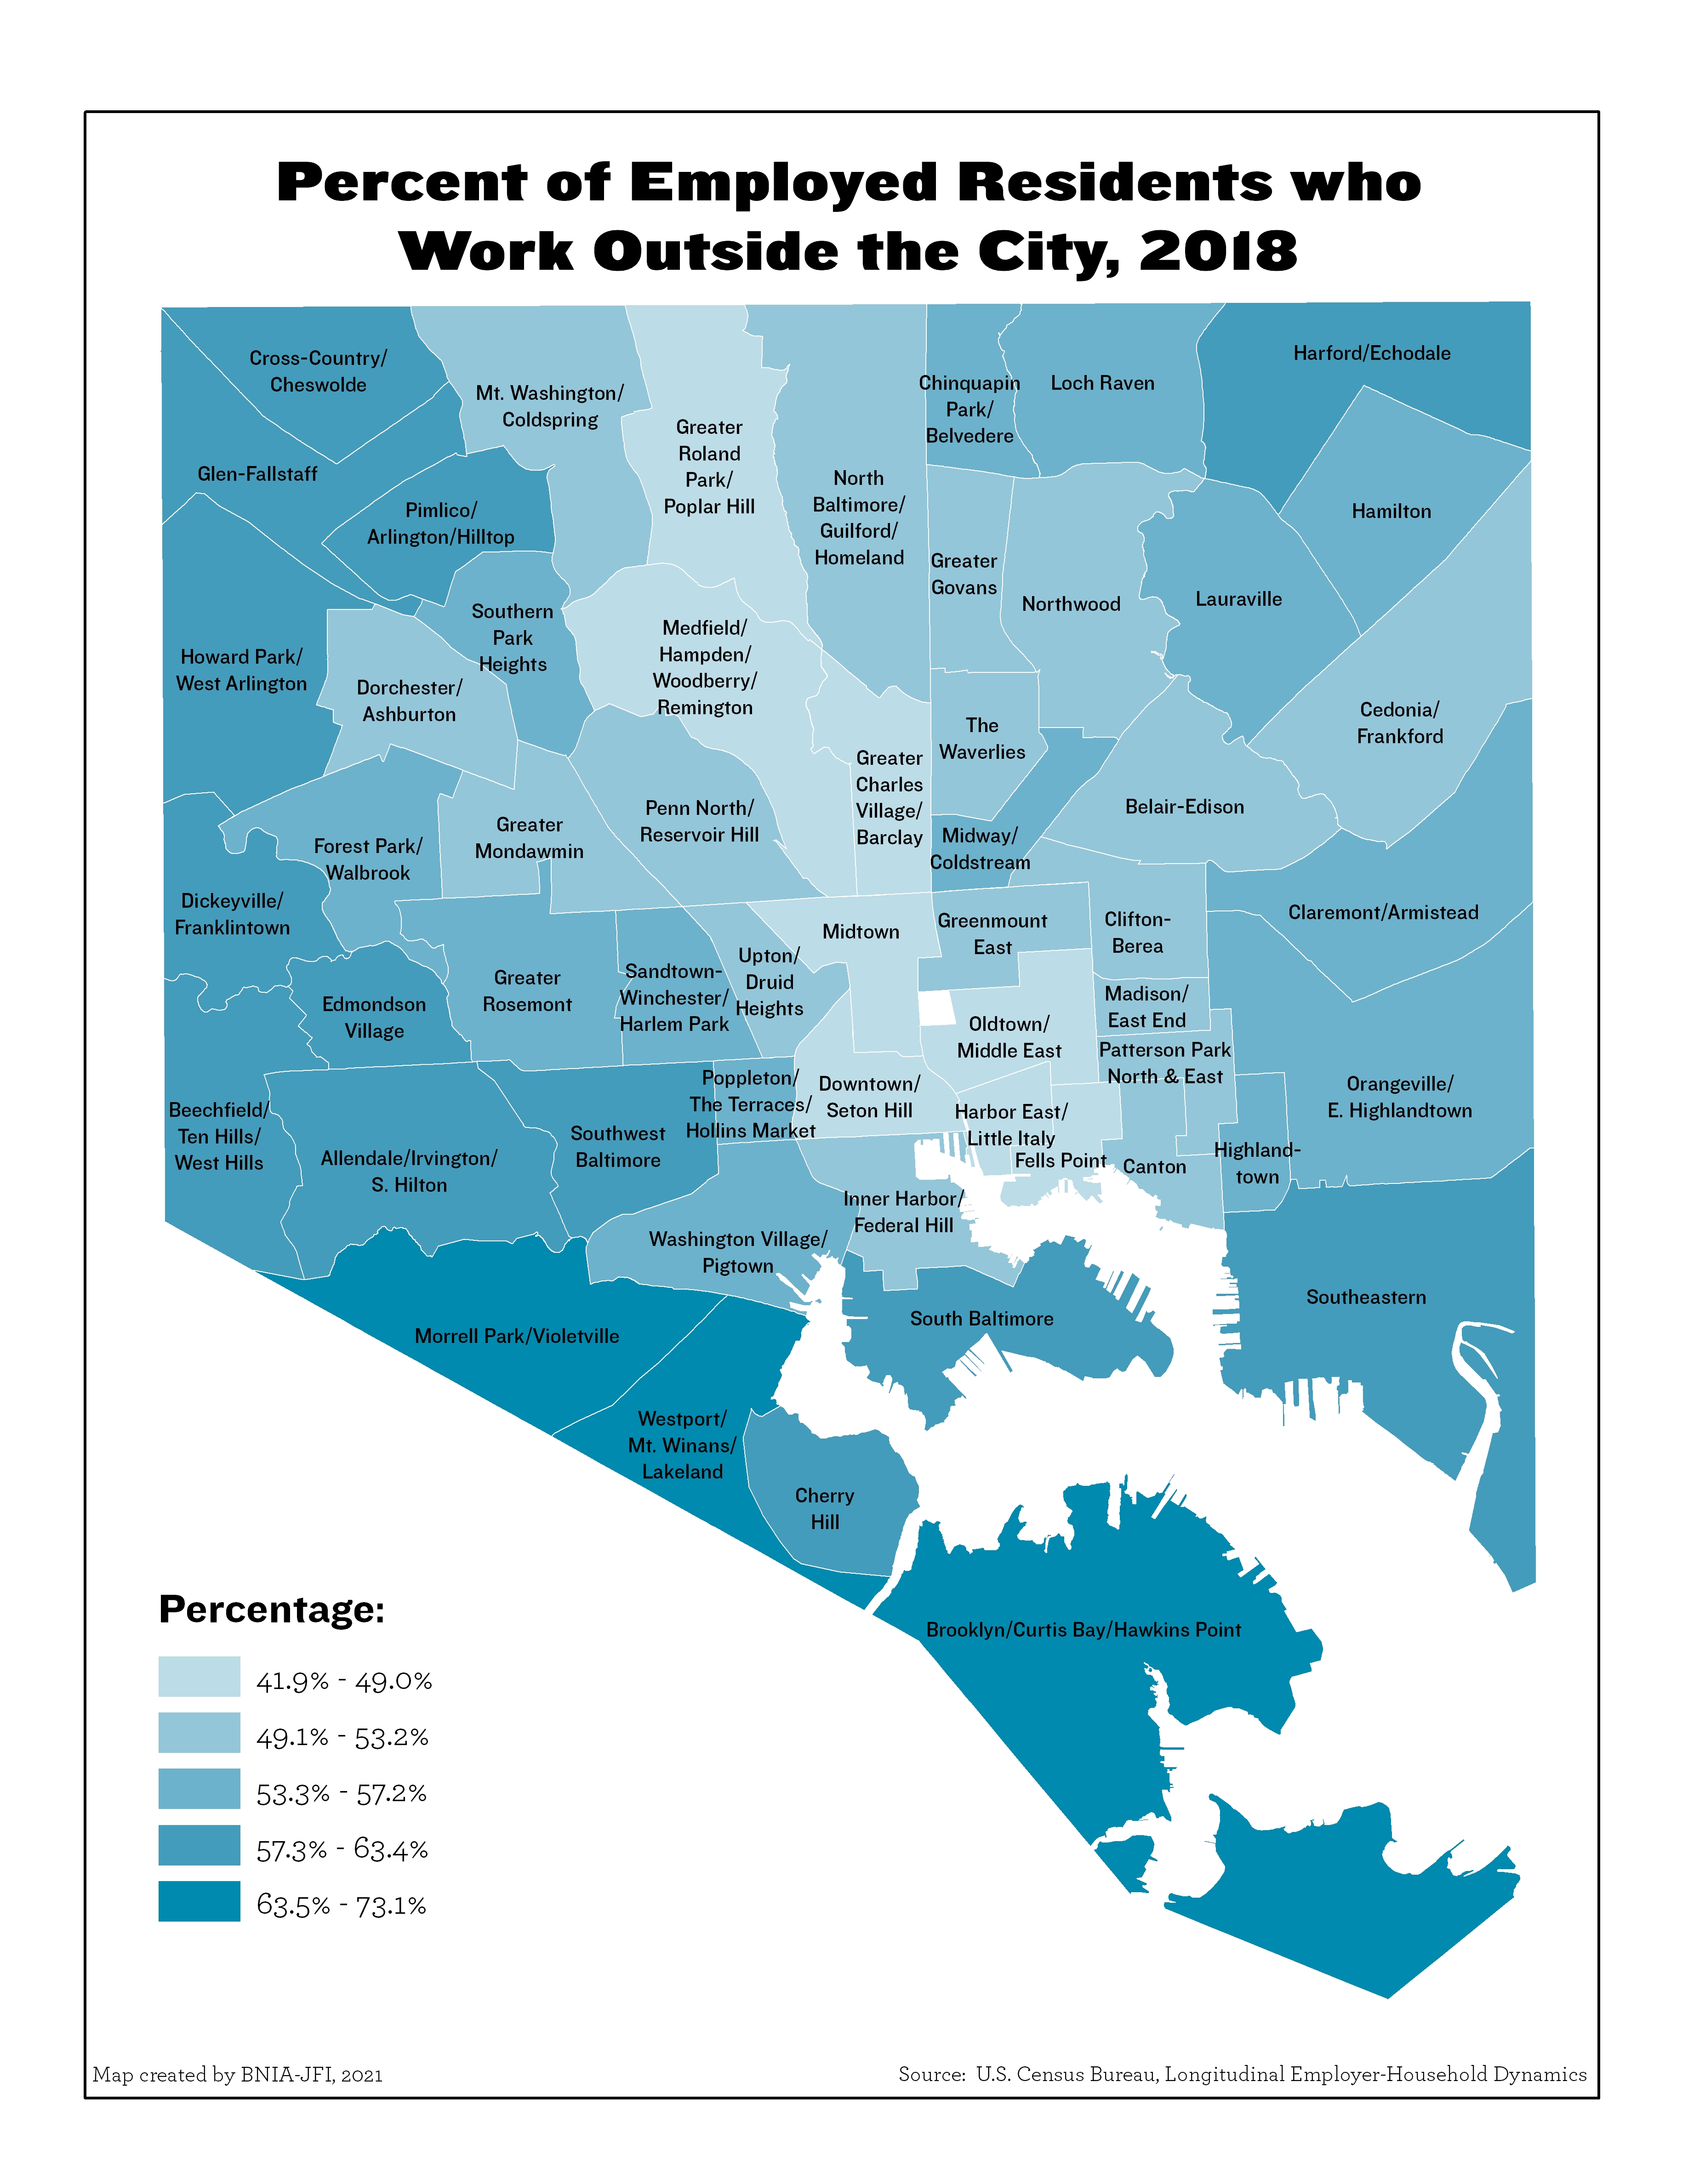
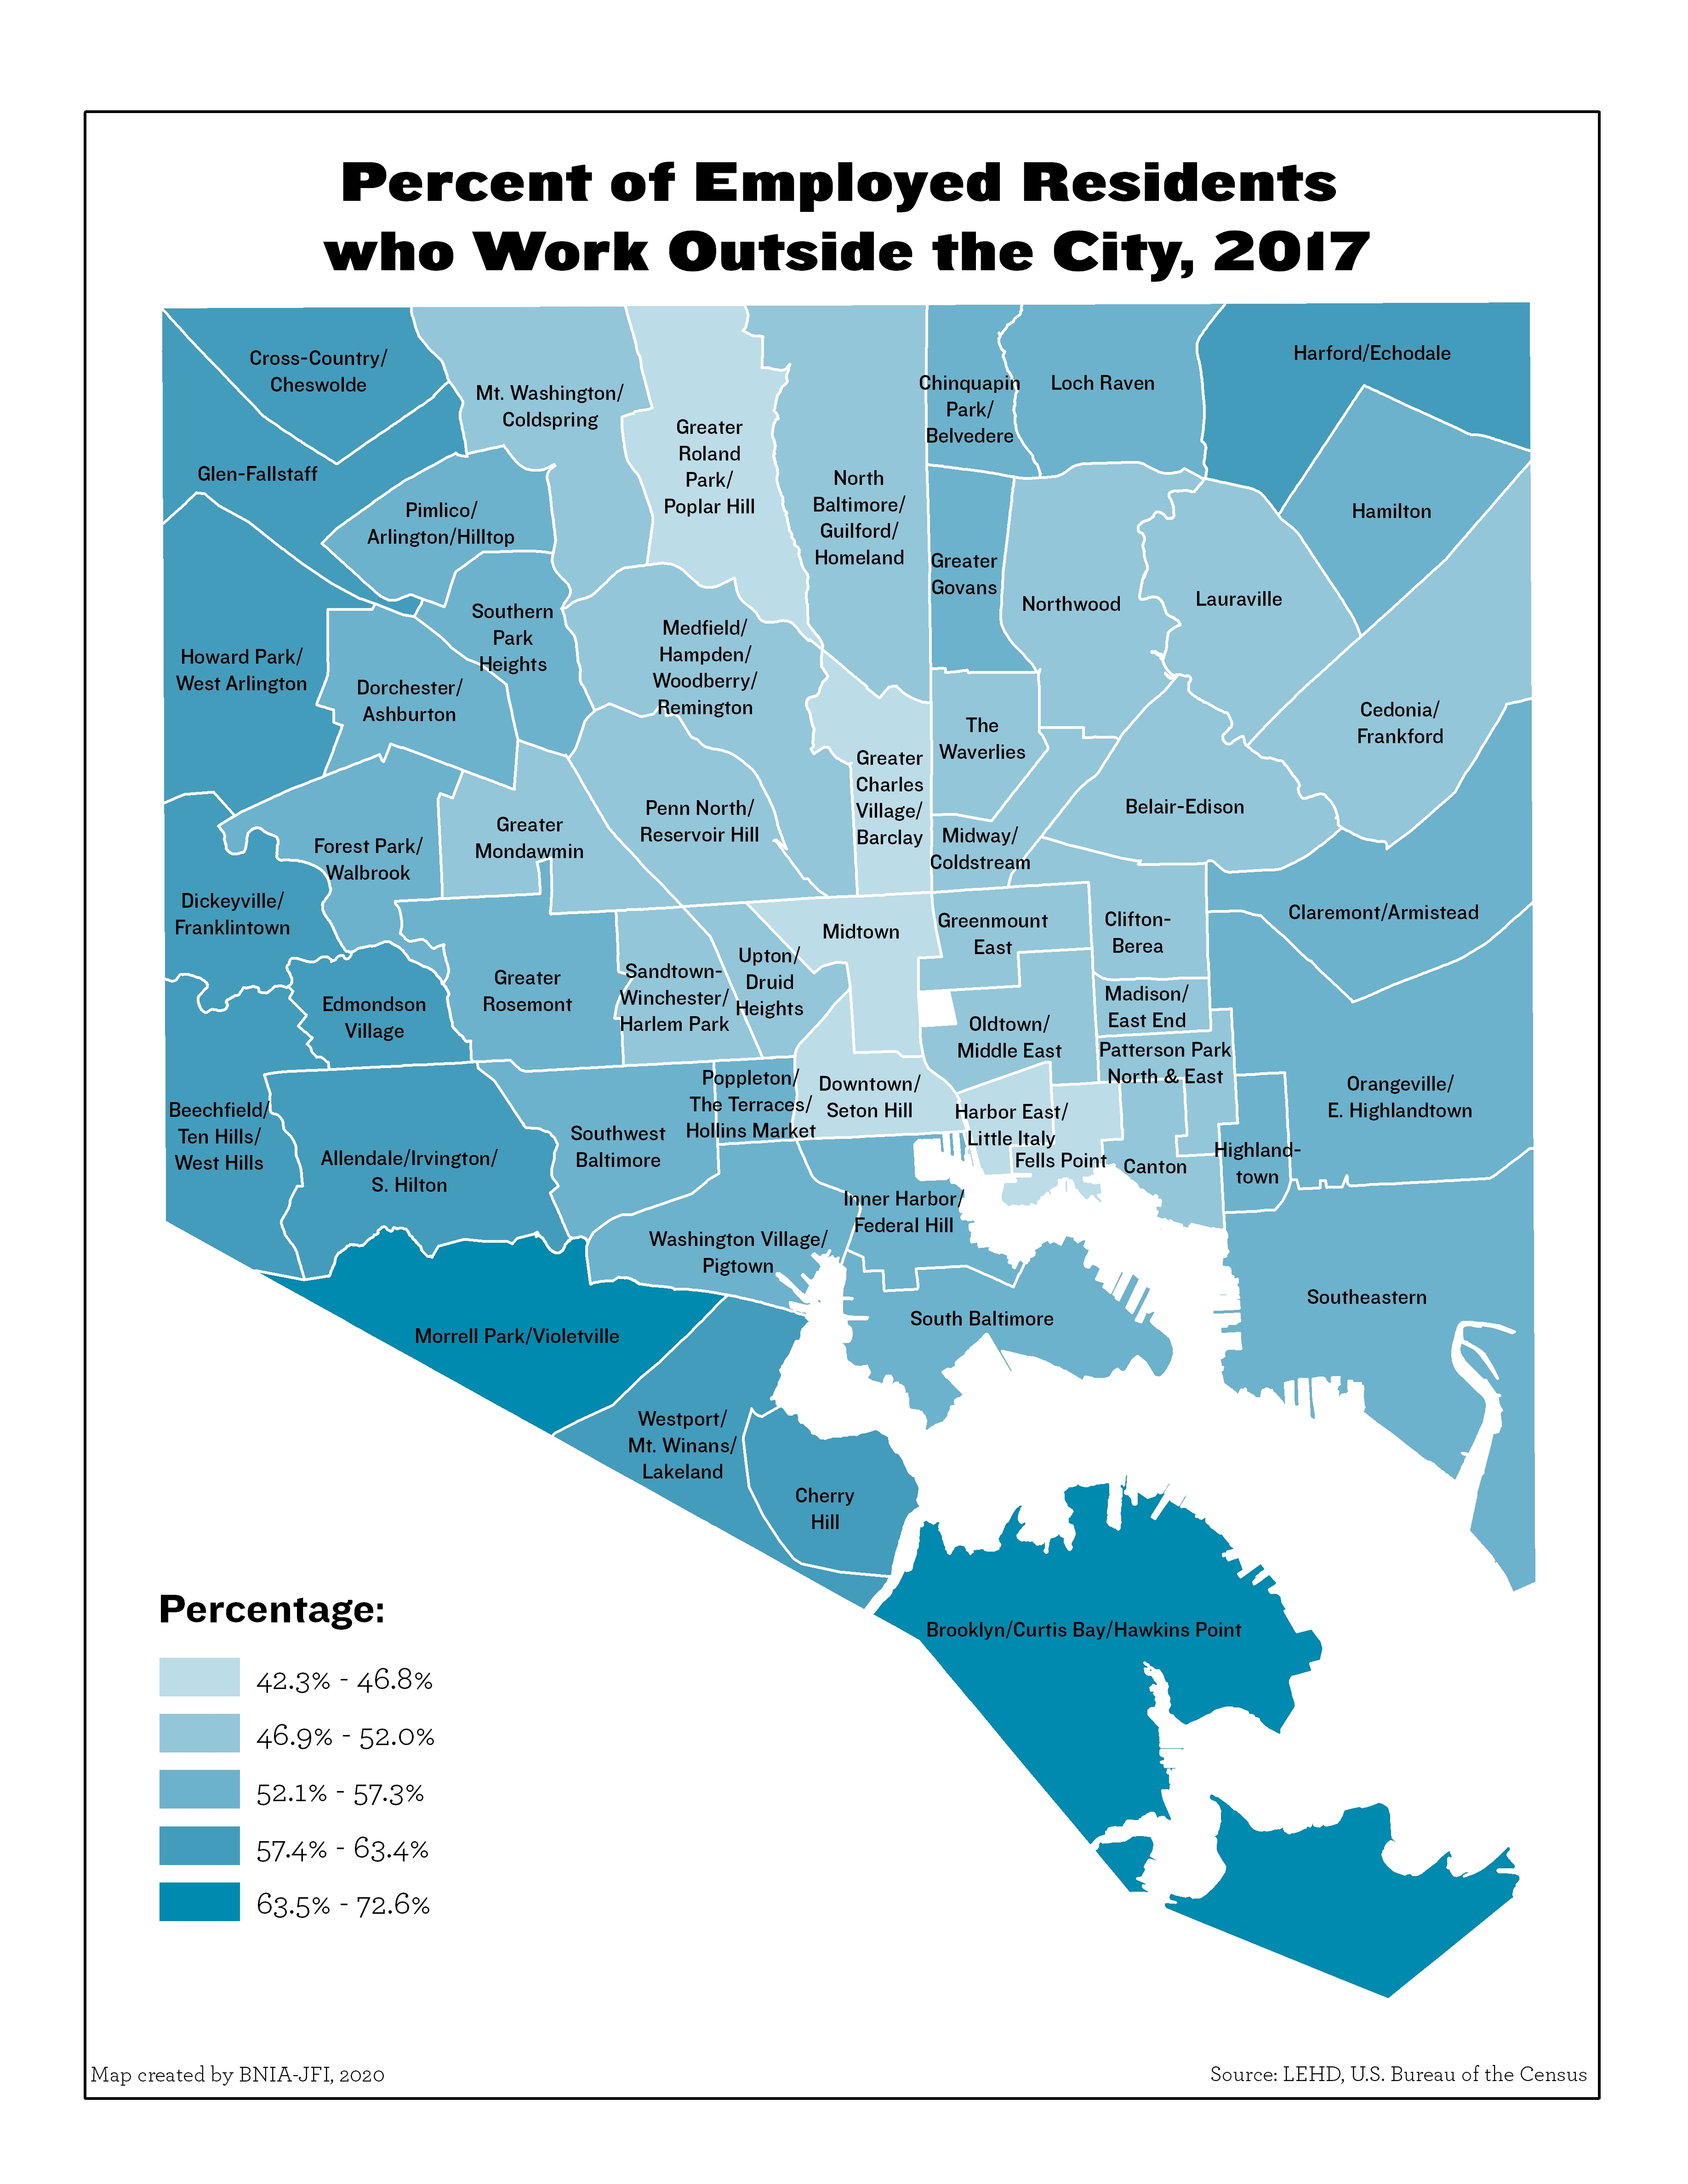
Percent of Employed Residents who Work Outside the City
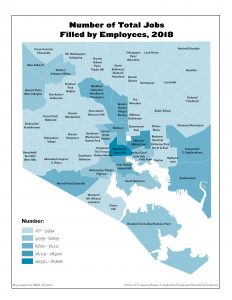
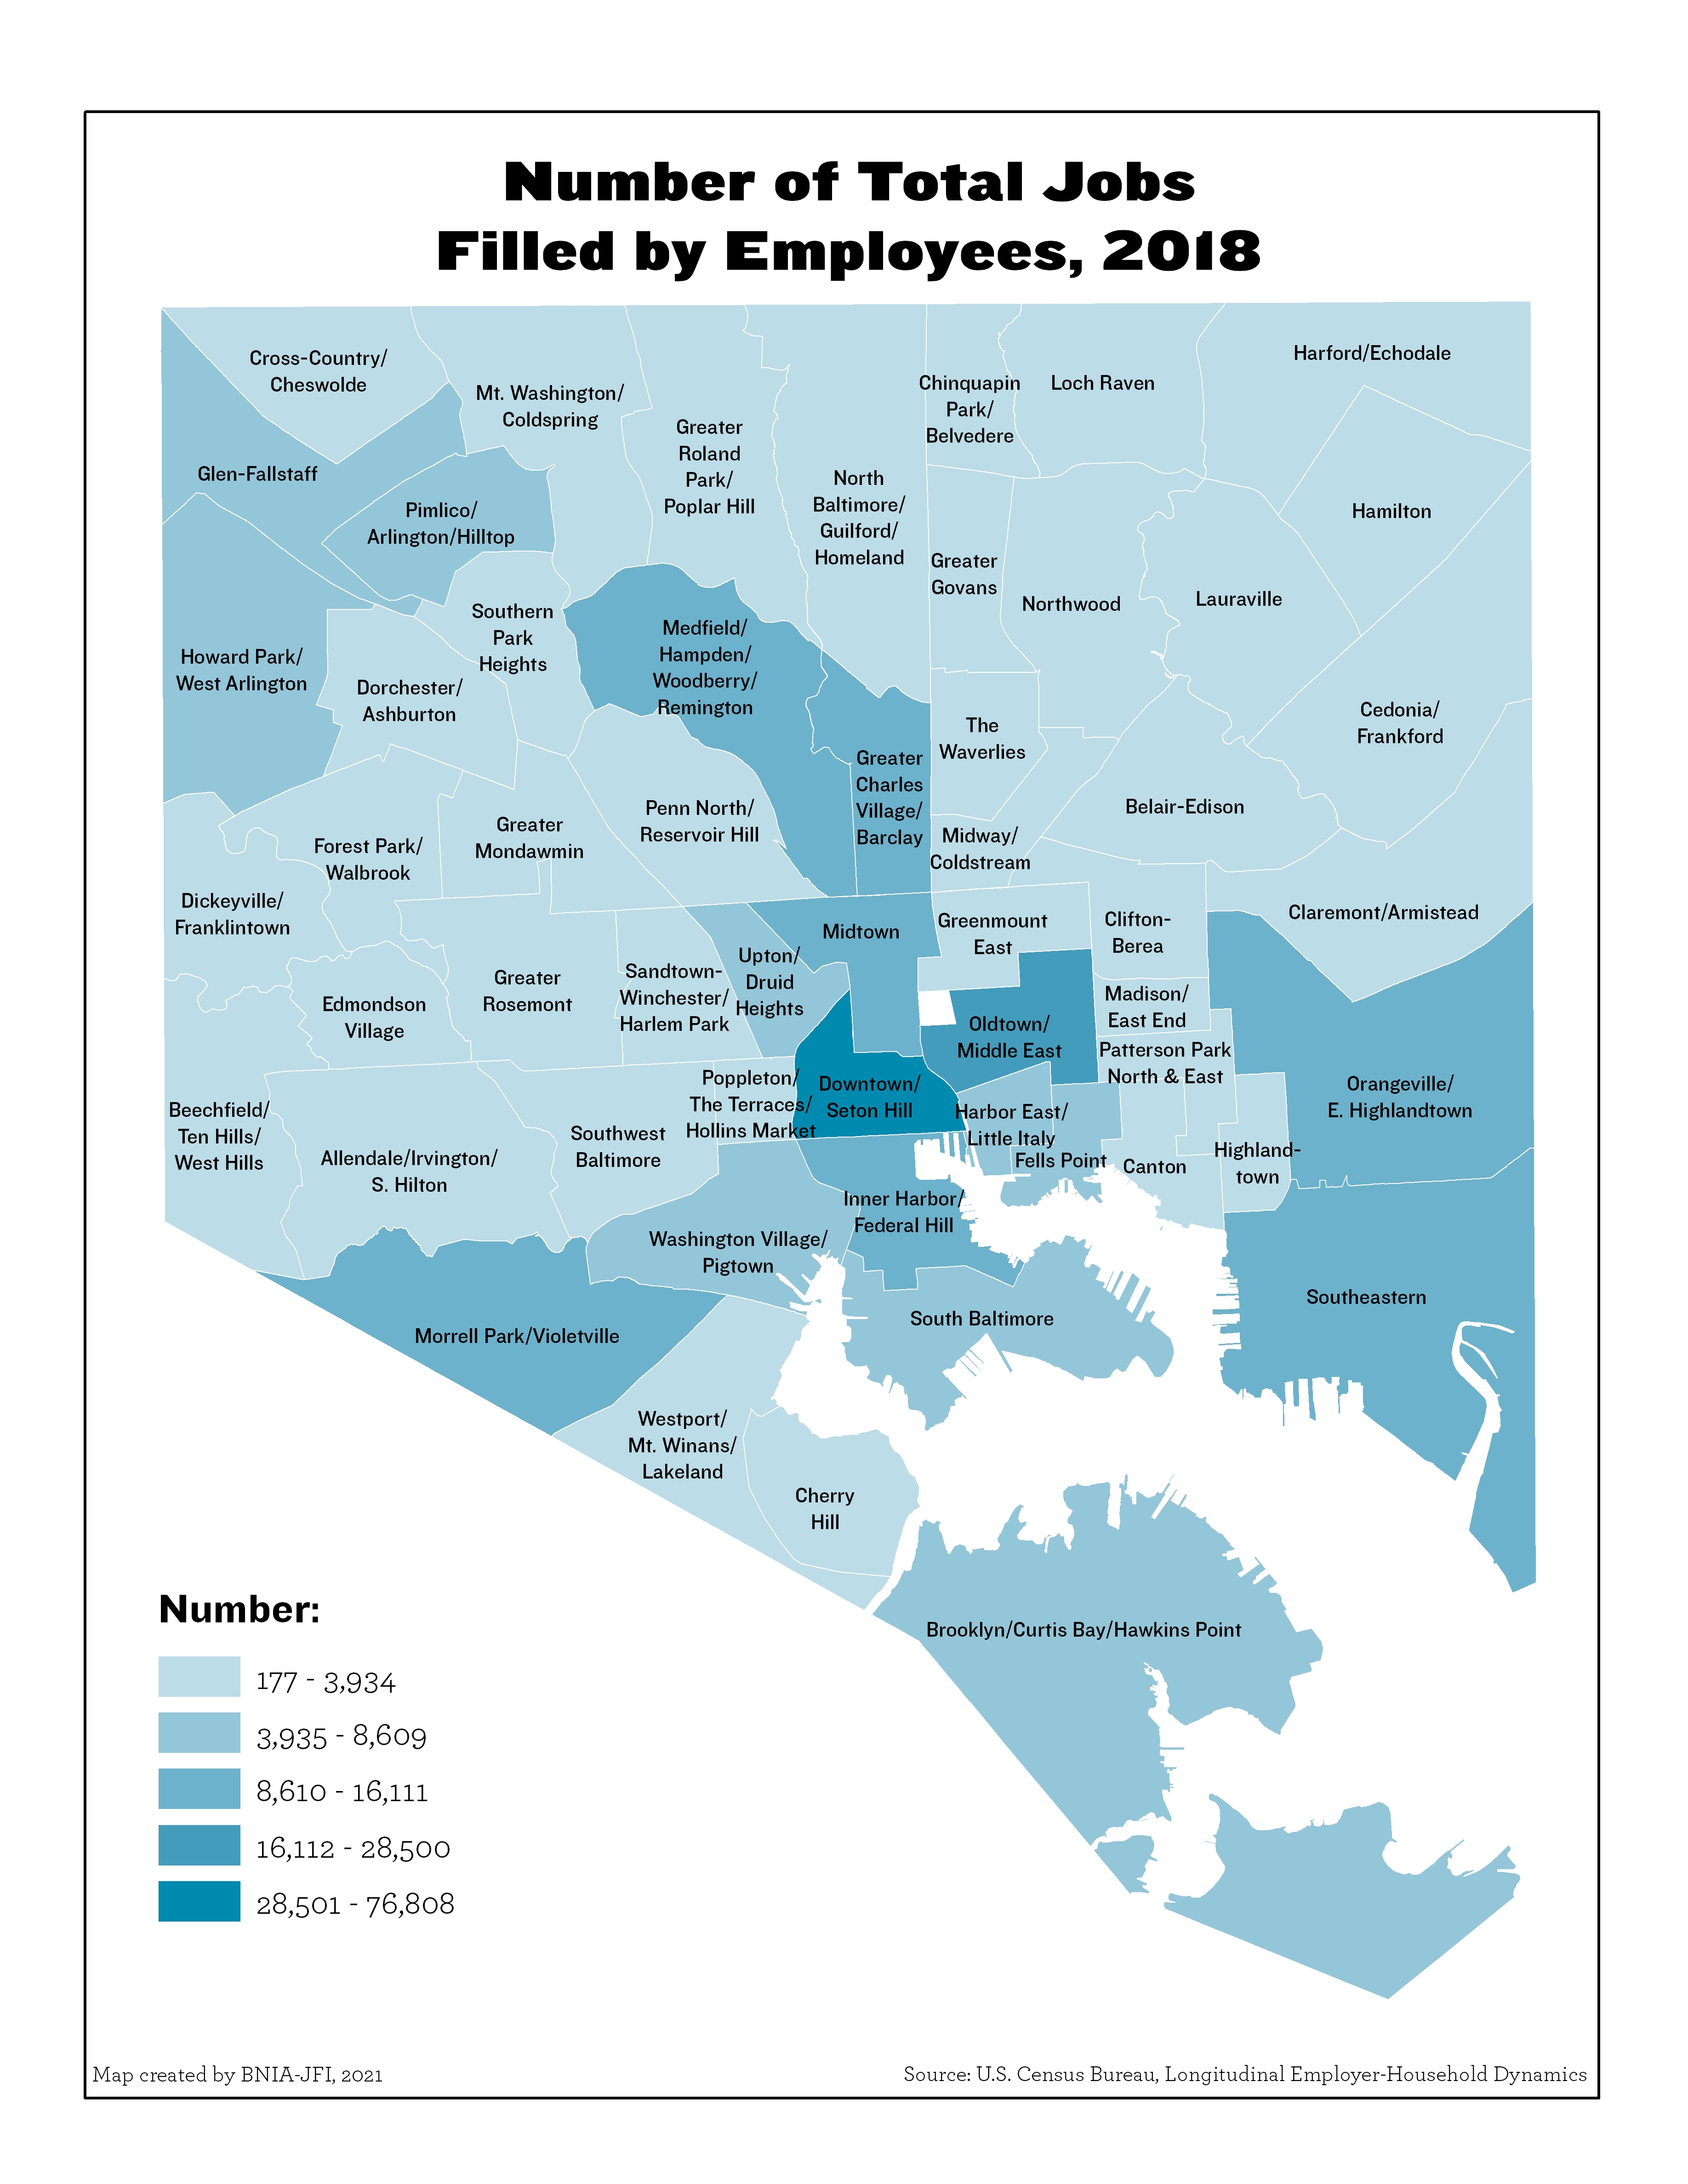
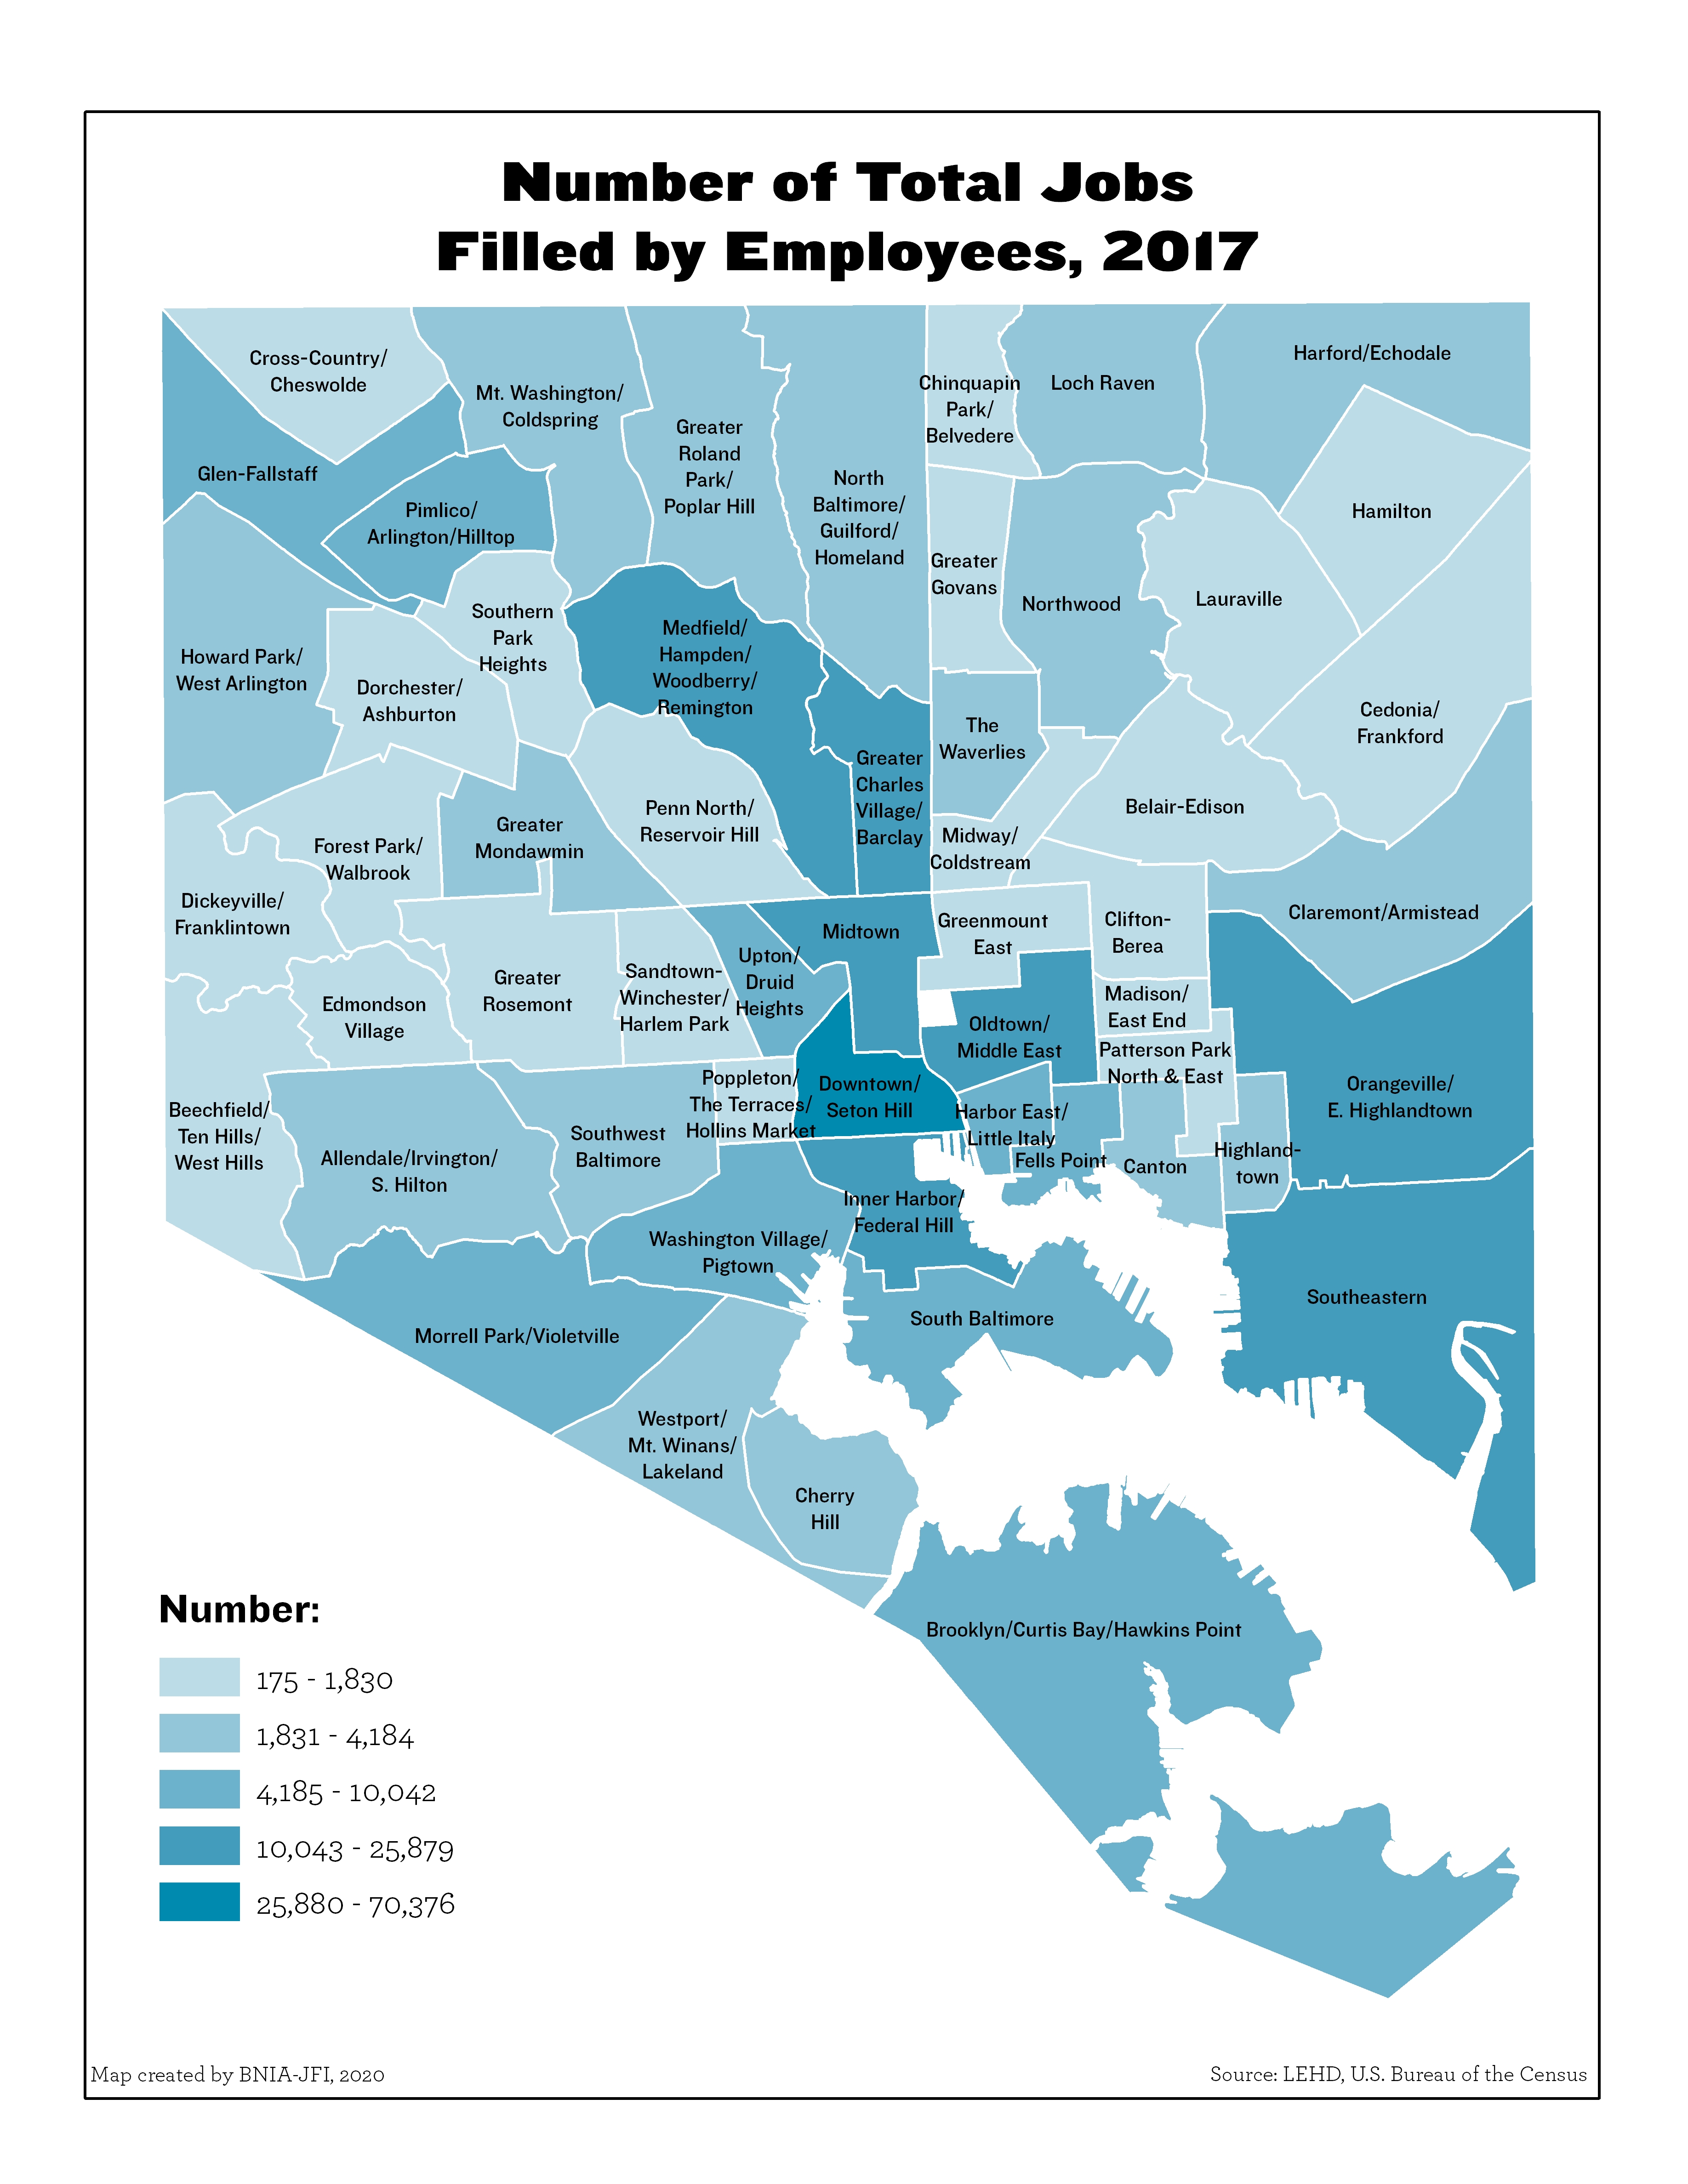
Number of Total Jobs Filled by Employees
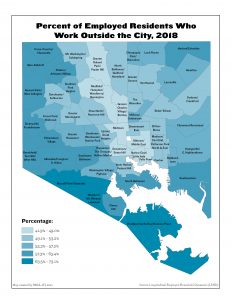
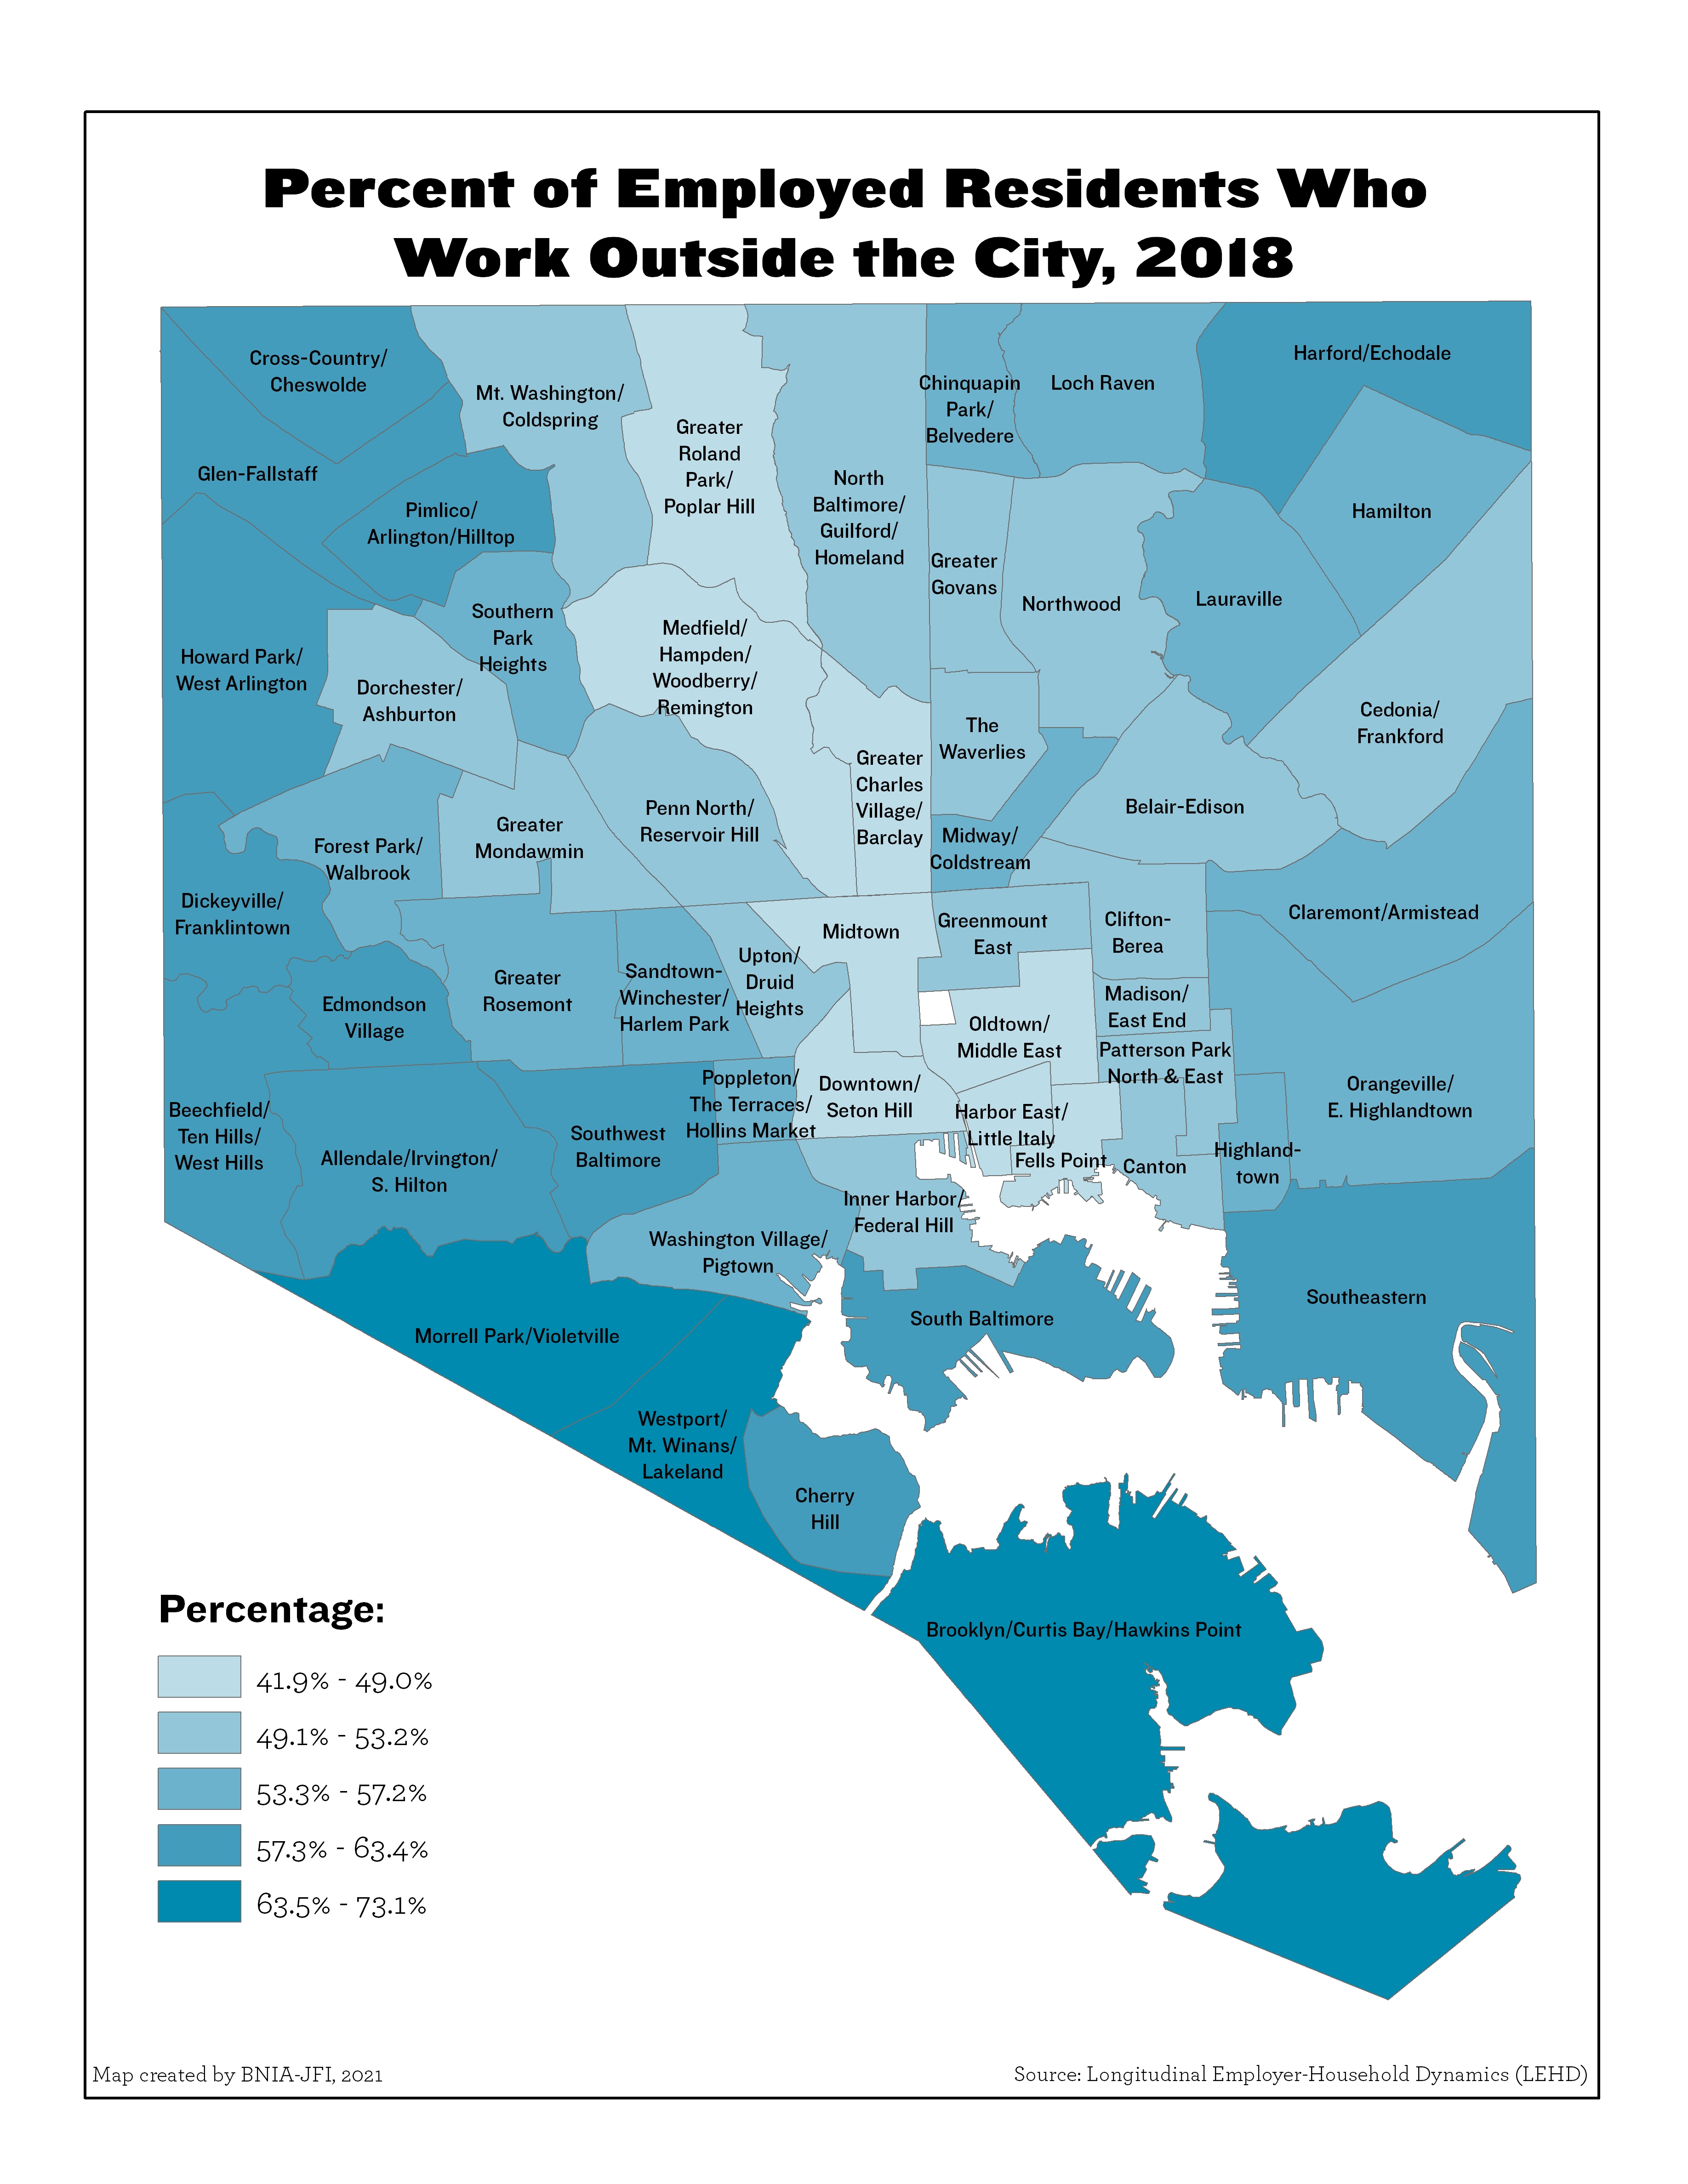
Percent of Employed Residents Who Work Outside the City
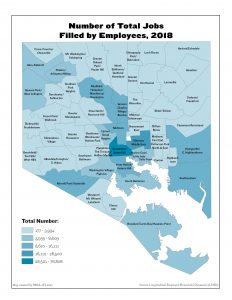
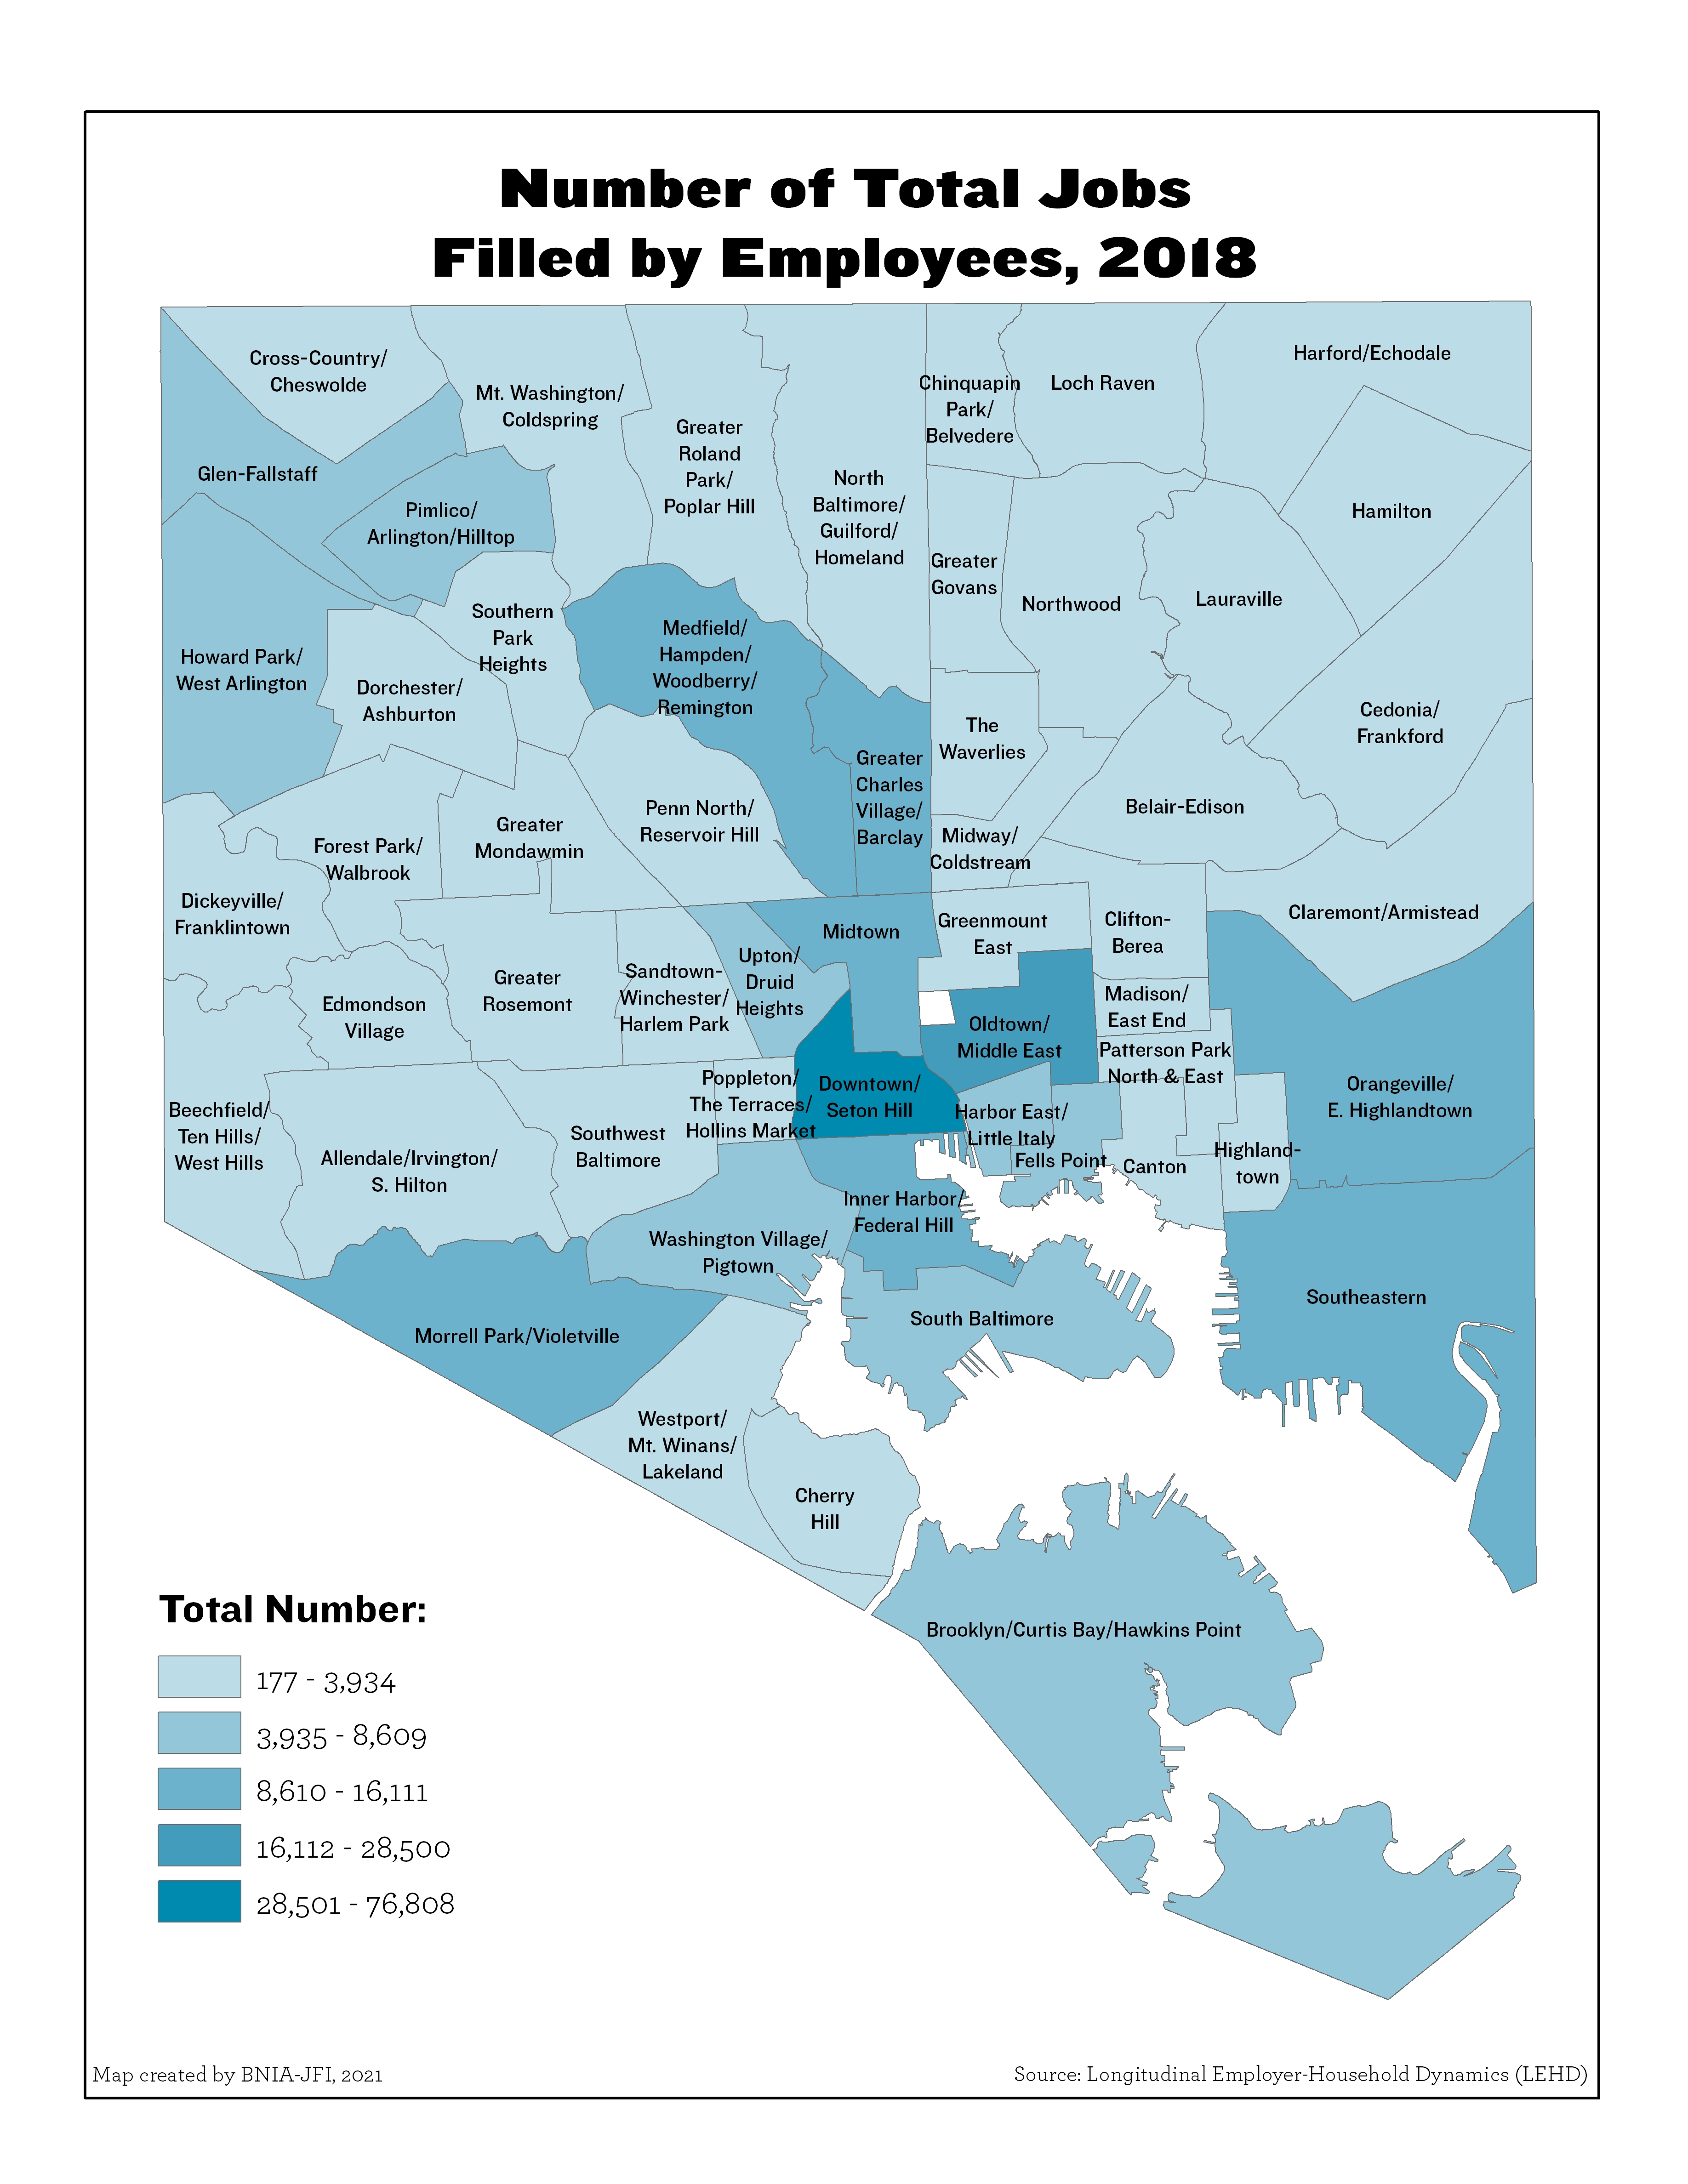
Number of Total Jobs Filled by Employees